Discovery of a 34 Hz Quasi-Periodic Oscillation in the X-ray emission of GRS 1915+105
Abstract
We report the discovery in the Rossi X-Ray Timing Explorer data of GRS 1915+105 of a second quasi-periodic oscillation at 34 Hz, simultaneous with that observed at 68 Hz in the same observation. The data corresponded to those observations from 2003 where the 68-Hz oscillation was very strong. The significance of the detection is 4.2. These observations correspond to a very specific position in the colour-colour diagram for GRS 1915+105, corresponding to a harder spectrum compared to those where a 41 Hz oscillation was discovered. We discuss the possible implications of the new pair of frequencies comparing them with the existing theoretical models.
keywords:
accretion, accretion discs – black hole physics – relativistic processes – X-rays: binaries1 Introduction
High-Frequency Quasi-Periodic Oscillations (HFQPO) are signals at frequencies 30-450 Hz observed in the X-ray light curves of black-hole binaries (BHBs). These correspond to the time scales expected from Keplerian motion in the innermost regions of the gravitational well of the black hole. They constitute the most promising way to use timing signals to measure fundamental parameters of the black hole such as its spin and the existence of a innermost stable orbit Unfortunately, their investigation has been hindered by the scarcity of detections available from 16 years of operations of the Rossi X-Ray Timing Explorer (RXTE), whose Proportional Counter Array (PCA) was the only instrument able to provide the necessary signal to noise for the detections. Very few detections were reported from thousands of high-quality observations of BHBs (see Belloni, Sanna & Méndez 2012 and references therein; see also Altamirano & Belloni 2012 on the discovery of 67 Hz HFQPOs in the black hole system IGR J17091–3624; Altamirano et al. 2011). There is evidence that these oscillations appear at specific frequencies for each source, although the small number of cases does not allow to say something more firm. In a few cases, pairs of peaks have been observed simultaneously. In these cases, the peaks appear to be close to small integer ratios (2:3, 3:5). This has been interpreted associating the QPO frequencies to relativistic time scales at a specific radius, where these frequencies are in resonance, resulting therefore in special frequency ratios (Kluźniak & Abramowicz 2001). Another model, the relativistic precession model (see Stella et al. 1999 and references therein), makes predictions about the frequencies of both high-frequency peaks, but does not lead to specific ratios. Other models exist, which predict different spectra of signals potentially observable in the data.
One system stands out in this and many other respects: the very bright BHB GRS 1915+105 (see Fender & Belloni 2004 for a review). This very peculiar BHB has been observed thousands of times by RXTE. A few cases of HFQPOs from GRS 1915+105 were reported in the literature (Morgan et al. 1997; Strohmayer 2001; Belloni et al. 2001; Remillard et al. 2003; Belloni et al. 2006). Strohmayer (2001) reported the discovery of two simultaneous oscillations at 41 and 69 Hz (which give the 2:3 ratio mentioned above). Recently, Belloni & Altamirano (2012, hereafter BA12) have carried out a systematic study of all RXTE observations of GRS 1915+105 and have detected HFQPOs in 51 observations. All but three of these were restricted to a small range of frequencies between 63 and 71 Hz. Their procedure did not lead to the detection of pairs. However, Strohmayer (2001) averaged several observations to reach his detections. Here we report the detection of an additional HFQPO at 34 Hz, observed when the higher-frequency one was around 68 Hz. We obtained it by averaging the observations corresponding to 3 of the 5 strongest detections in BA12.
2 Data analysis
In the sample of HFQPOs of BA12, only five cases featured a detection with a single-trial significance larger than 10. Two of them correspond to early 1996 observations (ObsIDs 10408-01-04-00/06-00, corresponding to Obs. #3 and #5 in BA12, respectively) and are the same as those reported by Morgan et al. (1997). The remaining three (ObsIDs 80701-01-28-00/01/02, corresponding to Obs. #38, #39 and #40 in BA12, respectively) are observations made on Oct 21, 2003 (MJD 52933), when the HFQPO was at a frequency of 68.3, 67.8 and 67.8 Hz for the three observations, respectively. The light curves of the three observations at 1-s time resolution can be seen in Fig. 1. In the classification of Belloni et al. (2000) they correspond to class . In comparison, the strong detection obtained in 1996 (Morgan et al. 1997) corresponded to class . Regardless of the class, the position in the colour-colour diagram (and hence spectral shape) is what appears to be associated to the presence of the QPO (see below).

For the timing analysis we followed the same procedure as in BA12. We produced a combined power density spectra (PDS) of the three observations of 2003 Oct 21 by dividing the total dataset (selecting PCA absolute channels 8–79, 3.28–33.43 keV) in 16-s stretches and averaging the corresponding PDS. The total exposure was 4576 s, corresponding to 286 stretches. The time resolution of the data was 4096 points per second, leading to a Nyquist frequency of 2 kHz. We normalised the PDS according to Leahy et al. (1983) and rebinned the powers logarithmically so that each frequency bin was larger than the previous one by 2%. We estimated errors on power values following van der Klis (1988).
As in BA12, we use the 16-s time-resolution Standard 2 mode data to calculate X-ray colours. We defined the soft colour (HR1) as the count rate in the 6.0–16.0 keV band divided by the rate in the 2.0–6.0 keV band and the hard colour (HR2) as the ratio of the count rates in the 16.0–20.0 keV rate divided by the 2.0–6.0 keV rate. For more information about how the colours were estimated, see BA12.
3 Results
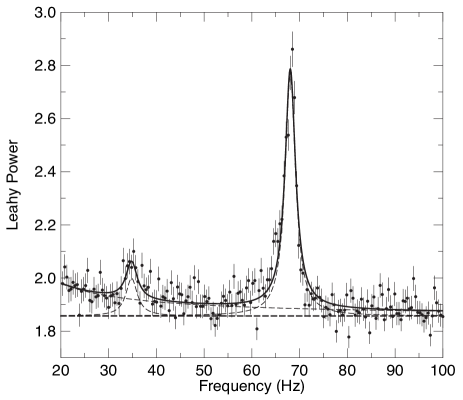
In Fig. 2 we show the high-frequency part of the PDS estimated after averaging the three observations performed in 2003 Oct 21. In addition to the strong QPO around 68 Hz, a second peak around 34 Hz is seen. A fit with a model consisting of a flat component to account for the Poissonian noise, a power law to account for residual source noise and two Lorentzian components for the two peaks yields a best fit to the 20-100 Hz region of the PDS with a of 190 for 139 degrees of freedom. The relatively high value is due to the combination of two facts: the 68 Hz peaks in the three observations have slightly different centroid frequency (suggesting that the centroid frequency is drifting moderately with time) and the peak within one observation is asymmetric. (It is beyond the scope of this work to understand if the asymmetry we find also within each observation is intrinsic to the signal or due to frequency drifts within a 1000 s). The best first parameters for the two HFQPOs are shown in Tab. 1. The detection significance of the 68 and 34 Hz peaks are 24 and 4.2 respectively (single trial). The quality factor (centroid frequency divided by FWHM, i.e., a measure of the coherence of a peak in the PDS) is 24.70.3 and 13.11.2, respectively. The formal 1 errors on the centroids are very small. However, additional systematics can affect the accuracy of this measurement. As mentioned above, the peaks are not symmetric in frequency, due to centroid drifting, although some intrinsic asymmetry cannot be excluded. Therefore, the statistical accuracy of the centroid measurements needs to be taken as a lower limit. We extracted PDS from energy sub-selections in order to study the rms spectrum of the 34 Hz QPO, but the signal is too weak to yield significant results (for the rms spectrum of the 68 Hz QPO, see BA12).
| Parameter | QPO1 | QPO2 |
|---|---|---|
| Centroid (Hz) | 34.960.28 | 68.030.06 |
| FWHM (Hz) | 2.670.89 | 2.750.16 |
| % rms | 0.810.09 | 2.040.04 |
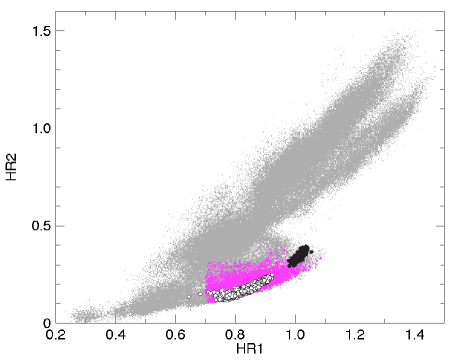
In analogy with what done in BA12, we selected from all 16s intervals from the full set of archival data those corresponding to similar X-ray colors and/or count rates and produced average power spectra from them. Figure 3 shows the colour-colour diagram including all 16 s data-points of the 1800 observations available (light grey points). The dark grey (magenta in the colour version) points are those with positive 68 Hz QPO detections within each observation from the full sample (see BA12). The black points are those corresponding to the three observations analysed here, the white points are those from Strohmayer (2001), where the 41 Hz QPO was detected. It is clear that the points corresponding to the 34 Hz detection are narrowly distributed in an extreme part of the colour-colour diagram. No significant detection could be obtained from the relatively low number of points (a total of no more of s of data) within the black area after the three observations reported here have been removed. We also investigated whether the other two observations (ObsIDs 10408-01-04-00/06-00) with highly significant 68 Hz QPO, added together, show any evidence for a QPO at 34 Hz, but found none, with a 3 upper limit of 0.30% both at the same frequency of 2003 and at half the frequency of 1996. Adding all other observations with detections in single observations (see BA12) did not lead either to any evidence of the 34 Hz QPO, with a 3 upper limit of 0.16% at 34 Hz.
4 Discussion
In this work we report the discovery of a 34 Hz QPO in observations of the black hole Low-Mass X-Ray Binary GRS 1915+105. This QPO was detected during three of the 5 observations (in a total of 1800 observations) where the 68 Hz QPO was more than significant. These three observations occupy a narrow and un-sampled region of the colour-colour diagram (see Figure 3) suggesting that the appearance (or the strength) of this QPO is related to the source state. The ratio between the centroid frequency of the high-frequency peak and that of the low-frequency peak we have discovered is R=1.950.05 (3 error), consistent within 3 with a harmonic nature of the two signals. This is the first case of two HFQPOs with such a frequency ratio in GRS 1915+105.
Strohmayer (2001) found a similar pair, with frequencies 41.50.4 Hz and 69.20.15 Hz, with a ratio of 1.670.01 averaging five observations from 1997, all corresponding to variability class , similar to . In Fig. 3, we mark the points corresponding to when the 41 Hz QPO was found with white circles. Belloni, Méndez & Sánchez-Fernández 2001 reported the discovery of a 27 Hz QPO, however, this feature was not detected simultaneously with other peaks. Comparing the region marked by black circles (where the 34 Hz QPO was detected) with that of the observations where a 41 Hz QPO has been found (white circles), we see that the 34 Hz QPO is found when the spectrum was harder (see Fig. 3). Since in this state the energy spectrum is dominated by the thermal disk component, this suggests that the 34 Hz feature is associated to a higher disk temperature than the 41 Hz one.
Given the scarce number of detections of these QPOs, it is not possible to tell whether the 27 Hz, 34 Hz and the 41 Hz are the same QPO or not. If the 34 Hz and the 41 Hz are produced by the same mechanism, we find that its frequency have drifted by 161%, while the peak frequency of the 68 Hz QPO only by 1.70.2%, i.e., while the upper QPO remained almost constant (see BA12), the lower one can drift significantly. This means that neither the ratio nor the difference between the centroids of the low- and high-frequency peaks (i.e. 34-41 Hz and 68 Hz, respectively) is constant. None of the existing physical models (see BA12) to our knowledge is able to reproduce a couple of peaks of which only one changes frequency.
If the 34 Hz and 41 Hz peaks are two distinct features, together with the 27 Hz peak detected by Belloni, Méndez & Sánchez-Fernández 2001, we are observing different multiple peaks, which provide an important observational constraint for theoretical models. The relativistic precession model interprets the observed frequencies in terms of orbital, epicyclic and precession frequencies as predicted by General Relativity. As such, in its simplest form it predicts only two peaks in the high-frequency regime and that they naturally vary together (see Stella et al. 1999). The parametric resonance is based on the resonance between relativistic frequencies at a certain radius. As such, it predicts small integer ratios between HFQPO frequencies of the form = 2/n, but no major frequency shift (see Kluźniak & Abramowicz 2001). The sequence (27)-34-41-68 does not yield simple ratios. For a discussion of sub-harmonics of high-frequency oscillations within this framework, see Rebusco et al. (2012). The disko-seismic global oscillation model (see Nowak & Wagoner 1993 and references therein) interprets the observed signals as trapped global oscillation modes in the accretion flow. It naturally features harmonic structure in the oscillations, although a precise identification of the frequencies is not clear. Local acoustic models (Lubow & Pringle 1993) predict a spectrum of vertical acoustic oscillation modes. At a given radius, the frequencies of these modes are = where is the Keplerian orbital frequency. Simple combinations of the first frequencies of the series are already not compatible with the observed values. The accretion-ejection instability model is based on the Rossby Wave Instability (RWI), where a wave is trapped in a magnetised accretion disk and has a direct connection to jet ejection. It also predicts the excitation of higher modes, whose relative ratio depending on physical parameters (Tagger & Verniére 2006). In the inner torus oscillation model, based on acoustic oscillations in the innermost regions of the accretion flow (Rezzolla et al. 2003), a harmonic sequence is natural, but the sequence observed here is not harmonic. Finally, the model proposed by Psaltis & Norman (2001) assume a transition radius in the accretion disk and study its effect as a filter on a spectrum of density fluctuations. The model can have multiple modes excited and yield multiple peaks. All of these models need to be tested against the new set of frequencies.
Interestingly, the FWHM of the 34 Hz and 68 Hz peaks in our observations is consistent with being the same. Unlike the case of low-frequency QPOs (LFQPOs), where it is the Q factor that remains constant between different peaks (see Rao et al. 2010, but see Ratti, Belloni & Motta 2012), if the mechanism that broadens the peaks is the same, it is consistent with being an amplitude modulation of the signal. In other words, the width of the peaks, their quasi-periodic nature, could be interpreted as a signal which is modulated in amplitude, where both HFQPOs are modulated in the same way. Assuming that the 34 Hz and the 68 Hz are harmonically related leads to the possibility that the 34 Hz QPO is the fundamental, or that it is subharmonic of the 68 Hz QPO. If the 34 Hz is the subharmonic, then the physical mechanism that produces the HFQPO must be non-linear. If the 34 Hz QPO is the fundamental, one would need to understand why the fundamental can be (much) weaker (in terms of fractional rms amplitude) than the first harmonic (by a factor larger than 3), and in almost all cases not even be detected. This would point to a physical mechanism which can be highly symmetric (such the symmetry inherent in the geometry of a tilted precessing orbit); however, it could also point to a scenario where the mechanism that sets the frequency of the oscillation is independent from that which sets its amplitude (e.g., Altamirano et al. 2008 and references therein), the later possibly favouring in this case the higher frequencies.
Very recently Altamirano & Belloni 2012 reported on the discovery of 67 Hz QPOs in IGR J17091–3624, the first black-hole system to show strong phenomenological similarities to those seen in GRS 1915+105 (Altamirano et al. 2011). The fact that the HFQPOs frequency in IGR J17091-3624 matches surprisingly well with that seen in GRS 1915+105 raises questions on the mass scaling of QPOs frequency in these two systems, as IGR J17091–3624 might be a factor few less massive than GRS 1915+105 (Altamirano et al. 2011; although note that these authors’ conclusion strongly depend on the distance and mass of IGR J17091–3624, both completely unconstrained today). Of course, the observed frequencies are likely to depend also on the (unknown) spin of the source, making the comparison even more complex. In any case, if the 34 Hz QPO we detect in GRS 1915+105 represents the fundamental frequency, mass estimates for GRS 1915+105 will change depending on the theoretical model assumed and generally leading to a less massive black-hole (e.g, Nowak et al. 1997, Morgan et al. 1997). The correct identification of the 34 Hz and 68 Hz QPOs has therefore important implications on works that use the 68 Hz HFQPO in GRS 1915+105 as a standard measurement to estimate the mass of Galactic or supermassive black holes (e.g., Middleton & Done 2010).
Whatever the answer is, the situation of HFQPOs is clearly complex once sensitive observations allow us to obtain more detections. This opens the possibility to make major steps forward with the upcoming Indian X-ray mission ASTROSAT (Agrawal 2006), whose sensitivity above 10 keV is much improved compared to the RXTE/PCA. If selected by ESA, the LOFT mission with its much larger effective area will extend the current sensitivity down by one order of magnitude and will allow the study of additional weaker modes, providing a full spectrum of oscillation modes (see Feroci et al. 2010).
Acknowledgments
The research leading to these results has received funding from the European Community Seventh Framework Programme (FP7/2007-2013) under grant agreement number ITN 215212 “Black Hole Universe”.
References
- Agrawal (2006) Agrawal, P.C., 2006, Adv. Sp. Res, 38, 2989
- Altamirano et al. (2008) Altamirano, D., van der Klis, M., Méndez, M., Jonker, P.G., Klein-Wolt, M., Lewin, W.H.G., 2008, ApJ, 685, 436
- Altamirano & Belloni (2012) Altamirano, D., Belloni, T, 2012, ApJ, 747, L4
- Altamirano et al. (2012) Altamirano D., Belloni T., Linares M., van der Klis M., Wijnands R., Curran P. A., Kalamkar M., Stiele H., et al., 2011, ApJ, 742, L17
- Belloni & Altamirano (2012) Belloni, T.M., Altamirano, D., 2012, MNRAS, submitted
- Belloni, Sanna & Méndez (2012) Belloni, T.M., Sanna, A., Méndez, M., 2012, MNRAS, 426, 1701
- Altamirano et al. (2011) Altamirano, D., Belloni, T., Linares, M., et al., 2011, ApJ, 742, L17
- Belloni et al. (2000) Belloni, T.M., Klein-Wolt, M., Méndez, M., van der Klis, M., van Paradijs, J., 2000, A&A, 355, 271
- Belloni et al. (2001) Belloni, T.M., Méndez, M., Sánchez-Fernández, 2001, A&A, 372, 551
- Belloni et al. (2006) Belloni, T.M., Soleri, P., Casella, P., 2006, MNRAS, 369, 305
- Fender & Belloni (2004) Fender, R.P., Belloni, T., 2004, ARA&A, 42, 317
- Homan et al. (2010) Feroci, M., Stella, L., Vecchi, A. et al., 2010, SPIE, 7732, 57
- Kluźniak & Abramowicz (2001) Kluźniak, W., Abramowicz, M., 2001, A&A, 374, L19
- Leahy et al. (1983) Leahy D. A., Darbro W., Elsner R. F., Weisskopf M. C., Kahn S., Sutherland P. G., Grindlay J. E., 1983, ApJ, 266, 160
- Lubow & Pringle (1993) Lubow, S.H., Pringle, J.E., 1993, ApJ, 409, 360
- Middleton & Done (2010) Middleton, M., Done, C., 2010, MNRAS, 403, 9
- Morgan et al. (1997) Morgan, E.H., Remillard, R.A., Greiner, J., 1997, ApJ, 482, 993
- Nowak & Wagoner (1993) Nowak, M.A., Wagoner, R.V., 1993, ApJ, 418, 187
- Nowak et al. (1997) Nowak, M.A., Wagoner, R.V., Begelman, M.C., Lehr, D.E., 1997, ApJ, 477, L91
- Psaltis & Norman (2000) Psaltis, D., Norman, C., astro-ph/0001391
- Rao et al. (2010) Rao, F., Belloni, T., Stella, L., Zhang, S.N., Li, T., ApJ, 714, 1065
- Ratti et al. (2012) Ratti, E., Belloni, T.M., Motta, S.E., 2012 MNRAS, 423, 694
- Rebusco et al. (2012) Rebusco, P. Moskalik, P., Kluźniak, W., Abramowicz, M.A., 2012, A& A 540, L4
- Remillard et al. (2002) Remillard R., Muno M., McClintock J.E., Orosz, J., 2003, in Durouchoux Ph., Fuchs Y., Rodriguez J., eds, New Views on Microquasars. Center for Space Physics, Kolkata, India, p. 49
- Rezzolla et al. (2003) Rezzolla, L., Yoshida, S., Maccarone, T. J., Zanotti, O., 2003, MNRAS, 344, L37
- Stella et al. (1999) Stella, L., Vietri, M., Morsink, S.M., 1999, ApJ, 524, L63
- Strohmayer (2001) Strohmayer, T., 2001, ApJ, 554, L169
- Tagger & Verniére (2006) Tagger, M., Verniére, P., 2006, ApJ, 652,1457
- van der Klis (1998) van der Klis M., 1998, in “The Many Faces of Neutron Stars,” NATO ASI Series 515, p. 337