A Survey for Planetary Nebulae in M31 Globular Clusters
Abstract
We report the results of an [O III] spectroscopic survey for planetary nebulae (PNe) located within the star clusters of M31. By examining spectra taken with the WIYN+Hydra spectrograph, we identify 3 PN candidates in a sample of 274 likely globular clusters, 2 candidates in objects which may be globular clusters, and 5 candidates in a set of 85 younger systems. The possible PNe are all faint, between and mag down the PN luminosity function, and, partly as a consequence of our selection criteria, have high excitation, with [O III] to H ratios ranging from 2 to . We discuss the individual candidates, their likelihood of cluster membership, and the possibility that they were formed via binary interactions within the clusters. Our data are consistent with the suggestion that PN formation within globular clusters correlates with binary encounter frequency, though, due to the small numbers and large uncertainties in the candidate list, this study does not provide sufficient evidence to confirm the hypothesis.
1 Introduction
Despite over a century of observations and decades of detailed modeling, the stellar population that forms planetary nebulae (PNe) is still somewhat of a mystery. The traditional theory states that the progenitors of PNe are low- to intermediate-mass single stars at the end of the AGB phase (Shklovski, 1956; Abell & Goldreich, 1966). This hypothesis explains the distribution of PNe throughout space, and is responsible for the widely-held belief that the Sun will eventually evolve through this easily identifiable nebular phase (e.g., Abell & Goldreich, 1966; Ciardullo et al., 1989; Buzzoni et al., 2006). However, this theory does not provide a natural explanation for the non-spherical morphologies observed for the great majority of PNe, nor their low rate of formation. For these and other inconsistencies (see De Marco, 2009), a new paradigm has been developed, wherein most planetary nebulae are shaped via the interaction of an AGB wind with a binary companion (e.g., Soker, 1997).
Unfortunately, while the binary interaction model explains some of the anomalies associated with the observed planetary nebula population (Moe & De Marco, 2006; De Marco, 2009; Moe & De Marco, 2012), this theory awaits final confirmation: the number of PN central stars with known binary companions is still relatively small, and programs to detect such objects are extremely challenging (De Marco et al., 2011, 2012). Moreover, neither the single-star nor binary-star hypothesis can explain the luminosities observed for PNe in the old stellar populations of elliptical galaxies and spiral bulges (Ciardullo et al., 2005), nor the invariance of the bright end of the planetary nebula luminosity function (PNLF) across stellar populations (Ciardullo et al., 2002). For this, one must invoke yet another formation scenario, wherein significant mass transfer (or a complete stellar merger) occurs prior to the planetary nebula phase (Ciardullo et al., 2005; Soker, 2006).
It is difficult to probe the different PN formation scenarios using field stars, since one has almost no prior information about the properties of the PN progenitors. However, within star clusters, the situation is different, as both the age and metallicity of the progenitor can be accessed. Moreover, the low turnoff mass of old globular clusters (GCs) provides a tool with which to probe the binary formation scenario directly. Because GCs generally have turnoff masses less than , any post-AGB core arising from simple single-star stellar evolution must have a very small mass, (Kalirai et al., 2008), and an extremely long evolutionary timescale, yr (e.g., Caloi, 1989). Such objects cannot make planetary nebulae by themselves, since the mass lost during the AGB phase will disperse long before the core becomes hot enough to generate ionizing radiation. Any PN detected in these systems must therefore come from an alternate evolutionary channel, such as a common-envelope interaction or a mass augmentation process (i.e., a stellar merger).
Searches for planetary nebulae in Galactic clusters have turned up only a few associated objects. Although more than a dozen PNe are projected near open clusters, the vast majority are undoubtedly line-of-sight coincidences (Majaess et al., 2007; Parker et al., 2011). Similarly, out of 130 Galactic GCs surveyed, only four host PNe: Ps 1 in M15 (Pease, 1928), GJJC-1 in M22 (Gillett et al., 1986), JaFu1 in Pal 6, and JaFu2 in NGC 6441 (Jacoby et al., 1997). Two of these PNe have high mass central stars more appropriate to PNe within open clusters ( for Ps 1 and for GJJC-1; Bianchi et al., 2001; Harrington & Platoglou, 1993), while the others have highly non-spherical nebulae (De Marco, 2011). (The true nature of GJJC-1 is currently being re-assessed due to its high stellar mass, low nebular mass, and bizarre chemical composition (Jacoby et al., 2013), but for this paper, we adopt the usual PN classification.) These facts, along with the observation that three of the four PNe are located in clusters that are rich in X-ray sources, suggest that interacting binaries play a role in the formation of cluster PNe (Jacoby et al., 1997).
Since the sample of PNe within Galactic globular clusters is small, the significance of any conclusion based on their properties is low. To better understand the processes that form PNe within clusters, many more objects are required. For this, we must look to other galaxies. Unfortunately, while there have been a few isolated associations of [O III] emission with extragalactic globular clusters (Minniti & Rejkuba, 2002; Bergond et al., 2006; Larsen, 2008; Chomiuk et al., 2008), these discoveries have largely been serendipitous, and in most cases only sensitive to the most luminous planetary nebulae. Peacock et al. (2012) did conduct a systematic search for PNe within the massive globular clusters of the giant Virgo elliptical NGC 4472, but again, this survey (which did not find any objects) was only sensitive to objects in the top mag of the luminosity function. Since bright PNe are relatively rare, a deeper investigation is needed to place better constraints on the phenomenon.
Here we report the results of a spectroscopic survey for planetary nebulae within the star clusters of M31. In §2, we describe our multi-fiber observations and the basic reduction steps needed to analyze candidate star clusters in M31. In §3, we describe our search for embedded planetary nebulae, and the techniques required to recover objects that are more than mag down the planetary nebula luminosity function. We present a list of the clusters surveyed, along with their magnitudes and radial velocities, and identify those clusters in which [O III] emission is present. In §4, we describe the individual PN candidates and their host clusters. Finally, we discuss our results, and show that the number of PNe recovered within M31’s globular cluster system is roughly consistent with surveys of Milky Way clusters.
2 Observations and Reductions
On 2008 Oct 25-28 (UT), we targeted 467 candidate star clusters in M31 with the 3.5-m WIYN telescope on Kitt Peak and the Hydra multi-fiber spectrograph. The objects selected for study were largely taken from a list of clusters given in the Revised Bologna Catalog (RBC; Galleti et al., 2004, 2007) and supplemented using the X-ray cluster identifications of Fan et al. (2005) and the young cluster candidates of Caldwell et al. (2009). As a control, we also positioned spare fibers on known M31 planetary nebulae taken from the list of Merrett et al. (2006). These PNe span a range of brightnesses, from (i.e., ), and allowed us to test the depth of our exposures and the accuracy of our wavelength calibration. Finally, to estimate the background light and the amount of diffuse [O III] emission arising from M31’s disk, several fibers in each setup were offset onto regions of blank sky.
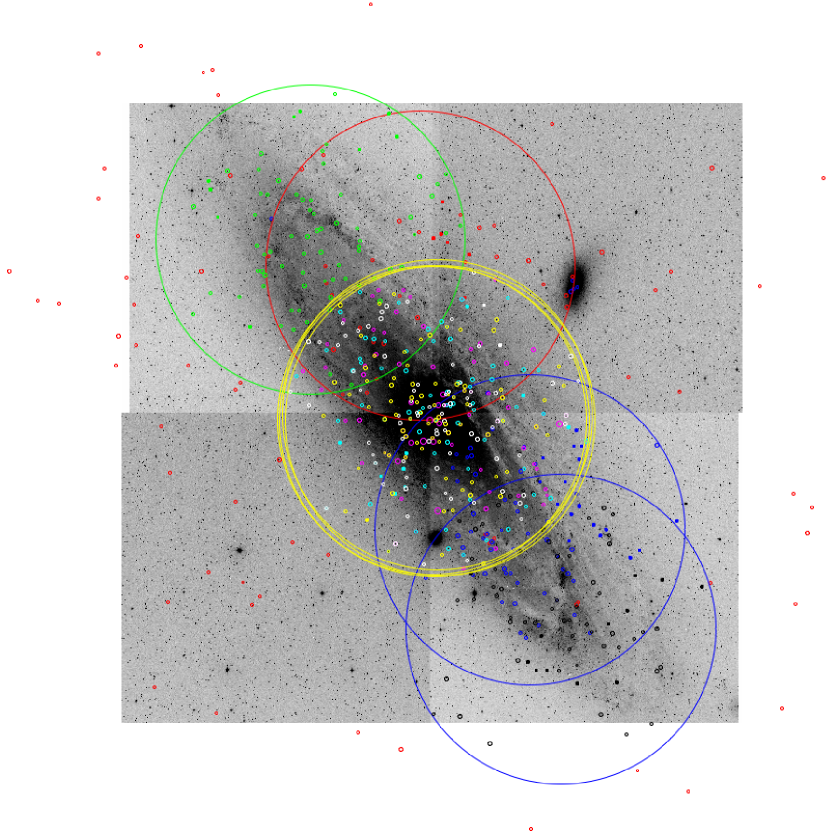
Our specific target selections were made using the fiber-assignment program whydra. Since the M31 globular cluster system covers a much larger area than the field-of-view of the WIYN+Hydra instrument (see Figure 1), we began by visualizing the locations of the individual clusters using the [O III] images of the Local Group Galaxies Survey (Massey et al., 2007). To accommodate the bulk of the galaxy’s cluster population, we located our first four setups on M31’s bulge. Thereafter, we alternated between regions southwest and northeast of the galactic center, each time allowing whydra to identify an optimal field position by searching a grid of space in increments, with 15 possible rotation angles (between and ) at each location. Top priority for fiber assignments was always given to previously unobserved clusters, with duplicate clusters, field PNe, and blank sky positions assigned lesser precedence. In total, eight different setups were executed over the four nights of the observing run, and data were acquired for 391 RBC clusters, 64 X-ray clusters, and 12 young clusters, with 30 of the systems being targeted more than once. An additional 55 of M31’s field planetary nebulae were also observed. A log of the observations is given in Table 1.
To execute these observations, the WIYN+Hydra system was configured to use the instrument’s array of diameter blue-sensitive fibers, the WIYN Bench spectrograph, and a 740 lines mm-1 Volume Phase Holographic (VPH) grating designed to optimize throughput near 5000 Å. The resultant spectra covered the wavelength range between 4400 Å and 5450 Å at 1 Å resolution and 0.5 Å pixel-1. Typically, each Hydra setup was observed for 3.5 hr via a series of seven 30 minute exposures.
Our initial reduction procedures were similar to those described in Herrmann & Ciardullo (2009). We began with the tasks within the IRAF111IRAF is distributed by the National Optical Astronomy Observatory, which is operated by the Association of Universities for Research in Astronomy (AURA) under cooperative agreement with the National Science Foundation. ccdred package: the data were trimmed and bias-subtracted via ccdproc, dome flats (typically three per setup) were combined using flatcombine, and CuAr comparison arcs, which bracketed the program exposures, were combined via imcombine. Next, dohydra within the hydra package was used to combine and linearize the spectra, with the averaged dome flats serving to define the extraction apertures, and the averaged comparison arcs providing the wavelength calibration. We estimate these wavelength calibrations to be precise to 0.04 Å yielding errors of km s-1. As we illustrate below, this is small in comparison with the other uncertainties associated with our radial velocity determinations.
After extracting each spectrum, the program objects were sky subtracted using the data acquired through our blank-field fibers. This step was straightforward: since all the data were taken in dark time and no bright sky lines fell within the wavelength range of the instrument, we simply used scombine to combine the extracted spectra from the multiple exposures and then invoked skysub to perform the subtraction. As will be explained in § 3, our searches for PN emission involved the subtraction of template spectra derived from the data themselves. Since these templates underwent the same sky subtraction, our procedure was differential in nature, and the details of sky subtraction had no significant effect on the analysis.
The final step in the basic data reduction involved estimating the response function of our instrument. Relative spectrophotometry across the entire spectral range of WIYN+Hydra was unnecessary for our program. Instead, we concentrated on determining the instrumental sensitivity at H and [O III] relative to [O III] . The [O III] calibration was straightforward. Of the 55 planetary nebulae targeted via our spare fibers, all but one were recovered in [O III] , and 51 out of 55 had detectable [O III] . By comparing the observed ratio of the oxygen doublet to the astrophysical ratio of 2.92, we concluded that the spectroscopic throughput at 4959 Å was that at 5007 Å.
The procedure for estimating the instrumental response at H was slightly more complicated. We began by identifying 15 bright clusters and comparing their continuum flux near 5000 Å to that surrounding the H line. Spectral libraries (e.g., Jacoby et al., 1984) show that, after applying M31’s foreground reddening (; Schlegel et al., 1998), the spectral energy distributions of old stellar populations should be flat between 4800 Å and 5100 Å. Consequently, to estimate the relative system response at H, we simply adopted the inverse of the observed to H continuum ratio. Our estimate of 68% is slightly greater than the 62% value expected from the Bench spectrograph system and the VPH grating (Bershady et al., 2008). However, since the efficiency of this grating is only known to , the two numbers are consistent.
Figure 2 compares the [O III] counts recorded in our PN spectra to the objects’ apparent magnitudes as determined by the counter-dispersed imaging of Merrett et al. (2006). There is a substantial amount of scatter in the diagram, due to the photometric and astrometric errors associated with the measurements from the Planetary Nebula Spectrograph, imperfections in our fiber positioning, and the effects of variable sky conditions. Nevertheless, the data demonstrate that our observations go quite deep: since we can detect emission lines containing as few as counts, our observations are sensitive to PNe that are mag down the luminosity function.
3 Finding PNe Within Star Clusters
Three criteria must be met before we can claim the detection of a PN candidate within an M31 star cluster. First, we must identify the presence of emission lines in the spectrum of the cluster. Second, the observed emission lines must have line-ratios consistent with those expected from a planetary nebula. Because of our limited spectral coverage (chosen to achieve the resolution needed to optimize emission line detections), this criterion is equivalent to requiring that the ratio of [O III] to H be greater than some threshold (see below). Third, the velocity of a PN candidate, as derived from its emission-lines, must be consistent with that of a star bound to its parent star cluster. Since the escape velocity from a typical M31 cluster is low, the precision of our emission-line and absorption line velocity measurements is an important parameter for our selection criteria.
3.1 Detection of Emission-lines
To search for PN emission within globular clusters, we began by normalizing each program spectrum with the continuum command within IRAF. We next divided the spectra into five classes based on the strengths and widths of the absorption features, thereby effectively grouping the clusters by age and metallicity. The highest signal-to-noise spectrum of each class was then chosen as a template, and shifted to zero velocity using, as a reference, the absorption lines of H, the Mgb triplet (5167,5173,5184), and other strong features. The remaining clusters of the class were then cross-correlated against their template to determine their relative radial velocities, and shifted to the rest frame. Finally, to improve the detectability of any faint emission feature which may be lost amidst the background light, the template spectra were scaled and subtracted from the other members of their class. Figure 3 shows the five template spectra.
Figure 4 illustrates this template-subtracting procedure using the globular cluster B094-G156. This example is representative of our reductions; some of the template subtractions are much better, while others are poorer (see Section 4). In particular, because there were only five template clusters, not all the observed systems flattened as well as the one that is displayed. In particular, several of the clusters classified as “young” by Caldwell et al. (2009) had imperfect subtractions around H. Nevertheless, in virtually all cases, the technique worked well around 5007 Å, as it effectively suppressed the continuum, allowing us to detect extremely weak emission from [O III]. Moreover, even when H was poorly subtracted, we could still measure the emission-line ratios extremely well, as the underlying stellar absorption was far broader than the unresolved Balmer emission.
3.2 The Emission-line Signature
Our next step was to look for evidence of planetary nebula emission. Because our data were taken using a multi-fiber spectrograph, rather than traditional slit spectroscopy, local sky subtraction was not possible. Consequently, the emission arising from the diffuse ionized gas of M31’s disk could not always be removed cleanly, and, even in the galactic bulge, line contamination was frequently a problem (see Ciardullo et al., 1988, for an image of M31’s bulge emission). In fact, as summarized in Table 3, roughly one-third of the globular clusters surveyed displayed some evidence of emission, due mostly to M31’s warm interstellar medium.
To guard against this form of false detection, we considered the expected line ratios of a planetary nebula. Most bright PNe are high excitation objects: in the top 2.5 mag of the [O III] PNLF, all planetary nebulae have [O III] to H ratios greater than 3 (i.e., ), and even at fainter magnitudes, [O III] is usually twice the strength of H (Ciardullo et al., 2002; Herrmann & Ciardullo, 2009). In the metal-poor environments of globular clusters, this lower limit is even more appropriate: of the 11 halo and globular cluster PNe observed by Howard et al. (1997) and Jacoby et al. (1997), all have an excitation parameter, . In contrast, the vast majority of M31’s H II regions and diffuse ionized emission have H brighter than [O III] (e.g., Blair et al., 1982; Galarza et al., 1999; Greenawalt et al., 1997). Moreover, in those rare cases where an H II region does exhibit a high value of , its ionizing source (either a single O star or a very young OB association) must be very hot. Such an object will therefore be very luminous — more than 100 or 1000 times the brightness of a PN central star — and detectable either via its blue continuum or its overly bright emission-line luminosity.
The only other sources that may have an excitation similar to that of a PN are supernova remnants (SNRs), supersoft x-ray sources, and symbiotic stars. Supernova remants are relatively rare (a factor of less numerous than PNe), and those remnants with are less common still (Magnier et al., 1995; Galarza et al., 1999). If a SNR were embedded within one of our target clusters, it would likely be much brighter and/or have much broader emission lines than any PN. Supersoft x-ray sources are even rarer than SNRs, and most either have sizes much larger than a star cluster (Remillard et al., 1995) or are associated with classical novae (Pietsch et al., 2005). In this latter case, the nova ejecta would have a velocity structure that is easily resolvable in our spectra. Finally, symbiotic stars can produce high-excitation emission lines, and in some cases, their observed properties can be very similar to those of true PN (Frankowski & Soker, 2009). In fact, Soker (2006) has argued that all the bright PNe seen in extragalactic surveys are actually symbiotic stars. But this is hard to prove, and PN surveys in the Milky Way and the LMC find that symbiotic systems are only a minor contaminant (Viironen et al., 2009; Miszalski et al., 2011). Thus, emission-line sources that have [O III] more than twice the strength of H are much more likely to be PNe than H II regions, SNRs, or some other line-emitting object.
Another way of testing for unrelated line emission is through the use of direct images. Deep H and [O III] Mosaic CCD frames of a 2.2 deg2 region along M31’s disk are available through the Local Group survey program of Massey et al. (2007). These images, which reach point-source flux limits of in H and in [O III], can be used to examine the immediate environment of each cluster. Although not useful for weak emission, the frames provided a check for objects where the evidence for an associated PN was ambiguous.
3.3 Associating a PN Candidate with a Star Cluster
Even when high-excitation emission was detected in our fibers, its source was not always associated with the underlying globular cluster. Some of the emission within M31’s disk does have relatively high excitation, and there is always the possibility of a chance superposition of a cluster with a true but unassociated PN. We can quantify the latter likelihood by computing the probability that a field planetary nebula would be projected within of an M31 cluster entirely by chance. As in other galaxies, the distribution of M31 PNe closely follows that of the galactic light (Merrett et al., 2006), and, from the surface photometry of Kent (1987) and the bolometric corrections of Buzzoni et al. (2006), we calculate that of M31’s diffuse luminosity (i.e., exclusive of the globular clusters) is projected within our survey fibers. This number, coupled with M31’s luminosity-specific PN density (Merrett et al., 2006), and the planetary nebula luminosity function (Ciardullo et al., 1989) implies the existence of superpositions in the top 2.5 mag of the PNLF, and unassociated PNe within the limits of our survey. Other high-excitation objects, such as old SNRs or supersoft X-ray sources will then increase this number. Clearly, we cannot ignore the possibility that two rather rare objects can be projected within a single optical fiber.
The best way to reject these chance superpositions is to compare the radial velocity of each cluster’s candidate PN to that of its stars. In general, for a planetary nebula to be bound to a cluster, the difference, , between its emission-line radial velocity and the absorption-line radial velocity of the cluster’s stars should satisfy the criterion , where is the quadrature sum of the system’s internal velocity dispersion and the uncertainty in the radial velocity measurements. The former quantity exists for of the globular clusters in our survey, mostly through the MMT echelle spectroscopy of Strader et al. (2011). For the remaining old stellar systems, we can estimate the line-of-sight velocity dispersions through the clusters’ fundamental plane relation (e.g., Djorgovski et al., 1997; Strader et al., 2009, 2011). While we generally do not have access to information about a cluster’s size or surface brightness, a projection of the Strader et al. (2011) clusters onto the plane yields
| (1) |
where is the cluster’s absolute magnitude in the Washington system (Kim et al., 2007), and is the observed velocity dispersion. Typically, these velocity dispersions span the range km s-1, with a median value near km s-1. Young clusters do not necessarily follow this relation, but from the structural analysis by Barmby et al. (2009), their line-of-sight velocity dispersion should be small, km s-1.
The second term which enters into is that arising from the uncertainty of our velocity measurements. This error has two components. The first, which is associated with our centroiding of the [O III] emission line, is generally small: our velocity measurements typically have errors that are less than km s-1. This is in agreement with the results of Herrmann & Ciardullo (2009), who used the same telescope and instrument setup to obtain km s-1 precision for faint PNe in distant galaxies.
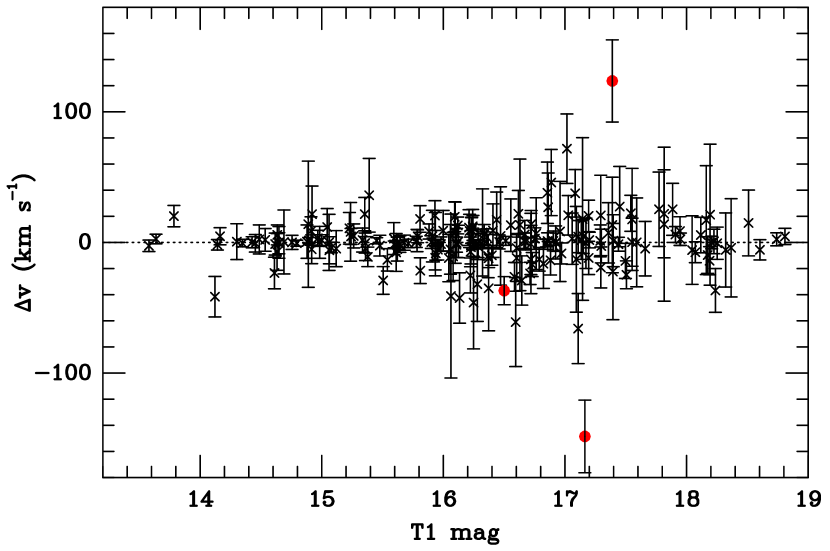
The other component of the error term, that coming from the absorption line measurements, is more complex. Almost half of our clusters have high-quality ( km s-1) velocity measurements, mostly through the MMT + Hectoechelle observations of Strader et al. (2011). As the left panel of Figure 5 shows, there is no systematic difference between our measurements and those of the Hectoechelle. Six clusters have highly discrepant velocities, as they differ from their Strader et al. (2011) values by more than 3 times the internal errors of the measurements. Yet when these objects are removed, the remaining 199 objects have a mean WIYN+Hydra velocity that is just km s-1 greater than that of the Hectoechelle. Since the two sets of observations are on the same system, we can adopt the higher precision Strader et al. (2011) velocities in our analysis.
For most of the remaining clusters, we can use our own velocity measurements, along with their associated measurement errors. As the right panel of Figure 5 illustrates, the dispersion between our independent velocity estimates of clusters observed in more than one Hydra setup is consistent with the expectations of internal measurement error. Moreover, it is possible to obtain a quantitative estimate of our uncertainties by comparing our velocity measurements (and their errors) to those of the Strader et al. (2011) Hectoechelle data using the statistic
| (2) |
where , , , and represent our velocities and their uncertainties, and those of Strader, respectively. When the six discrepant systems are removed, the reduced for the 199 degrees of freedom is 0.96. This strongly suggests that the internal errors of our velocity determinations are accurate, and can be adopted as the true uncertainties of our measurements.
Finally, as Figure 5 shows, the typical error of our absorption line velocities is between 15 and 20 km s-1. However, a small number of objects have velocity uncertainties that are significantly greater than this. In a few cases, more accurate velocities are available from the literature, and in those cases, we either adopted the previously measured values, or averaged our velocities with the published data. The remaining objects, where our velocity uncertainties were greater than 30 km s-1, were excluded from the analysis. Those clusters for which our velocities disagree with previously measured values by more than four times the internal errors are given in Table 2.
4 The Clusters Hosting Emission
After forming , we excluded all PN candidates with [O III] velocities that differed from that of their parent cluster by more than . We note that this criterion may not remove all the false detections, since young clusters are expected to have kinematics similar to that of the underlying disk. However, for the older systems, this should be a very effective discriminant. Since the rotation-corrected velocity dispersion of M31’s globular cluster system is km s-1 (Lee et al., 2008), the chance of finding a superposed disk source with the same velocity as one of our candidate clusters is extremely low.
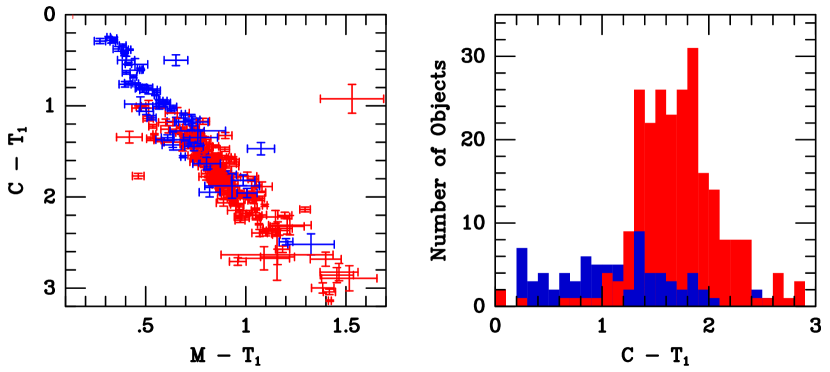
Table 3 lists all the cluster candidates surveyed in this program, along with their Washington system photometry obtained with the KPNO 0.9-m telescope (Kim et al., 2007), their radial velocities, the equivalent widths of their [O III] emission line, their [O III] to H emission-line ratio, and an age/type classification. For most of the clusters, this classification comes from the analyses of either Caldwell et al. (2009, 2011) or Peacock et al. (2010), and are based on a variety of measurements, including multi-bandpass photometry, HST color-magnitude diagrams, and, in many cases, high signal-to-noise spectra. To infer the ages of the 12 remaining objects without any age classification, we used the clusters with known ages as a training set for our photometry. As Figure 6 illustrates, most of the clusters designated as “young” are quite blue, with and . Conversely, the overwhelming majority of redder clusters are old. Thus for the clusters without a previous age determination, we can use color as a proxy for evolutionary status. We classify any object redder than as old; bluer clusters are identified as young. These color-based classifications are designated in Table 3 with a parenthesis.
Table 4 lists those M31 clusters which host possible planetary nebulae, along with the properties of the systems. The signal-to-noise ratios for the [O III] and H emission-line measurements are also tabulated. The first three objects give the candidates associated with stellar systems confirmed as being old; the next five list candidates in the younger clusters. Finally, two of our PN candidates are associated with controversial objects, i.e., cluster candidates which may, in fact, be foreground stars.
To estimate the [O III] magnitudes of the PNe, we used our knowledge of the 5000 Å continuum brightness of each cluster, as determined by its Washington system magnitude (central wavelength 5075 Å). By measuring the strength of [O III] relative to this continuum, i.e., the line’s equivalent width, we could approximate the PN candidate’s 5007 Å monochromatic flux. This flux was then converted to a magnitude via
| (3) |
and placed on an absolute scale by assuming a distance of 750 kpc (Freedman et al., 2001) and a differential extinction of (Schlegel et al., 1998). On this scale, the brightest PNe in M31 attain a luminosity corresponding to (Ciardullo et al., 1989; Merrett et al., 2006). This value is fairly resilient against alternative distant estimates to M31 (e.g., 780 kpc; McConnachie et al., 2005).
Of course, estimating brightnesses in this way carries a substantial amount of uncertainty. While the vast majority of M31 globular clusters have half-light radii smaller than the radius of our fibers, the tidal radii for these objects extend much farther (Barmby et al., 2007). As a result, the light coming through the fiber may not accurately reflect the total magnitude of the cluster, and astrometric errors in the cluster coordinates and fiber positioning only exacerbate the problem.
Moreover, the position of the emission-line source within the globular cluster is unknown. Even if the fiber is centered on the globular cluster, a point-source planetary nebula may be offset by more than an arcsec. For example, if the four PNe within the Milky Way clusters were placed at the distance of M31, their typical separation from their cluster’s center would be 0.3-0.4″, but JaFu 1 in Pal 6 would be offset by a full 1.8″. This means that for three out of the four objects, the photometric error due to their position of the PN within the cluster would be negligible (% loss through our 3″ fibers), but in 1″ seeing, JaFu 1’s luminosity would be underestimated by a factor of . In the absence of high resolution imaging, our spectroscopic [O III] luminosities are the best that can be achieved for these objects, and likely represent lower limits to the true [O III] brightnesses. Other properties which scale with luminosity, such as the inferred minimum central star mass, would be lower limits as well.
The spectra of our candidate PN-GC associations are shown in Figure 7 and Figure 8. Below we detail their properties.
4.1 Globular Clusters
Jacoby et al. (1997) argued that the single stars of old globular clusters cannot form PNe due to the time scale of their post-AGB evolution: by the time their cores becomes hot enough for ionization, their ejected gas would have dispersed far into the interstellar medium. Thus, Jacoby et al. (1997) concluded that PN formation inside globular clusters must involve binary stars, either through mass transfer, which increases the core mass to that of a higher mass progenitor, or through a binary interaction which accelerates the speed of post-AGB evolution (Moe & De Marco, 2012). More recently, Buell (2012) has suggested an alternative, wherein the single stars of globular clusters evolve high mass cores by being enriched in the helium produced by previous generations of star formation in the cluster. In any scenario, however, central star mass is a critical parameter of the PN system, but one that is very difficult to determine, even for Galactic PNe.
We can, however, place limits on the mass of a PN central star using models of post-AGB evolution. At best, the [O III] emission of a planetary nebula represents of the luminosity being emitted from its central star (Dopita et al., 1992; Schönberner et al., 2010). Moreover, for any central star luminosity, there is a minimum core required to generate that energy (Vassiliadis & Wood, 1994; Blöcker, 1995). If we find that this minimum mass is too high to be produced by the evolution of a single star of an old stellar population, then we will have strong evidence for a previous binary interaction. We apply this approach to our candidate objects.
B115-G177: According to Caldwell et al. (2011), this globular cluster is old and metal-rich, with [Fe/H] . Yet the system harbors an emission-line source that is bright enough to stand out in an Fe5015 versus Fe5270 plot, and hot enough to have an [O III] line that is three times the strength of H. To place a lower limit on the luminosity of the exciting source, we can use the fact that no more than of a central star’s total luminosity is reprocessed into [O III] (Dopita et al., 1992; Schönberner et al., 2010). Consequently, for a source to be as bright as , its exciting star must be at least and have a mass of at least M⊙. Although low-mass cores are capable of generating this amount of luminosity, their evolutionary time scale is too slow to produce a planetary nebula. This is our best candidate for a PN inside an M31 globular cluster and an object formed by binary evolution. It may be coincidental that a rare PN is found in a relatively rare metal-rich, yet old, globular cluster (Woodley et al., 2010), or perhaps the combination of properties is a clue to PN formation.
BH16: This cluster, classified as old by Strader et al. (2011), possesses the X-ray source J004246.0+411736 (Fan et al., 2005). Our velocity measurement for the system is relatively poor ( km s-1), due to possible contamination from the underlying galactic bulge, and inconsistent with the km s-1 Hectoechelle measurement obtained by Strader et al. (2011). If we adopt the latter value, then the velocity of the superposed [O III] emission line differs from that of the cluster by less than 20 km s-1 (), making an association likely. The emission-line source itself has a high-excitation (), but is also relatively faint, implying a central star luminosity that may be as low as .
NB89: The Lick indices (González, 1993) of this system imply an age of Gyr and a metallicity of [Z/H] (Barmby et al., 2000; Beasley et al., 2005), so the object is most likely a globular cluster. Its PN candidate is well-measured, but faint, with an estimated [O III] absolute magnitude that is mag down the luminosity function. The cluster also barely satisfies our selection criteria: [O III] is just 2.1 times the strength of H, and its inclusion in our list is partly due to the large ( km s-1) uncertainty in our estimate of cluster velocity. If, instead of using our own measurement, we adopt the velocity of km s-1 observed by Barmby et al. (2000), then the emission-line’s velocity of km s-1 is no longer consistent with it being part of the cluster. Caldwell (priv. comm.) reports that forbidden emission from [O II] and [S II] are strong, further suggesting that the emission-lines are interstellar in nature.
4.2 Candidate Globular Clusters
SK044A: Caldwell et al. (2009) classify this object as an M31 cluster (of indeterminate age) based on its spectrum and its profile on archival HST frames. In contrast, Peacock et al. (2010) call the object a star, citing their analysis of UKIRT and SDSS data. We also have difficulty classifying the object: although the cluster’s neutral color places it mag blueward of our “young” versus “old” dividing line, its measured radial velocity differs from that of M31’s underlying disk by km s-1 (Chemin et al., 2009). Further complicating the interpretation is our relatively poor determination for the cluster velocity ( km s-1): even when combined with the km s-1 measurement of Kim et al. (2007), the resultant km s-1 uncertainty still dominates the error budget. Nevertheless, the system is interesting, since its emission line velocity is inconsistent with a warm disk origin, and, with an [O III] to H ratio of , it has the highest emission-line excitation in our sample. The [O III] line is faint, so that if the emission is powered by a PN, its central star could be fainter than . Unfortunately, without better velocity information, we cannot say for certain whether the observed 48 km s-1 difference between the cluster’s emission lines and absorption features is indicative of an association or a chance superposition. Caldwell (priv. comm.) notes that [S II] is weak in his spectrum, providing further support for the idea that the emission line is produced in a PN rather than the warm interstellar medium.
SK051A: This is our faintest PN candidate, and another object for which we have a relatively large (22 km s-1) measurement error. Nevertheless, our derived cluster velocity is in excellent agreement with that found by Kim et al. (2007), and the source does possess high-excitation () [O III] emission at a velocity consistent with both estimates. The system has the colors of an old cluster, but without better data, we cannot confirm its association with the emission line. Peacock et al. (2010) classify the object as a foreground star based on its appearance on images from UKIRT and SDSS, and Caldwell (priv. comm.) notes that the object is not resolved on HST frames. Thus, it is possible that the observed continuum is from a point source contaminant, rather than a compact cluster.
4.3 Young Clusters
B458-D049: The cluster just barely satisfies our criterion, as the velocity of the [O III] emission-line differs from that of the cluster by 18 km s-1, or . It is a young system, as evidenced by the poor results of our template subtraction about the H absorption line, and Caldwell et al. (2009) estimate its age at 0.5 Gyr. If the [O III] emission does come from a planetary, then the physics of single-star stellar evolution implies that the PN is a high core-mass object. Specifically, the relationship between age and turnoff mass (Iben & Laughlin, 1989), coupled with the initial mass-final mass relation (Kalirai et al., 2008) yields . If the emission does come from a cluster PN, then the object either evolved from a single massive (young) star and is now well-past its peak [O III] brightness of , or it was created through a binary pathway and is likely the result of common envelope evolution. One can sometimes distinguish between these two possibilities in the Galaxy where morphology and abundance anomalies provide some discrimination (Miszalski et al., 2013). At the distance of M31, luminosity is the primary indicator; if an object is very bright, then it likely derives from a single massive star.
M040: Caldwell et al. (2011) re-classified this object as young, though they did not estimate an age. [O III] is well-measured, [O III] is weak, and is virtually undetectable. The velocity agreement between the set of emission lines and that of the underlying cluster continuum is not particularly good, between 13 and 28 km s-1, depending on whether we adopt our velocity or that of Caldwell et al. (2011). Given the km s-1 uncertainties of both measurements, an association remains a possibility.
C009-LGS04131: Our velocity for this faint system is poor ( km s-1) but it is in excellent agreement with the value of km s-1 measured by Caldwell et al. (2009) and with the velocity of its [O III] emission line ( km s-1). The cluster itself is young, with an age of Gyr (Caldwell et al., 2009) and a turnoff mass of (Iben & Laughlin, 1989). Although [O III] is rather faint, (, it is well-measured, and whatever is causing the emission has a very high excitation, . If the exciting source is a planetary, then, based on the turnoff mass, it is either a core mass object which has faded substantially since its peak luminosity, or an object that was formed through a binary interaction.
SK018A: We observed this young cluster twice, with consistent results ( km s-1). Caldwell et al. (2009) estimate the age of the cluster to be Gyr, which implies a turnoff mass of (Iben & Laughlin, 1989) and a PN core mass of (Kalirai et al., 2008). Like C009-LGS04131, the object is more than mag down the [O III] PNLF. There is no evidence of H, which implies .
DAO47: Our velocity, when combined with two other determinations in the literature (Perrett et al., 2002; Caldwell et al., 2009), yields a value that is within 9 km s-1 of that measured for the [O III] line. The spectrum is relatively noisy, and even after template-subtraction, residual stellar H absorption is still visible. Nevertheless, [O III] is reasonably well-detected, and the narrow H emission line is completely absent. Caldwell et al. (2009) estimate the age of the system to be Gyr, which, in terms of turnoff mass, is (Iben & Laughlin, 1989). The initial mass-final mass relation then implies .
5 Discussion
5.1 Expected and Observed Numbers of PN Candidates
In their survey of 130 Milky Way globular clusters, Jacoby et al. (1997) identified four planetary nebulae. Since our M31 survey targeted old clusters, a simple scaling of numbers suggests that we should have found PNe in our survey. However, only two of the Milky Way objects (Ps 1 in M15 and JaFu 1 in Pal 6) would have been definitively detected by our observations. At the distance of M31, JaFu 2, which is 7.3 mag down the PNLF, would be at, or just below, the threshold for detection, and GJJC-1 in M22 (which may not be a true PN) would be well past our detection limit. Consequently, we might expect to see objects; our list of systems with PN candidates contains 3 confirmed globular clusters, and two other sources which may be old systems.
It is unlikely that all of these candidates are true PNe, but the data are marginally consistent with the results of the Galactic surveys. Of the 5 candidates, 1 appears to be an excellent PN identification associated with an old cluster. If the other 4 candidates are ultimately rejected, then the number of PNe in M31 globular clusters found in this study is 4 times lower than expected. This can be explained, in part, as a consequence of the observational challenges of the project.
Similarly, our data are consistent with the results of the Peacock et al. (2012) survey of the Virgo giant elliptical NGC 4472. Their observations of 174 luminous globular clusters covered of bolometric light, and extended mag down the PN luminosity function. Our observations surveyed times less light, but extended mag further down the PN luminosity function. If we assume that the PNLF of globular clusters is similar to that of the field stars of old populations, i.e.,
| (4) |
then the NGC 4472 observations imply that we should have seen PN in our survey. This, again, is consistent with our data.
Conversely, the number of PN candidates found in young clusters is far more than anticipated. The total luminosity of all the young clusters included in our survey list is rather small, , and only was surveyed with good velocity precision. Because the young clusters are members of the disk population, their velocities are far more likely to match the velocities of potential interlopers (e.g., HII regions, SNRs, disk emission) that are also in the disk, than would the old clusters. We therefore must exercise additional caution when evaluating these candidate PNe.
If we assume a bolometric correction of (Buzzoni et al., 2006), this implies that our survey of young clusters sampled of light. From the theory of stellar energy generation, the bolometric luminosity stellar evolutionary flux for systems with ages between and Gyr is stars yr-1 (Renzini & Buzzoni, 1986). Thus, we might expect these populations to produce one PN every years. Even if these PNe remained visible for 50,000 yr, that is still not enough time to build up a detectable population. It is therefore likely that the larger velocity errors associated with these fainter clusters, and the kinematic similarity of the clusters and the field exacerbate our ability to discriminate PN candidates from superposed disk emission.
5.2 Are Binary Stars Important
Ciardullo et al. (2005) have argued that blue stragglers are responsible for most, if not all, of the bright PNe found in elliptical galaxies. Not only do these objects possess the main-sequence masses needed to build high-mass post-AGB cores, but their evolutionary timescale, relative to that of PN (), is roughly the same as the relative numbers of the two objects. Since the creation of blue stragglers in globular clusters may, in some way, be related to the rate of stellar encounters, (i.e., Davies et al., 2004; Leigh et al., 2011), then it is at least possible that the probability of finding a PN would also be proportional to this factor. From Verbunt & Hut (1987), this means that
| (5) |
where is the cluster’s central luminosity density, is the core radius, and is the stellar velocity dispersion. The structural parameters of Milky Way clusters (Harris, 1996, 2010) do seem to support this idea, as two of the systems which host PNe have extremely high encounter rates (NGC 6441 has the second highest rate of all Galactic GCs, and M15’s rate ranks as seventh), and three of the four rank in the top half of clusters. Moreover, this result is not simply due to the clusters having more stars: if one calculates the mass-specific encounter rates of the Milky Way clusters, then again, three of the four clusters hosting PNe appear in the top half of the list. The statistics of only four objects are poor, but the numbers do suggest a connection between stellar encounters and PN formation.
Unfortunately, our emission-line survey of M31’s globular cluster system does not yet allow us to increase the statistics significantly. Although over 250 of M31’s globular clusters have structural measurements (Barmby et al., 2007; Peacock et al., 2010), only one of the old clusters listed in Table 4 are included in that number. Interestingly, if we assume that the clusters are in virial equilibrium (so that we can approximate the encounter rate using ), then the cluster in question (B115-G177, which contains our best PN candidate) has a value of that ranks in the top of M31 systems. This again is suggestive, but it cannot be considered definitive until the other systems listed in Table 4 are surveyed.
Alternatively, we can attempt to explore the frequency of stellar encounters using X-ray emission as a proxy for encounter rate. Pooley et al. (2003) have shown that in Galactic globular clusters, there is an excellent correlation between and the number of low-mass X-ray binaries (LMXBs). If each LMXB had the same luminosity, we could test the PN binary-formation hypothesis by searching for a correlation between PN presence and X-ray brightness. Jacoby et al. (1997) did this experiment in the Milky Way, where each individual X-ray source can be identified. This led the authors to suggest that binaries were responsible for the cluster planetary nebulae.
In M31, one cannot resolve the individual X-ray sources within each cluster, and counting the total X-ray emission from a GC is not the same as measuring its total LMXB population. In fact, the large range of luminosities possible for LMXBs makes any connection between X-ray luminosity and binary population tenuous at best. In our survey, of the globular clusters have X-ray sources, but only one appears in Table 4 (Stiele et al., 2011). Consequently, X-ray emission in M31 clusters does not appear to present any evidence for the PN binary formation hypothesis.
5.3 The Luminosities of the Candidates
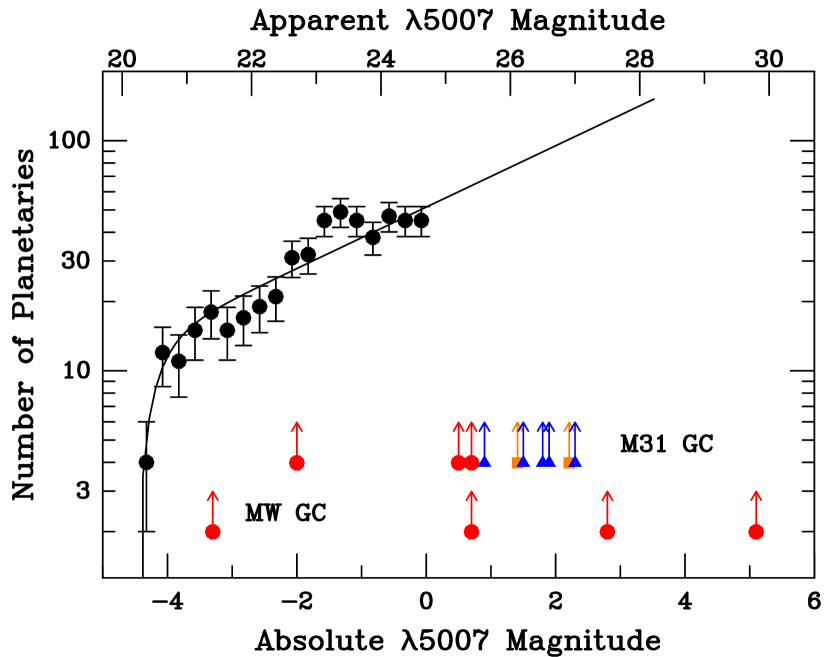
Figure 9 displays the [O III] magnitudes of planetary nebulae associated with Milky Way and M31 clusters. From the figure, it is clear that most of the clusters found in our spectroscopic survey are far fainter than those discovered via narrow-band or counter-dispersed imaging. This is simply a consequence of the technique; slit spectroscopy reduces the sky background enormously, allowing us to probe a region of M31’s PN luminosity function that is undetectable by other methods.
The more salient feature of the diagram is the distribution of relative PN luminosities. The systems of globular clusters in the Milky Way and M31 each contain a lone bright PN candidate; the remaining objects are extremely faint, in a regime where the luminosity function of LMC PNe is increasing exponentially (Reid & Parker, 2010). This is expected if most faint PNe have slowly evolving central stars embedded in freely expanding nebulae (Henize & Westerlund, 1963). In globular clusters, however, we might expect the PNLF to be distorted, as the absence of intermediate mass stars might result in a deficit of intermediate luminosity PNe. Thus far, however, there is no evidence for this effect: according to a Kolmogorov-Smirnov test, the combined luminosity function of PNe in Milky Way and M31 globular clusters is fully consistent with the curve displayed in Figure 9. Of course, the numbers involved are small, but to date, there is no reason to reject the hypothesis that the PNe of globular clusters obey the simple law proposed by Ciardullo et al. (1989).
5.4 The Observational Challenge
For Galactic clusters, searching for PNe is relatively straightforward. As demonstrated by Jacoby et al. (1997), one can use the classic on-band/off-band technique to detect [O III] over almost the entire planetary nebula luminosity function. Moreover, one can resolve both the cluster stars (except near the cluster center) and, importantly, the nebula. These two factors enable easy detection of emission-line objects having the morphological characteristics of a PN, even at very low surface brightnesses. Furthermore, relative to an extragalactic survey, cluster classifications are far more reliable, as are the velocity measurements for both the PN and the cluster.
In contrast, attempts to identify PNe in other galaxies are faced with a host of complications. Among these are:
Mimics: Objects other than PNe (e.g.,, H II regions, SNRs, and diffuse emission) can have similar spectral signatures over the limited wavelength range of the WIYN Bench Spectrograph and its 740 lines mm VPH grating. This problem is partially technical, as many modern spectrographs offer more complete spectral coverage at comparable resolution, allowing better discrimination against potential mimics. Yet even in the Milky Way, PN classifications can be controversial (e.g., Viironen et al., 2009; Frew & Parker, 2010) and PN candidates are constantly being re-evaluated. The limited information available on extragalactic objects only exacerbates this problem.
Spectral resolution and sensitivity: These instrumental parameters are probably the most critical factors for successfully and definitively finding PNe in extragalactic globular clusters. As described above, our ability to define the velocity (and the velocity dispersion) of the underlying star cluster severely limited our ability to exclude chance superpositions. We were fortunate that the literature provided an excellent source of velocities for many of our objects. For searches beyond M31, km s-1 velocity measurements will not always be available. Similarly, sensitivity becomes increasingly important at larger distances, both for determining cluster velocities and for probing the faint end of PNLF. The study in NGC 4472 (Peacock et al., 2012) only reached 2.5 mag down the PNLF; had we not gone far beyond this limit in M31, we likely would not have identified any PN candidates. Finally, resolution is also a helpful factor in this type of survey, both for the detection of PN emission, and for eliminating mimics such as SNRs and nova shells, which will have broad emission lines. Again, this is a technical issue where large telescopes can dramatically advance studies like this one.
Spectral aperture (slit width, fiber size): Our fiber diameter was limited to 3″, which is a reasonable match to the half-light radius of most M31 clusters. Still, these fibers do not sample all of the cluster light, and outlying PN could be overlooked, either because they fall entirely outside the fiber, or near the fiber limits, where flux is lost due to the effects of seeing. One could, of course, choose to use a large fiber or slit size for the observation (though at WIYN, the largest fiber size is 3″), but this would reduce the signal-to-noise of the measurement by admitting more sky and galactic background. This problem is ameliorated when going to more distant galaxies, though again at the cost of a higher galactic background and a loss of sensitivity due to the greater distance.
Multiple objects along the line of sight: When observing a distant galaxy, there is a finite probability that two unrelated objects will fall within the same spectroscopic aperture. This problem becomes worse as the distance increases, as a given fixed aperture represents a broader spatial swath of the galaxy. To compensate for this effect, one needs better velocity measurements so that unrelated objects can be discriminated.
In the future, searches for PNe in extragalactic globular clusters should be more productive as many of these challenges can be overcome with technological advancements. For example, the M31 problem becomes relatively easy with the high signal-to-noise spectra produced by an extremely large (25-40 m class) telescope (ELT) equipped with a multiobject, dual-channel, medium-resolution spectrograph. Similarly, adaptive optics on ELTs (or narrow-band filters on the Hubble Space Telescope could be used to resolve the cluster into stars, allowing the PN candidate to be imaged directly. This technique would not work as well for systems beyond a few Mpc, but could produce a complete census of cluster PN in the nearby universe.
6 Conclusions
We have demonstrated that it is possible to identify PN candidates in distant globular clusters using spectroscopy around the [O III] emission line. The principal difficulty in this approach lies in confirming that the candidates are, indeed, associated with the cluster. This requires precise radial velocity measurements, both for the emission line, and the underlying stellar continuum. The better the velocity resolution of the survey, the easier it is to separate embedded PNe from chance superpositions, and to distinguish a cluster-bound PN from other unrelated emission-line sources along the line of sight, such as H II regions, SNRs, and diffuse emission.
Of the 270 M31 globular cluster candidates observed with sufficient velocity precision, five show evidence for a candidate planetary nebula. Given the luminosity limits of the survey, the uncertainties in the velocity measurements, and the potential for confusion with other emission-line sources, this result is marginally consistent with the rate of PNe found in Milky Way clusters, i.e., 3 or 4 in 130 clusters, and the upper limit found in a survey of globular clusters around NGC 4472. This rate argues that less than one-quarter of the stars in old clusters form PNe (Jacoby et al., 1997). These numbers are also marginally consistent with the binary hypothesis for PN formation, which is about four times higher than the single star production rate in old clusters (Moe & De Marco, 2006).
At this time we cannot say how many cluster-associated PNe are likely to have been formed from binary interactions. Only one M31 PN candidate is embedded in a cluster whose structural parameters are known, but based on that cluster’s properties, and on the properties of the Milky Way’s PN clusters, it appears that the binary evolution scenario is a viable hypothesis to explain all globular cluster PNe. High resolution imaging would help confirm the existence of our PN candidates, and provide structural information on the host clusters.
In addition, we identified five PN candidates among the young clusters in our sample, a number that is much higher than that expected from the luminosity specific stellar death rate. These are likely superpositions; most of the young systems surveyed have large velocity uncertainties, and the similarity between their kinematics and that of the underlying disk make it difficult to identify superposed objects.
Finally, we emphasize that the M31 objects listed in Table 4 are PN candidates only. Hubble Space Telescope narrow-band images are needed to confirm their existence, especially for those objects within young clusters. However, once confirmed, these targets represent a new source of material for understanding the physics of PN formation, and the chemistry of their parent clusters.
Acknowledgments
We wish to thank Laura Fullton for early discussions about this project, and Nelson Caldwell for helpful insights and providing access to his M31 cluster web page http://www.cfa.harvard.edu/oir/eg/m31clusters/M31_Hectospec.html). MGL is supported in part by the Mid-career Researcher Program through an NRF grant funded by the MEST (No. 2010-0013875). EK was supported by the NOAO/KPNO Research Experiences for Undergraduates (REU) Program, which is funded by the National Science Foundation (NSF) Research Experience for Undergraduates Program and the Department of Defense ASSURE program through Scientific Program Order No. 13 (AST-0754223) of the Cooperative Agreement No. AST-0132798 between the Association of Universities for Research in Astronomy (AURA) and the NSF.
References
- Abell & Goldreich (1966) Abell, G.O., & Goldreich, P. 1966, PASP, 78, 232
- Barmby et al. (2000) Barmby, P., Huchra, J.P., Brodie, J.P., Forbes, D.A., Schroder, L.L., & Grillmair, C.J. 2000, AJ, 119, 727
- Barmby et al. (2007) Barmby, P., McLaughlin, D.E., Harris, W.E., Harris, G.L.H., & Forbes, D.A. 2007, AJ, 133, 2764
- Barmby et al. (2009) Barmby, P., Perina, S., Bellazzini, M., Cohen, J.G., Hodge, P.W., Huchra, J.P., Kissler-Patig, M., Puzia, T.H., & Strader, J. 2009, AJ, 138, 1667
- Beasley et al. (2005) Beasley, M.A., Brodie, J.P., Strader, J., Forbes, D.A., Proctor, R.N., Barmby, P., & Huchra, J.P. 2005, AJ, 129, 1412
- Bergond et al. (2006) Bergond, G., Zepf, S.E., Romanowsky, A.J., Sharples, R.M., & Rhode, K.L. 2006, A&A, 448, 155
- Bershady et al. (2008) Bershady, M., et al., 2008, SPIE, 7014, 15
- Bessell (2001) Bessell, M.S. 2001, PASP, 113, 66
- Bianchi et al. (2001) Bianchi, L., Bohlin, R., Catanzaro, G., Ford, H., & Manchado, A. 2001, AJ, 122, 1538
- Blair et al. (1982) Blair, W.P., Kirshner, R.P., & Chevalier, R.A. 1982, ApJ, 254, 50
- Blöcker (1995) Blöcker, T. 1995, A&A, 299, 755
- Buell (2012) Buell, J.F., 2012, MNRAS, 419, 2867
- Buzzoni et al. (2006) Buzzoni, A., Arnaboldi, M., & Corradi, R.L.M. 2006, MNRAS, 368, 877
- Caldwell et al. (2009) Caldwell, N., Harding, P., Morrison, H., Rose, J.A., Schiavon, R., & Kriessler, J. 2009, AJ, 137, 94
- Caldwell et al. (2011) Caldwell, N., Schiavon, R., Morrison, H., Rose, J.A., & Harding, P. 2011, AJ, 141, 61
- Caloi (1989) Caloi, V. 1989, A&A, 221, 27
- Chemin et al. (2009) Chemin, L., Carignan, C., & Foster, T. 2009, ApJ, 705, 1395
- Chomiuk et al. (2008) Chomiuk, L., Strader, J., & Brodie, J.P. 2008, AJ, 136, 234
- Ciardullo et al. (2002) Ciardullo, R., Feldmeier, J.J., Jacoby, G.H., Kuzio de Naray, R., Laychak, M.B., & Durrell, P.R. 2002, ApJ, 577, 31
- Ciardullo et al. (1988) Ciardullo, R., Rubin, V., Ford, W.K., Jacoby, G.H., & Ford, H.C., 1988, AJ, 95, 438
- Ciardullo et al. (1989) Ciardullo, R., Jacoby, G.H., & Ford, H.C. 1989, ApJ, 344, 715
- Ciardullo et al. (2005) Ciardullo, R., Sigurdsson, S., Feldmeier, J.J., & Jacoby, G.H. 2005, ApJ, 629, 499
- Davies et al. (2004) Davies, M.B., Piotto, G., & de Angeli, F. 2004, MNRAS, 349, 129
- De Marco (2009) De Marco, O. 2009, PASP, 121, 316
- De Marco (2011) De Marco, O. 2011, in Asymmetrical Planetary Nebulae V, ed. A. Ziljstra, I. McDonald & E. Lagadec, Jodrell Bank Centre for Astrophysics, 251
- De Marco et al. (2011) De Marco, O., Jacoby, G.H., Davies, J., Bond, H.E., & Harrington, P. 2011, BAAS, 43, 152
- De Marco et al. (2012) De Marco, O., Passy, J-C., Frew, D.J., Moe, M., & Jacoby, G.H., 2012, MNRAS, in press
- Djorgovski et al. (1997) Djorgovski, S.G., Gal, R.R., McCarthy, J.K., Cohen, J.G., de Carvalho, R.R., Meylan, G., Bendinelli, O., & Parmeggiani, G. 1997, ApJ, 474, L19
- Dopita et al. (1992) Dopita, M.A. Jacoby, G.H., & Vassiliadis, E. 1992, ApJ, 389, 27
- Fan et al. (2005) Fan, Z., Ma, J., Zhou, X., Chen, J., Jiang, Z., & Wu, Z. 2005, PASP, 117, 1236
- Frankowski & Soker (2009) Frankowski, A., & Soker, N. 2009, ApJ, 703, L95
- Freedman et al. (2001) Freedman, W.L., Madore, B.F., Gibson, B.K., Ferrarese, L., Kelson, D.D., Sakai, S., Mould, J.R., Kennicutt, R.C. Jr., Ford, H.C., Graham, J.A., Huchra, J.P., Hughes, S.M.G., Illingworth, G.D., Macri, L.M., & Stetson, P.B. 2001, ApJ, 553, 47
- Frew & Parker (2010) Frew, D.J., & Parker, Q.A. 2010, PASA, 27, 129
- Galarza et al. (1999) Galarza, V.C., Walterbos, R.A.M., & Braun, R. 1999, AJ, 118, 2775
- Galleti et al. (2004) Galleti, S., Federici, L., Bellazzini, M., Fusi Pecci, F., & Macrina, S. 2004, A&A, 416, 917
- Galleti et al. (2006) Galleti, S., Federici, L., Bellazzini, M., Buzzoni, A., & Fusi Pecci, F. 2006, A&A, 456, 985
- Galleti et al. (2007) Galleti, S., Bellazzini, M., Federici, L., Buzzoni, A., & Fusi Pecci, F. 2007, A&A, 471, 127
- Gillett et al. (1986) Gillett, F.C., Neugebauer, G., Emerson, J.P., & Rice, W.L. 1986, ApJ, 300, 722
- González (1993) González, J.J., 1993, PhD. thesis, Univ. California, Santa Cruz
- Greenawalt et al. (1997) Greenawalt, B., Walterbos, R.A.M., & Braun, R. 1997, ApJ, 483, 666
- Harrington & Platoglou (1993) Harrington, J.P, & Platoglou, G. 1993, ApJ, 411, L103
- Harris (1996) Harris, W.E. 1996, AJ, 112, 1487
- Harris (2010) Harris, W.E. 2010, arXiv:1012.3224
- Henize & Westerlund (1963) Henize, K.G., & Westerlund, B.E. 1963, ApJ, 137, 747
- Herrmann & Ciardullo (2009) Herrmann, K.A., & Ciardullo, R. 2009, ApJ, 703, 894
- Howard et al. (1997) Howard, J.W., Henry, R.B.C., & McCartney S. 1997, MNRAS, 284, 465
- Iben & Laughlin (1989) Iben, I., Jr., & Laughlin, G. 1989, ApJ, 341, 312
- Jacoby et al. (2013) Jacoby, G.H., De Marco, O., Lotarevich, I., Lahm, L., Bond, H.E., & Harrington, P. 2013, in preparation
- Jacoby et al. (1997) Jacoby, G.H., Morse, J.A., Fullton, L.K., Kwitter, K.B., & Henry, R.B.C. 1997, AJ, 114, 2611
- Jacoby et al. (1984) Jacoby, G.H., Hunter, D.A., & Christian, C.A. 1984, ApJS, 56, 257
- Kalirai et al. (2008) Kalirai, J.S., Hansen, B.M.S., Kelson, D.D., Reitzel, D.B., Rich, R.M., & Richer, H.B. 2008, ApJ, 676, 594
- Kent (1987) Kent, S.M. 1987, AJ, 93, 816
- Kim et al. (2007) Kim, S.C., Lee, M.G., Geisler, D., Sarajedini, A., Park, H.S., Hwang, H.S., Harris, W.E., Seguel, J.C., & von Hippel, T. 2007, AJ, 134, 706
- Larsen (2008) Larsen, S.S. 2008, A&A, 477, L17
- Lee et al. (2008) Lee, M.G., Hwang, H.S., Kim, S.C., Park, H.S., Geisler, D., Sarajedini, A., & Harris, W.E. 2008, ApJ, 674, 886
- Leigh et al. (2011) Leigh, N., Sills, A., & Knigge, C. 2011, MNRAS, 416, 1410
- Majaess et al. (2007) Majaess, D.J., Turner, D.G., & Lane, D.J. 2007, PASP, 119, 1349
- Magnier et al. (1995) Magnier, E.A., Prins, S., van Paradijs, J., Lewin, W.H.G., Supper, R., Hasinger, G., Pietsch, W., & Truemper, J. 1995, A&A, 114, 215
- Massey et al. (2007) Massey, P., McNeill, R.T., Olsen, K.A.G., Hodge, P.W., Blaha, C., Jacoby, G.H., Smith, R.C., & Strong, S.B. 2007, AJ, 134, 2474
- McConnachie et al. (2005) McConnachie, A.W., Irwin, M.J., Ferguson, A.M.N., Ibata, R.A., Lewis, G.F., & Tanvir, N. 2005, MNRAS, 356, 979
- Merrett et al. (2006) Merrett, H.R., Merrifield, M.R., Douglas, N.G., Kuijken, K., Romanowsky, A.J., Napolitano, N.R., Arnaboldi, M., Capaccioli, M., Freeman, K.C., Gerhard, O., Coccato, L., Carter, D., Evans, N.W., Wilkinson, M.I., Halliday, C., & Bridges, T.J. 2006, MNRAS, 369, 120
- Minniti & Rejkuba (2002) Minniti, D., & Rejkuba, M. 2002, ApJ, 575, L59
- Miszalski et al. (2011) Miszalski, B., Napiwotzki, R., Cioni, M.-R.L., Groenewegen, M.A.T., Oliveira, J.M., & Udalski, A. 2011, A&A, 531, A157
- Miszalski et al. (2013) Miszalski, B., Boffin, H.M.J., & Corradi, R.L.M., 2013, MNRAS, 428, L39
- Moe & De Marco (2006) Moe, M., & De Marco, O. 2006, ApJ, 650, 916
- Moe & De Marco (2012) Moe, M., & De Marco, O. 2012, in I.A.U. Symp. 283, Planetary Nebulae: An Eye to the Future, ed. A. Manchado, L. Stanghellini, & D. Schönberner (Cambridge), 340
- Parker et al. (2011) Parker, Q.A., Frew, D.J., Miszalski, B., Kovacevic, A.V., Frinchaboy, P.M., Dobbie, P.D., & Köppen, J., 2011, MNRAS, 413, 1835
- Peacock et al. (2010) Peacock, M.B., Maccarone, T.J., Knigge, C., Kundu, A., Waters, C.Z., Zepf, S.E., & Zurek, D.R. 2010, MNRAS, 402, 803
- Peacock et al. (2012) Peacock, M.B., Zepf, S.E., & Maccarone, T.J. 2012, ApJ, 752, 90
- Pease (1928) Pease, F.G. 1928, PASP, 40, 342
- Perrett et al. (2002) Perrett, K.M., Bridges, T.J., Hanes, D.A., Irwin, M.J., Brodie, J.P., Carter, D., Huchra, J.P., & Watson, F.G. 2002, AJ, 123, 2490
- Pietsch et al. (2005) Pietsch, W., Fliri, J., Freyberg, M.J., Greiner, J., Haberl, F., Riffeser, A., & Sala, G. 2005, A&A, 442, 879
- Pooley et al. (2003) Pooley, D., Lewin, W.H.,G., Anderson, S.F., Baumgardt, H., Filippenko, A.V., Gaensler, B.M., Homer, L., Hut, P., Kaspi, V.M., Makino, J., Margon, B., McMillan, S., Portegies Zwart, S., van der Klis, M., & Verbunt, F. 2003, ApJ, 591, L131
- Reid & Parker (2010) Reid, W.A., & Parker, Q.A. 2010, MNRAS, 405, 1349
- Renzini & Buzzoni (1986) Renzini, A., & Buzzoni, A. 1986, in Spectral Evolution of Galaxies, ed. C. Chiosi & A. Renzini (Dordrecht: Reidel), 195
- Remillard et al. (1995) Remillard, R.A., Rappaport, S., & Macri, L.M. 1995, ApJ, 439, 646
- Schlegel et al. (1998) Schlegel, D.J., Finkbeiner, D.P., & Davis, M. 1998, ApJ, 500, 525
- Schönberner et al. (2010) Schönberner, D., Jacob, R., Sandin, C., & Steffen, M. 2010, A&A, 523, A86
- Shklovski (1956) Shklovskii, I.S. 1956, Astr. Zh., 33, 315
- Soker (1997) Soker, N. 1997, ApJS, 112, 487
- Soker (2006) Soker, N. 2006, ApJ, 640, 966
- Strader et al. (2009) Strader, J., Smith, G.H., Larsen, S., Brodie, J.P., & Huchra, J.P. 2009, AJ, 138, 547
- Strader et al. (2011) Strader, J., Caldwell, N., & Seth, A.C. 2011, AJ, 142, 8
- Stiele et al. (2011) Stiele, H., Pietsch, W., Haberl, F., Hatzidimitriou, D., Barnard, R., Williams, B.F., Kong, A.K.H., & Kolb, U. 2011, A&A, 534, 55
- Vassiliadis & Wood (1994) Vassiliadis, E., & Wood, P.R. 1994, ApJS, 92, 125
- Verbunt & Hut (1987) Verbunt, F., & Hut, P. 1987, in I.A.U. Symp. 125, The Origin and Evolution of Neutron Stars, ed. D.J. Helfand & J.-H. Huang (Dordrecht: Reidel), 187
- Viironen et al. (2009) Viironen, K., Greimel, R., Corradi, R.L.M., Mampaso, A., Rodríguez, M., Sabin, L., Delgado-Inglada, G., Drew, J.E., Giammanco, C., González-Solares, E.A., Irwin, M.J., Miszalski, B., Parker, Q.A., Rodríguez-Flores, E.R., & Zijlstra, A. 2009, A&A, 504, 291
- Woodley et al. (2010) Woodley, K.A., Harris, W.E., Puzia, T.H., Matías, G., Harris, G.L., & Geisler, D., 2010, ApJ, 708, 1335


| Exposure Times | Number of Targets | |||
|---|---|---|---|---|
| Setup | UT Date | (minutes) | GCs | Young Clusters |
| M31-Y1 | 2008 Oct 25 | 71 | 2 | |
| M31-Y2 | 2008 Oct 25 | 68 | 1 | |
| M31-Y3 | 2008 Oct 26 | 57 | 8 | |
| M31-Y4 | 2008 Oct 26 | 43 | 18 | |
| M31-B1 | 2008 Oct 27 | 31 | 25 | |
| M31-G1 | 2008 Oct 27 | 37 | 23 | |
| M31-B2 | 2008 Oct 28 | 21 | 26 | |
| M31-R2 | 2008 Oct 28 | 16 | 6 | |
| Cluster | Our (km s-1) | Published (km s-1) | SourceaaREFERENCES: (1) Galleti et al. (2006); (2) Strader et al. (2011); (3) Perrett et al. (2002); (4) Kim et al. (2007) | Difference () | |
|---|---|---|---|---|---|
| B034D | 17.69 | 1 | 8.1 | ||
| B079D | 17.89 | 1 | 7.9 | ||
| B104-NB5 | 16.29 | 2 | 12.0 | ||
| B159 | 18.67 | 2 | 10.8 | ||
| B451-D037 | 17.75 | 3 | 22.3 | ||
| BH16 | 17.16 | 2 | 5.3 | ||
| NB21-AU5 | 17.22 | 2 | 9.4 | ||
| SK006A | 18.81 | 4 | 4.5 | ||
| SK021A | 18.25 | 4 | 5.8 | ||
| SK026A | 18.90 | 4 | 7.9 | ||
| SK045A | 15.50 | 4 | 11.2 | ||
| SK064A | 19.30 | 4 | 4.9 | ||
| SK079A | 18.02 | 4 | 5.3 | ||
| SK094A | 18.16 | 4 | 4.2 | ||
| SK096A | 17.94 | 4 | 4.9 | ||
| SK104A | 17.37 | 4 | 6.6 | ||
| SK106A | 18.94 | 4 | 14.9 |
| Velocity | |||||||||||||
|---|---|---|---|---|---|---|---|---|---|---|---|---|---|
| Name | aaNumbers in parenthesis have been transformed into the Washington system using literature measurements and the relations of Bessell (2001). | aaNumbers in parenthesis have been transformed into the Washington system using literature measurements and the relations of Bessell (2001). | aaNumbers in parenthesis have been transformed into the Washington system using literature measurements and the relations of Bessell (2001). | (km s-1) | (km s-1) | TypebbThe cluster age/type classification has been adopted from the following references: (1) Strader et al. (2011); (2) Caldwell et al. (2011); (3) Caldwell et al. (2009); (4) Peacock et al. (2010) | RefbbThe cluster age/type classification has been adopted from the following references: (1) Strader et al. (2011); (2) Caldwell et al. (2011); (3) Caldwell et al. (2009); (4) Peacock et al. (2010) | ccDerived ratio of [O III] to H using the procedures described in § 2 | EW (Å) | Notes | |||
| AU010 | 16.555 | 0.017 | 18.325 | 0.031 | 17.388 | 0.019 | 20.1 | Old | 1 | 2.8 | 0.8 | ||
| B001-G039 | 16.395 | 0.005 | 18.580 | 0.013 | 17.377 | 0.007 | 10.9 | Old | 3 | … | … | ||
| B003-G045 | 17.151 | 0.012 | 18.564 | 0.014 | 17.885 | 0.010 | 13.0 | Old | 1 | … | … | ||
| B004-G050 | 16.452 | 0.007 | 18.172 | 0.010 | 17.255 | 0.006 | 5.9 | Old | 3 | … | … | ||
| B005-G052 | 15.045 | 0.002 | 16.901 | 0.004 | 15.905 | 0.002 | 14.1 | Old | 1 | … | … | ||
| B006-G058 | 14.967 | 0.002 | 16.780 | 0.003 | 15.831 | 0.002 | 6.1 | Old | 1 | … | … | ||
| B006D-D036 | 17.634 | 0.016 | 18.386 | 0.013 | 18.013 | 0.013 | 28.1 | Young | 3 | … | … | Mean; km s-1 | |
| B008-G060 | 16.270 | 0.006 | 18.077 | 0.009 | 17.103 | 0.005 | 3.6 | Old | 1 | … | … | Mean; km s-1 | |
| B009-G061 | 16.379 | 0.006 | 17.720 | 0.006 | 17.128 | 0.005 | 11.2 | Old | 3 | … | … | ||
| B009D | 18.624 | 0.045 | 19.574 | 0.034 | 19.079 | 0.030 | 38.5 | (Young) | … | … | … | ||
| B010-G062 | 16.227 | 0.005 | 17.722 | 0.007 | 16.995 | 0.005 | 12.7 | Old | 1 | … | … | ||
| B011-G063 | 16.115 | 0.005 | 17.538 | 0.006 | 16.889 | 0.004 | 11.3 | Old | 3 | … | … | ||
| B012-G064 | 14.689 | 0.002 | 16.097 | 0.002 | 15.415 | 0.002 | 24.5 | Old | 1 | … | … | ||
| B012D-D039 | 18.349 | 0.031 | 19.521 | 0.033 | 18.966 | 0.030 | 22.1 | Young | 3 | … | … | ||
| B013-G065 | 16.603 | 0.007 | 18.410 | 0.011 | 17.473 | 0.007 | 11.1 | Old | 1 | … | … | ||
| B014D | 18.193 | 0.030 | 19.348 | 0.027 | 18.887 | 0.025 | 53.9 | Young | 1 | … | … | ||
| B015-V204 | 17.011 | 0.009 | 19.409 | 0.027 | 18.074 | 0.013 | 15.8 | Old | 3 | … | … | ||
| B015D-D041 | 18.046 | 0.027 | 19.216 | 0.024 | 18.709 | 0.021 | 26.2 | Young | 1 | … | … | ||
| B016-G066 | 16.975 | 0.010 | 18.856 | 0.017 | 17.865 | 0.010 | 6.3 | Old | 3 | … | … | ||
| B017-G070 | 15.336 | 0.003 | 17.463 | 0.005 | 16.351 | 0.003 | 9.2 | Old | 1 | 0.0 | 0.0 | ||
| B017D | 17.579 | 0.015 | 18.948 | 0.020 | 18.241 | 0.016 | 13.2 | Young | 2 | … | … | ||
| B018-G071 | 17.027 | 0.009 | 18.539 | 0.014 | 17.761 | 0.010 | 15.1 | Young | 1 | … | … | ||
| B019-G072 | 14.454 | 0.002 | 16.270 | 0.002 | 15.309 | 0.001 | 6.7 | Old | 1 | … | … | ||
| B019D | 18.510 | 0.040 | 21.030 | 0.109 | 19.799 | 0.054 | 25.1 | Young | 1 | … | … | ||
| B020-G073 | 14.347 | 0.001 | 15.960 | 0.002 | 15.157 | 0.001 | 2.8 | Old | 1 | … | … | ||
| B020D-G089 | 16.862 | 0.022 | 18.644 | 0.041 | 17.753 | 0.026 | 26.2 | Old | 1 | 0.0 | 0.0 | ||
| B021-G075 | 16.971 | 0.010 | 19.008 | 0.019 | 17.967 | 0.011 | 8.0 | Old | 1 | … | … | ||
| B022-G074 | 16.891 | 0.009 | 18.181 | 0.009 | 17.630 | 0.008 | 18.7 | Old | 3 | … | … | ||
| B022D | 17.928 | 0.059 | 18.913 | 0.055 | 18.263 | 0.042 | 18.5 | Star? | 3 | … | … | ||
| B023-G078 | 13.579 | 0.001 | 15.799 | 0.002 | 14.613 | 0.001 | 4.3 | Old | 1 | … | … | Mean; km s-1 | |
| B024-G082 | 16.308 | 0.004 | 18.045 | 0.009 | 17.098 | 0.005 | 16.0 | Old | 3 | … | … | ||
| B025-G084 | 16.223 | 0.006 | 17.898 | 0.009 | 17.049 | 0.007 | 11.4 | Old | 1 | … | … | ||
| B025D-V217 | 17.112 | 0.027 | 19.406 | 0.077 | 18.195 | 0.037 | 54.9 | Galaxy | 3 | … | … | Probable M31 clusteriiClassified as a galaxy in the literature, but our spectrum is consistent with the object being a star cluster. | |
| B026-G086 | 16.857 | 0.009 | 18.823 | 0.015 | 17.768 | 0.009 | 6.3 | Old | 1 | … | … | ||
| B026D-V216 | 17.265 | 0.016 | 19.970 | 0.050 | 18.322 | 0.020 | 45.0 | Galaxy | 3 | … | … | Probable M31 clusteriiClassified as a galaxy in the literature, but our spectrum is consistent with the object being a star cluster. | |
| B027-G087 | 15.119 | 0.002 | 16.650 | 0.003 | 15.886 | 0.003 | 13.8 | Old | 1 | … | … | ||
| B028-G088 | 16.369 | 0.007 | 17.773 | 0.008 | 17.089 | 0.007 | 16.5 | Old | 1 | … | … | ||
| B029-G090 | 16.109 | 0.006 | 17.677 | 0.007 | 17.009 | 0.007 | 11.1 | Old | 1 | … | … | ||
| B030-G091 | 16.763 | 0.010 | 20.151 | 0.055 | 18.134 | 0.017 | 27.4 | Old | 1 | … | … | ||
| B031-G092 | 17.173 | 0.015 | 19.568 | 0.036 | 18.205 | 0.018 | 19.2 | Old | 1 | … | … | ||
| B032-G093 | 16.944 | 0.024 | 19.289 | 0.069 | 18.067 | 0.033 | 8.1 | Old | 3 | … | … | ||
| B032D | (18.366) | … | (19.724) | … | (18.943) | … | 37.5 | Young | 1 | … | … | ||
| B033-G095 | 17.397 | 0.018 | 19.109 | 0.025 | 18.258 | 0.020 | 19.9 | Old | 1 | … | … | ||
| B034-G096 | 14.891 | 0.002 | 16.705 | 0.003 | 15.727 | 0.002 | 8.1 | Old | 3 | … | … | ||
| B034D | 17.694 | 0.023 | 21.213 | 0.144 | 19.024 | 0.037 | 29.1 | Star | 3 | … | … | ||
| B035 | 18.809 | 0.016 | 20.135 | 0.029 | 19.670 | 0.022 | 6.2 | Old | 1 | … | … | ||
| B035D | 17.790 | 0.052 | 19.189 | 0.068 | 18.432 | 0.048 | 31.4 | Young | 2 | … | … | ||
| B036 | 18.741 | 0.015 | 20.487 | 0.038 | 19.524 | 0.020 | 4.9 | Old | 1 | … | … | ||
| B037-V327 | 15.643 | 0.007 | 19.715 | 0.087 | 17.577 | 0.020 | 6.1 | Old | 1 | … | … | Mean; km s-1 | |
| B038-G098 | 15.934 | 0.010 | 17.635 | 0.017 | 16.772 | 0.011 | 24.2 | Old | 1 | … | … | ||
| B039-G101 | 15.357 | 0.006 | 17.769 | 0.018 | 16.473 | 0.008 | 7.6 | Old | 1 | … | … | ||
| B040-G102 | 16.959 | 0.013 | 17.560 | 0.007 | 17.397 | 0.009 | 38.3 | Young | 1 | … | … | ||
| B041-G103 | 17.946 | 0.060 | 18.970 | 0.058 | 18.424 | 0.048 | 10.9 | Old | 1 | … | … | Mean; km s-1 | |
| B041D | 17.394 | 0.036 | 19.704 | 0.100 | 18.578 | 0.053 | 36.8 | Old | 1 | … | … | ||
| B042-G104 | 15.360 | 0.006 | 18.401 | 0.030 | 16.741 | 0.010 | 9.1 | Old | 1 | … | … | ||
| B042D | 17.978 | 0.061 | 19.726 | 0.107 | 18.762 | 0.782 | 25.4 | Galaxy | 3 | … | … | Probable M31 clusteriiClassified as a galaxy in the literature, but our spectrum is consistent with the object being a star cluster. | |
| B043-G106 | 16.630 | 0.009 | 17.070 | 0.005 | 16.988 | 0.007 | 50.3 | Young | 1 | … | … | ||
| B043D-V246 | 16.325 | 0.013 | 19.148 | 0.058 | 17.569 | 0.021 | 40.8 | Galaxy | 3 | … | … | Probable M31 clusteriiClassified as a galaxy in the literature, but our spectrum is consistent with the object being a star cluster. | |
| B044-G107 | 16.108 | 0.011 | 18.288 | 0.029 | 17.075 | 0.014 | 5.8 | Old | 1 | … | … | ||
| B044D-V228 | 17.885 | 0.027 | 23.123 | 0.716 | 19.502 | 0.055 | … | … | Galaxy | 3 | 0.2 | 0.2 | GalaxyddClassified on the basis of an emission line a 5046 Å. |
| B045-G108 | 17.201 | 0.004 | 18.762 | 0.009 | 18.029 | 0.006 | 6.0 | Old | 1 | … | … | ||
| B045D | 18.189 | 0.073 | 20.823 | 0.270 | 19.309 | 0.102 | 10.7 | Old | 1 | … | … | ||
| B046-G109 | 17.655 | 0.017 | 18.912 | 0.035 | 18.234 | 0.021 | 16.1 | Old | 3 | … | … | ||
| B046D | (19.620) | … | (18.588) | … | (19.315) | … | 20.9 | Star | 3 | … | … | ||
| B047-G111 | 18.904 | 0.017 | 20.075 | 0.028 | 19.654 | 0.022 | 12.3 | Old | 3 | … | … | ||
| B048-G110 | 15.933 | 0.010 | 17.789 | 0.019 | 16.817 | 0.011 | 9.3 | Old | 1 | … | … | ||
| B049-G112 | 17.145 | 0.015 | 18.195 | 0.012 | 17.735 | 0.013 | 62.3 | Young | 1 | 1.5 | 0.5 | ||
| B050-G113 | 18.225 | 0.010 | 19.791 | 0.021 | 18.992 | 0.013 | 9.4 | Old | 1 | … | … | ||
| B051-G114 | 17.440 | 0.005 | 19.391 | 0.015 | 18.424 | 0.008 | 5.3 | Old | 1 | … | … | ||
| B053 | 17.685 | 0.047 | 19.253 | 0.071 | 18.315 | 0.043 | 9.8 | Star | 3 | … | … | ||
| B054-G115 | 17.399 | 0.018 | 19.328 | 0.030 | 18.259 | 0.020 | 20.1 | Old | 3 | … | … | ||
| B054D-NB33 | 17.226 | 0.031 | 18.872 | 0.050 | 17.853 | 0.028 | 45.7 | Star | 3 | 0.8 | 0.4 | ||
| B055-G116 | 15.938 | 0.010 | 18.511 | 0.034 | 17.085 | 0.014 | 5.2 | Old | 1 | 0.0 | 0.0 | Mean; km s-1 | |
| B056-G117 | 16.603 | 0.009 | 18.684 | 0.017 | 17.509 | 0.010 | 17.9 | Old | 1 | … | … | ||
| B057-G118 | 17.094 | 0.014 | 18.448 | 0.015 | 17.813 | 0.013 | 40.5 | Old | 1 | 1.4: | 0.6 | 3 components of H | |
| B058-G119 | 14.486 | 0.002 | 16.005 | 0.002 | 15.232 | 0.002 | 11.1 | Old | 1 | … | … | ||
| B059-G120 | 16.585 | 0.017 | 18.615 | 0.039 | 17.588 | 0.022 | 11.0 | Old | 1 | … | … | ||
| B060-G121 | 16.216 | 0.013 | 17.533 | 0.016 | 16.925 | 0.013 | 12.7 | Old | 1 | 1.0 | 0.2 | ||
| B061-G122 | 17.883 | 0.007 | 19.898 | 0.023 | 18.917 | 0.012 | 9.1 | Old | 3 | … | … | ||
| B063-G124 | 16.928 | 0.004 | 19.019 | 0.011 | 17.986 | 0.006 | 7.0 | Old | 1 | … | … | ||
| B063D | 18.468 | 0.049 | 19.062 | 0.027 | 18.879 | 0.036 | … | … | Star | 4 | … | … | Probable AGNeeClassified on the basis of a 50 Å FWHM logarithmic-profile emission line at 4836 Å. |
| B064-G125 | 15.810 | 0.009 | 17.234 | 0.013 | 16.536 | 0.009 | 9.9 | Old | 1 | 1.0 | 0.2 | ||
| B064D-NB6 | 15.949 | 0.010 | 17.533 | 0.016 | 16.674 | 0.010 | … | Old | 1 | … | … | ||
| B065-G126 | 16.408 | … | 17.054 | … | (17.165) | … | 20.5 | Old | 1 | … | … | ||
| B066-G128 | 17.175 | 0.015 | 17.514 | 0.007 | 17.524 | 0.011 | 86.4 | Young | 3 | … | … | ||
| B067-G129 | 16.720 | 0.020 | 17.979 | 0.024 | 17.420 | 0.019 | 26.2 | Old | 1 | 0.7: | 0.1 | ||
| B068-G130 | 15.621 | 0.004 | 17.991 | 0.009 | 16.677 | 0.005 | 9.1 | Old | 1 | … | … | ||
| B069-G132 | 19.997 | 0.046 | 20.543 | 0.044 | 20.408 | 0.043 | 31.6 | Young | 1 | 1.0 | 0.4 | ||
| B070-G133 | 16.372 | 0.014 | 17.725 | 0.019 | 17.082 | 0.014 | 32.6 | Old | 1 | … | … | ||
| B071 | 17.294 | 0.032 | 19.967 | 0.123 | 18.349 | 0.043 | 30.8 | Old | 1 | 1.4 | 0.4 | ||
| B071D | 18.399 | 0.090 | 19.853 | 0.124 | 19.282 | 0.102 | 36.7 | Star | 3 | 2.0 | 0.9 | ||
| B072 | 18.603 | 0.013 | 21.460 | 0.082 | 20.021 | 0.029 | 7.7 | Old | 1 | … | … | ||
| B073-G134 | 15.452 | 0.003 | 17.244 | 0.005 | 16.273 | 0.004 | 2.3 | Old | 1 | … | … | ||
| B074-G135 | 18.117 | 0.009 | 19.366 | 0.015 | 18.821 | 0.011 | 13.6 | Old | 1 | … | … | ||
| B075-G136 | 16.713 | 0.019 | 18.328 | 0.031 | 17.435 | 0.019 | 8.5 | Old | 1 | … | … | Mean; km s-1 | |
| B076-G138 | 16.243 | 0.013 | 17.785 | 0.020 | 17.065 | 0.014 | 9.5 | Old | 1 | 0.0 | 0.0 | ||
| B077-G139 | 16.856 | 0.022 | 19.513 | 0.082 | 17.978 | 0.030 | 23.5 | Old | 1 | … | … | ||
| B078-G140 | 17.195 | 0.029 | 20.087 | 0.135 | 18.675 | 0.056 | 12.4 | Old | 1 | … | … | ||
| B079D | 17.889 | 0.028 | 20.245 | 0.066 | 18.879 | 0.034 | 29.4 | Star | 3 | … | … | ||
| B080-G141 | 16.730 | 0.019 | 19.413 | 0.075 | 18.093 | 0.034 | 9.2 | Old | 1 | … | … | ||
| B081-G142 | 16.470 | 0.008 | 17.417 | 0.006 | 17.031 | 0.007 | 37.7 | Young | 1 | 0.7 | 0.2 | Mean; km s-1 | |
| B082-G144 | 14.617 | 0.002 | 17.755 | 0.007 | 16.000 | 0.003 | 8.4 | Old | 1 | … | … | ||
| B083-G146 | 16.923 | 0.009 | 18.148 | 0.018 | 17.422 | 0.010 | 12.6 | Old | 1 | … | … | ||
| B085-G147 | 16.336 | 0.007 | 17.713 | 0.008 | 17.051 | 0.007 | 7.5 | Old | 1 | … | … | ||
| B086-G148 | 14.611 | 0.003 | 15.958 | 0.005 | 15.327 | 0.003 | 12.1 | Old | 1 | 1.0 | 0.1 | Mean; km s-1 | |
| B087 | 19.996 | 0.045 | 21.394 | 0.087 | 20.645 | 0.052 | 10.5 | Old | 3 | … | … | ||
| B087D | 17.084 | 0.027 | 18.622 | 0.041 | 17.834 | 0.028 | 18.2 | Old | 1 | 1.5 | 0.7 | ||
| B088-G150 | 16.720 | 0.003 | 18.597 | 0.008 | 17.745 | 0.005 | 23.4 | Old | 1 | … | … | ||
| B090 | 17.815 | 0.053 | 19.478 | 0.086 | 18.643 | 0.057 | 33.7 | Old | 1 | 4.0 | 0.6 | ||
| B090D | 16.605 | 0.018 | 18.383 | 0.032 | 17.372 | 0.018 | … | Old | 3 | 3.0 | 0.5 | ||
| B091-G151 | 17.305 | 0.034 | 18.113 | 0.028 | 17.760 | 0.027 | 34.5 | Young | 3 | 0.0 | 0.0 | ||
| B091D-D058 | 16.663 | 0.003 | 18.331 | 0.007 | 17.505 | 0.004 | 5.9 | Old | 1 | … | … | ||
| B092-G152 | 16.439 | 0.015 | 18.005 | 0.024 | 17.221 | 0.016 | 21.3 | Old | 1 | 0.2 | |||
| B093-G155 | 16.241 | 0.013 | 18.081 | 0.025 | 17.053 | 0.014 | 12.9 | Old | 1 | … | … | ||
| B094-G156 | 15.001 | … | 15.805 | … | (15.957) | … | 4.1 | Old | 1 | 0.5 | |||
| B095-G157 | (15.241) | … | (17.361) | … | (16.098) | … | 6.1 | Old | 1 | 0.8 | 0.1 | ||
| B096-G158 | 15.789 | 0.008 | 18.045 | 0.023 | 16.724 | 0.010 | 4.9 | Old | 1 | 0.7 | 0.6 | Mean; km s-1 | |
| B096D | 17.592 | 0.025 | 19.555 | 0.036 | 18.862 | 0.036 | 24.6 | Star | 3 | 0.0 | 0.0 | ||
| B097-G159 | 18.206 | 0.010 | 20.066 | 0.026 | 19.103 | 0.014 | 4.8 | Old | 1 | … | … | ||
| B097D | 17.869 | 0.027 | 19.626 | 0.033 | 18.743 | 0.027 | 25.4 | Young | 3 | 1.5 | 1.7 | ||
| B098 | 15.712 | 0.004 | 17.416 | 0.006 | 16.500 | 0.004 | 3.2 | Old | 1 | … | … | ||
| B099-G161 | 16.249 | 0.013 | 17.799 | 0.020 | 17.051 | 0.014 | 35.4 | Old | 1 | 1.0 | 0.4 | ||
| B100-G163 | 17.191 | 0.015 | 18.940 | 0.022 | 18.011 | 0.016 | 6.2 | Old | 3 | … | … | ||
| B101-G164 | 16.399 | 0.015 | 17.922 | 0.022 | 17.128 | 0.015 | 7.1 | Old | 1 | 3.0 | 0.3 | ||
| B102 | 18.196 | 0.010 | 19.052 | 0.012 | 18.754 | 0.011 | 12.5 | Star | 3 | … | … | ||
| B103-G165 | 14.634 | 0.003 | 16.627 | 0.008 | 15.578 | 0.004 | 7.6 | Old | 1 | … | … | ||
| B103D-G245 | 16.938 | 0.014 | 18.737 | 0.018 | 17.818 | 0.014 | 9.8 | Old | 3 | 2.0 | 0.1 | ||
| B104-NB5 | 16.288 | 0.013 | 17.846 | 0.021 | 17.063 | 0.014 | 26.8 | Old | 1 | 1.4 | 0.4 | ||
| B105-G166 | 18.622 | 0.014 | 20.184 | 0.030 | 19.429 | 0.018 | 9.8 | Old | 3 | 0.0 | 0.0 | ||
| B106-G168 | 15.505 | 0.007 | 17.334 | 0.013 | 16.345 | 0.008 | 10.6 | Old | 1 | 0.0 | 0.0 | Mean; km s-1 | |
| B107-G169 | 15.263 | 0.005 | 17.091 | 0.011 | 16.144 | 0.007 | 9.2 | Old | 1 | 2.0 | 0.4 | ||
| B109-G170 | 15.809 | 0.009 | 17.816 | 0.020 | 16.701 | 0.010 | 10.2 | Old | 1 | 0.0 | 0.0 | ||
| B110-G172 | 14.647 | 0.003 | 16.354 | 0.006 | 15.430 | 0.004 | 8.1 | Old | 1 | 0.1 | |||
| B111-G173 | 16.286 | 0.007 | 17.732 | 0.008 | 17.020 | 0.007 | 10.7 | Old | 1 | 0.1 | |||
| B111D-D065 | 17.590 | 0.026 | 17.880 | 0.010 | 17.825 | 0.015 | 34.0 | Young | 1 | 0.0 | 0.0 | ||
| B112-G174 | 15.612 | 0.007 | 17.702 | 0.018 | 16.547 | 0.009 | 14.5 | Old | 1 | … | … | ||
| B112D-M27 | 18.327 | 0.041 | 19.756 | 0.038 | 18.929 | 0.032 | 16.2 | Young | 2 | 0.5 | 0.8 | ||
| B114-G175 | 16.595 | 0.018 | 17.963 | 0.023 | 17.355 | 0.018 | 33.9 | Old | 1 | 0.7 | 0.3 | ||
| B115-G177 | 15.390 | 0.006 | 17.445 | 0.014 | 16.288 | 0.007 | 28.2 | Old | 1 | 3.0 | 2.5 | ||
| B116-G178 | 17.908 | 0.007 | 20.045 | 0.025 | 19.168 | 0.014 | 6.0 | Old | 1 | … | … | Mean; km s-1 | |
| B117-G176 | 15.910 | … | 16.677 | … | (16.669) | … | 19.7 | Old | 1 | 0.3 | |||
| B118D-M049 | (17.816) | … | (19.552) | … | (18.532) | … | 58.9 | Young | 1 | 1.5 | 1.6 | ||
| B119-NB14 | 16.887 | 0.023 | 18.662 | 0.041 | 17.859 | 0.028 | 25.3 | Old | 1 | 0.7 | 0.5 | ||
| B122-G181 | 18.787 | 0.015 | 21.612 | 0.094 | 20.217 | 0.034 | 10.5 | Old | 3 | … | … | ||
| B123-G182 | 16.677 | 0.019 | 18.366 | 0.032 | 17.477 | 0.020 | 6.5 | Old | 1 | 1.5 | 0.4 | ||
| B124-NB10 | 14.122 | 0.002 | 16.018 | 0.005 | 14.969 | 0.003 | 15.5 | Old | 1 | 0.6 | 0.1 | Mean; km s-1 | |
| B125-G183 | 15.998 | 0.010 | 17.361 | 0.014 | 16.701 | 0.010 | 15.5 | Old | 1 | 0.7 | 0.2 | ||
| B126-G184 | 16.514 | 0.016 | 17.965 | 0.023 | 17.286 | 0.017 | … | Old | 1 | 0.0 | 0.0 | ||
| B127-G185 | 13.784 | 0.002 | 15.611 | 0.004 | 14.635 | 0.002 | 8.1 | Old | 1 | 1.5 | 0.8 | ||
| B128-G187 | 16.357 | 0.014 | 18.190 | 0.027 | 17.196 | 0.016 | 6.3 | Old | 1 | 3.1 | 0.2 | Mean; km s-1 | |
| B129 | 18.072 | 0.008 | 22.425 | 0.171 | 19.963 | 0.026 | 7.9 | Old | 1 | 0.4 | |||
| B130-G188 | 18.174 | 0.009 | 19.977 | 0.024 | 19.175 | 0.015 | 14.0 | Old | 1 | … | … | ||
| B131-G189 | 14.920 | 0.004 | 16.638 | 0.008 | 15.721 | 0.005 | 21.5 | Old | 1 | … | … | ||
| B134-G190 | 15.931 | 0.010 | 17.498 | 0.016 | 16.642 | 0.010 | 11.4 | Old | 1 | 1.8 | 0.4 | ||
| B135-G192 | 17.358 | 0.005 | 18.924 | 0.011 | 18.237 | 0.007 | 23.1 | Old | 1 | 0.6 | |||
| B137-G195 | 18.988 | 0.018 | 21.207 | 0.069 | 20.100 | 0.031 | 12.9 | Old | 3 | … | … | ||
| B141-G197 | 18.252 | 0.010 | 19.868 | 0.023 | 19.158 | 0.015 | 12.3 | Old | 1 | 0.0 | 0.0 | ||
| B143-G198 | 15.379 | 0.006 | 17.341 | 0.013 | 16.283 | 0.007 | 7.5 | Old | 1 | 0.9 | 0.1 | ||
| B144 | 16.062 | 0.011 | 18.036 | 0.024 | 16.942 | 0.012 | 62.7 | Old | 1 | 1.3 | 0.7 | ||
| B145 | 17.497 | 0.040 | 18.841 | 0.050 | 17.880 | 0.029 | 13.4 | Old | 1 | 0.7 | |||
| B146 | 16.279 | 0.013 | 18.104 | 0.025 | 17.124 | 0.015 | 28.5 | Old | 1 | 0.0 | 0.0 | ||
| B147-G199 | 15.063 | 0.004 | 16.894 | 0.009 | 15.852 | 0.005 | 10.2 | Old | 1 | … | … | ||
| B148-G200 | 15.354 | 0.006 | 16.956 | 0.010 | 16.120 | 0.006 | 12.7 | Old | 1 | 2.2 | 0.5 | for 2nd component | |
| B149-G201 | 18.322 | 0.011 | 20.092 | 0.027 | 18.748 | 0.011 | 28.4 | Old | 1 | … | … | ||
| B150-G203 | 16.045 | 0.011 | 18.007 | 0.023 | 16.941 | 0.013 | 18.1 | Old | 1 | 0.9 | 0.4 | ||
| B151-G205 | 14.163 | 0.002 | 16.462 | 0.007 | 15.193 | 0.003 | 6.5 | Old | 1 | … | … | ||
| B152-G207 | 15.540 | 0.007 | 17.340 | 0.013 | 16.385 | 0.008 | 8.6 | Old | 1 | 0.7 | 0.1 | ||
| B153 | 15.637 | 0.007 | 17.547 | 0.016 | 16.469 | 0.008 | 3.3 | Old | 1 | 1.8 | 0.2 | Mean; km s-1 | |
| B154-G208 | 16.373 | 0.014 | 18.437 | 0.033 | 17.225 | 0.016 | 7.2 | Old | 1 | 1.0 | 0.3 | ||
| B155-G210 | 17.290 | 0.032 | 19.308 | 0.072 | 18.192 | 0.038 | 12.2 | Old | 1 | 1.0 | 0.3 | ||
| B156-G211 | 16.459 | 0.015 | 17.902 | 0.022 | 17.179 | 0.016 | 5.4 | Old | 1 | … | … | ||
| B158-G213 | 14.142 | 0.002 | 15.833 | 0.004 | 14.930 | 0.003 | 4.0 | Old | 1 | … | … | Mean; km s-1 | |
| B159 | 18.674 | 0.014 | 20.872 | 0.051 | 19.689 | 0.022 | 33.1 | Old | 1 | 1.1 | 0.7 | ||
| B160-G214 | 17.552 | 0.042 | 18.631 | 0.043 | 18.174 | 0.038 | 18.4 | Old | 1 | … | … | ||
| B161-G215 | 15.883 | 0.009 | 17.404 | 0.014 | 16.625 | 0.010 | 5.8 | Old | 1 | … | … | Mean; km s-1 | |
| B162-G216 | 16.881 | 0.013 | 18.868 | 0.019 | 17.840 | 0.015 | 11.2 | Old | 1 | 1.4 | 0.3 | ||
| B163-G217 | 14.428 | 0.002 | 16.467 | 0.003 | 15.334 | 0.002 | 4.2 | Old | 1 | … | … | ||
| B164-V253 | 17.295 | 0.016 | 19.272 | 0.024 | 18.165 | 0.016 | 15.7 | Old | 1 | 0.0 | 0.0 | Mean; km s-1 | |
| B165-G218 | 16.080 | 0.006 | 17.321 | 0.005 | 16.722 | 0.005 | 18.5 | Old | 1 | … | … | ||
| B167 | 16.788 | 0.010 | 18.828 | 0.016 | 17.692 | 0.011 | 9.0 | Old | 1 | 0.7 | 0.2 | ||
| B168 | 17.108 | 0.016 | 20.106 | 0.054 | 18.456 | 0.024 | 26.8 | Old | 1 | … | … | ||
| B169 | 16.645 | 0.009 | 18.863 | 0.016 | 17.570 | 0.010 | 18.8 | Old | 1 | … | … | ||
| B170-G221 | 16.849 | 0.006 | 18.608 | 0.012 | 17.656 | 0.008 | 2.8 | Old | 1 | … | … | Mean; km s-1 | |
| B171-G222 | 14.756 | 0.002 | 16.691 | 0.003 | 15.590 | 0.002 | 5.4 | Old | 1 | … | … | ||
| B173-G224 | 17.389 | 0.017 | 19.592 | 0.031 | 18.548 | 0.022 | 31.4 | Old | 1 | 0.5 | |||
| B174-G226 | 14.879 | 0.002 | 16.809 | 0.004 | 15.807 | 0.003 | 12.8 | Old | 1 | … | … | ||
| B176-G227 | 16.124 | 0.003 | 17.454 | 0.005 | 16.806 | 0.004 | 12.4 | Old | 1 | … | … | Mean; km s-1 | |
| B178-G229 | 14.632 | 0.002 | 16.077 | 0.002 | 15.326 | 0.002 | 14.1 | Old | 1 | … | … | ||
| B179-G230 | 14.917 | 0.002 | 16.521 | 0.003 | 15.649 | 0.002 | 11.0 | Old | 1 | … | … | ||
| B180-G231 | 15.596 | 0.004 | 17.353 | 0.005 | 16.404 | 0.004 | 2.6 | Old | 1 | … | … | Mean; km s-1 | |
| B182-G233 | 14.895 | 0.002 | 16.751 | 0.003 | 15.754 | 0.002 | 2.2 | Old | 1 | … | … | Mean; km s-1 | |
| B183-G234 | 15.478 | 0.003 | 17.349 | 0.005 | 16.294 | 0.003 | 7.9 | Old | 1 | … | … | ||
| B184-G236 | 16.632 | 0.011 | 18.862 | 0.019 | 17.591 | 0.012 | 14.1 | Old | 3 | … | … | ||
| B185-G235 | 15.079 | 0.002 | 16.898 | 0.003 | 15.864 | 0.002 | 3.7 | Old | 1 | … | … | Mean; km s-1 | |
| B187-G237 | 16.500 | 0.009 | 18.485 | 0.014 | 17.497 | 0.011 | 10.2 | Old | 1 | 0.1 | |||
| B188-G239 | 16.617 | 0.011 | 18.061 | 0.010 | 17.430 | 0.010 | 17.6 | Old | 1 | 0.0 | 0.0 | ||
| B189-G240 | 16.459 | 0.009 | 18.615 | 0.015 | 17.391 | 0.010 | 17.5 | Old | 3 | … | … | ||
| B190-G241 | 16.286 | 0.008 | 17.958 | 0.009 | 17.135 | 0.008 | 9.9 | Old | 1 | 2.0 | 0.1 | ||
| B192-G242 | 18.035 | 0.040 | 18.534 | 0.016 | 18.401 | 0.025 | 29.8 | Young | 3 | 1.1 | 0.7 | ||
| B193-G244 | 14.795 | 0.002 | 16.820 | 0.004 | 15.701 | 0.003 | 2.2 | Old | 1 | … | … | ||
| B194-G243 | 16.753 | 0.010 | 18.185 | 0.010 | 17.441 | 0.009 | 8.2 | Old | 1 | … | … | Mean; km s-1 | |
| B196D-SH08 | (18.667) | … | (20.560) | … | (19.441) | … | … | … | Young | 3 | 0.1 | 0.8 | |
| B197-G247 | 17.056 | 0.015 | 19.259 | 0.027 | 18.069 | 0.018 | 5.8 | Old | 3 | … | … | ||
| B198-G249 | 17.157 | 0.017 | 18.632 | 0.017 | 17.926 | 0.016 | 20.0 | Old | 3 | 1.3 | 0.3 | ||
| B199-G248 | 17.109 | 0.007 | 18.442 | 0.011 | 17.796 | 0.009 | 12.3 | Old | 1 | … | … | ||
| B200 | 17.824 | 0.031 | 19.775 | 0.044 | 18.833 | 0.036 | 21.3 | Old | 3 | 1.3 | 0.4 | ||
| B201-G250 | 15.679 | 0.004 | 17.233 | 0.005 | 16.414 | 0.004 | 5.8 | Old | 1 | 2.8 | 0.1 | ||
| B201D-D044 | (18.104) | … | (20.118) | … | (18.923) | … | 38.6 | Young | 3 | … | … | ||
| B203-G252 | 16.118 | 0.007 | 17.840 | 0.008 | 16.960 | 0.007 | 6.4 | Old | 1 | … | … | ||
| B204-G254 | 15.228 | 0.003 | 17.011 | 0.004 | 16.004 | 0.003 | 12.1 | Old | 1 | … | … | ||
| B205-G256 | 14.912 | 0.002 | 16.534 | 0.003 | 15.711 | 0.003 | 10.8 | Old | 1 | … | … | ||
| B206-G257 | 14.535 | 0.002 | 16.115 | 0.002 | 15.314 | 0.002 | 8.7 | Old | 1 | … | … | ||
| B206D-D048 | 18.142 | 0.036 | 18.967 | 0.024 | 18.620 | 0.028 | 31.0 | Young | 3 | 0.9 | 0.3 | ||
| B207-G258 | 16.904 | 0.011 | 18.322 | 0.011 | 17.573 | 0.010 | 7.6 | Old | 1 | … | … | ||
| B208-G259 | 17.194 | 0.018 | 19.165 | 0.025 | 18.131 | 0.019 | 12.0 | Old | 1 | … | … | ||
| B209-G261 | 16.093 | 0.007 | 17.642 | 0.007 | 16.858 | 0.006 | 11.4 | Old | 1 | … | … | ||
| B210-M11 | 17.176 | 0.014 | 18.188 | 0.010 | 17.777 | 0.012 | 61.4 | Young | 3 | … | … | ||
| B211-G262 | 16.222 | 0.006 | 17.576 | 0.006 | 16.898 | 0.006 | 13.2 | Old | 1 | … | … | ||
| B212-G263 | 15.060 | 0.002 | 16.440 | 0.003 | 15.737 | 0.002 | 21.4 | Old | 1 | … | … | ||
| B213-G264 | 16.337 | 0.008 | 18.157 | 0.011 | 17.198 | 0.008 | 5.7 | Old | 1 | … | … | ||
| B214-G265 | 17.112 | 0.012 | 18.590 | 0.020 | 17.972 | 0.020 | 18.9 | Old | 3 | 0.0 | 0.0 | ||
| B215-G266 | 16.670 | 0.011 | 18.512 | 0.014 | 17.478 | 0.011 | 10.7 | Old | 1 | … | … | ||
| B215D-D056 | 16.164 | 0.012 | 17.144 | 0.012 | 16.691 | 0.010 | 68.2 | Star | 3 | … | … | ||
| B217-G269 | 15.955 | 0.006 | 17.727 | 0.008 | 16.781 | 0.006 | 7.9 | Old | 1 | … | … | ||
| B218-G272 | 14.302 | 0.002 | 15.977 | 0.002 | 15.057 | 0.001 | 13.7 | Old | 1 | … | … | ||
| B219-G271 | 15.901 | 0.003 | 17.710 | 0.006 | 16.713 | 0.004 | 4.8 | Old | 1 | … | … | Mean; km s-1 | |
| B220-G275 | 16.097 | 0.007 | 17.530 | 0.007 | 16.834 | 0.006 | 23.3 | Old | 1 | 0.0 | 0.0 | ||
| B221-G276 | 16.233 | 0.007 | 18.011 | 0.009 | 17.109 | 0.008 | 9.9 | Old | 1 | 0.7 | 0.1 | ||
| B222-G277 | 17.059 | 0.013 | 18.427 | 0.012 | 17.718 | 0.011 | 19.6 | Young | 1 | … | … | ||
| B224-G279 | 14.983 | 0.002 | 16.369 | 0.003 | 15.713 | 0.002 | 12.2 | Old | 1 | … | … | ||
| B225-G280 | 13.637 | 0.001 | 15.500 | 0.001 | 14.434 | 0.001 | 3.6 | Old | 1 | … | … | ||
| B228-G281 | 16.211 | 0.007 | 18.123 | 0.010 | 17.097 | 0.008 | 13.5 | Old | 1 | … | … | ||
| B229-G282 | 16.133 | 0.007 | 17.422 | 0.006 | 16.851 | 0.006 | 19.0 | Old | 1 | … | … | ||
| B230-G283 | 15.593 | 0.002 | 16.861 | 0.003 | 16.256 | 0.003 | 12.2 | Old | 1 | 0.0 | 0.0 | Mean; km s-1 | |
| B231-G285 | 16.722 | 0.012 | 18.344 | 0.013 | 17.494 | 0.011 | 10.5 | Old | 1 | 0.0 | 0.0 | ||
| B232-G286 | 15.237 | 0.003 | 16.651 | 0.003 | 15.927 | 0.003 | 22.5 | Old | 1 | … | … | ||
| B233-G287 | 15.286 | 0.003 | 16.872 | 0.004 | 16.077 | 0.003 | 20.5 | Old | 3 | … | … | ||
| B234-G290 | 16.241 | 0.007 | 17.984 | 0.009 | 17.074 | 0.007 | 8.2 | Old | 1 | 0.2 | 0.2 | ||
| B235-G297 | 15.777 | 0.005 | 17.414 | 0.006 | 16.559 | 0.005 | 4.2 | Old | 1 | … | … | ||
| B237-G299 | 16.823 | 0.011 | 18.249 | 0.010 | 17.523 | 0.009 | 18.9 | Old | 1 | … | … | ||
| B238-G301 | 15.981 | 0.005 | 17.758 | 0.007 | 16.757 | 0.005 | 5.5 | Old | 1 | … | … | ||
| B239-M74 | 16.762 | 0.006 | 18.285 | 0.009 | 17.489 | 0.007 | 12.4 | Old | 3 | 0.0 | 0.0 | ||
| B240D-D066 | 17.790 | 0.032 | 17.512 | 0.008 | 17.828 | 0.016 | 62.6 | Young | 3 | … | … | ||
| B246 | 17.660 | 0.017 | 19.281 | 0.026 | 18.511 | 0.020 | 20.8 | Old | 1 | … | … | ||
| B247 | 16.949 | 0.009 | 18.491 | 0.013 | 17.708 | 0.010 | 11.4 | Young | 2 | … | … | ||
| B248 | 17.542 | 0.015 | 19.206 | 0.024 | 18.327 | 0.017 | 13.7 | Old | 1 | … | … | ||
| B248D-D070 | 17.632 | 0.026 | 20.278 | 0.065 | 18.808 | 0.034 | 36.0 | Star | 3 | … | … | ||
| B249 | 17.190 | 0.011 | 19.898 | 0.040 | 18.114 | 0.014 | 30.9 | Old | 3 | … | … | ||
| B250D-D071 | 16.573 | 0.008 | 19.316 | 0.075 | 17.740 | 0.020 | … | … | Galaxy | 3 | … | … | GalaxyffClassified on the basis of weak emission at 4548 Å. |
| B251 | 17.194 | 0.015 | 19.985 | 0.050 | 18.306 | 0.020 | 38.6 | Galaxy | 3 | … | … | Probable M31 clusteriiClassified as a galaxy in the literature, but our spectrum is consistent with the object being a star cluster. | |
| B253 | 18.269 | 0.041 | 19.229 | 0.030 | 18.872 | 0.035 | 56.0 | Star | 3 | 4.3 | 1.7 | ||
| B255D-D072 | 17.650 | 0.016 | 19.360 | 0.048 | 18.469 | 0.024 | 14.1 | Old | 4 | … | … | ||
| B257D-D073 | 17.646 | 0.016 | 18.651 | 0.027 | 18.177 | 0.019 | 33.1 | Young | 2 | … | … | ||
| B258 | 17.680 | 0.047 | 18.855 | 0.052 | 18.361 | 0.045 | 55.9 | (Young) | … | … | … | ||
| B258D | 16.322 | 0.005 | 19.398 | 0.044 | 17.822 | 0.013 | 60.7 | Star | 3 | 0.0 | 0.0 | ||
| B262 | 17.016 | 0.025 | 18.650 | 0.041 | 17.884 | 0.029 | 26.6 | Old | 1 | 2.4 | 1.1 | ||
| B265 | 17.949 | 0.030 | 19.692 | 0.042 | 18.786 | 0.032 | 4.5 | Old | 1 | … | … | Mean; km s-1 | |
| B271 | 17.736 | 0.029 | 19.693 | 0.041 | 18.706 | 0.032 | 46.3 | Intermediate | 3 | 0.7 | 0.5 | ||
| B272-V294 | 17.506 | 0.023 | 19.874 | 0.046 | 18.636 | 0.029 | 9.8 | Old | 1 | … | … | ||
| B274 | 18.081 | 0.039 | 20.404 | 0.075 | 19.251 | 0.051 | 26.9 | Old | 3 | 0.9 | 0.5 | ||
| B277-M22 | 18.444 | 0.045 | 19.722 | 0.037 | 19.142 | 0.039 | 13.4 | Young | 2 | … | … | ||
| B279-D068 | 17.812 | 0.031 | 19.959 | 0.051 | 18.744 | 0.033 | 19.0 | Old | 3 | … | … | ||
| B281-G288 | 17.240 | 0.015 | 18.859 | 0.017 | 17.991 | 0.014 | 8.9 | Young | 2 | … | … | ||
| B283-G296 | 17.299 | 0.016 | 18.913 | 0.018 | 18.100 | 0.015 | 12.9 | Old | 1 | … | … | ||
| B303-G026 | 17.775 | 0.015 | 18.408 | 0.013 | 18.142 | 0.013 | 42.7 | Young | 3 | … | … | ||
| B304-G028 | 16.486 | 0.005 | 17.781 | 0.008 | 17.110 | 0.005 | 14.2 | Old | 3 | … | … | ||
| B305-D024 | 17.480 | 0.015 | 18.901 | 0.046 | 18.165 | 0.023 | 29.4 | Young | 2 | … | … | ||
| B306-G029 | 15.587 | 0.002 | 17.955 | 0.008 | 16.692 | 0.004 | 9.1 | Old | 3 | … | … | ||
| B307-G030 | 16.962 | 0.009 | 18.331 | 0.011 | 17.683 | 0.009 | 9.0 | Intermediate | 3 | … | … | ||
| B309-G031 | 17.072 | 0.016 | 18.651 | 0.062 | 17.824 | 0.020 | 17.0 | Old | 3 | … | … | ||
| B311-G033 | 14.992 | 0.002 | 16.562 | 0.003 | 15.790 | 0.002 | 7.3 | Old | 3 | … | … | ||
| B312-G035 | 15.019 | 0.002 | 16.691 | 0.003 | 15.832 | 0.002 | 7.1 | Old | 3 | … | … | ||
| B313-G036 | 15.773 | 0.003 | 17.661 | 0.006 | 16.671 | 0.004 | 13.4 | Old | 3 | … | … | ||
| B315-G038 | 16.035 | 0.004 | 16.640 | 0.003 | 16.475 | 0.003 | 32.9 | Young | 3 | … | … | ||
| B316-G040 | 16.584 | 0.006 | 18.005 | 0.009 | 17.271 | 0.007 | 10.4 | Intermediate | 3 | … | … | ||
| B318-G042 | 16.743 | 0.007 | 16.991 | 0.004 | 17.022 | 0.005 | 56.2 | Young | 3 | … | … | ||
| B319-G044 | 17.205 | 0.011 | 17.609 | 0.007 | 17.563 | 0.008 | 41.9 | Young | 3 | … | … | ||
| B321-G046 | 17.416 | 0.013 | 17.956 | 0.009 | 17.794 | 0.010 | 56.1 | Young | 3 | … | … | ||
| B322-G049 | 17.389 | 0.013 | 17.651 | 0.007 | 17.694 | 0.009 | 36.6 | Young | 1 | 0.0 | 0.0 | ||
| B325 | 16.670 | 0.007 | 17.761 | 0.007 | 17.321 | 0.007 | 19.2 | Young | 3 | … | … | ||
| B327-G053 | 16.323 | 0.005 | 16.707 | 0.003 | 16.706 | 0.004 | 33.4 | Young | 1 | 0.0 | 0.0 | ||
| B330-G056 | 17.059 | 0.010 | 18.412 | 0.011 | 17.802 | 0.009 | 14.3 | Old | 3 | … | … | ||
| B335-V013 | 17.135 | 0.010 | 19.626 | 0.033 | 18.299 | 0.015 | 14.7 | Young | 1 | … | … | ||
| B338-G076 | 13.821 | 0.001 | 15.271 | 0.001 | 14.538 | 0.001 | 8.0 | Old | 3 | … | … | ||
| B341-G081 | 15.783 | 0.003 | 17.400 | 0.005 | 16.556 | 0.004 | 8.5 | Old | 1 | … | … | ||
| B342-G094 | 17.720 | 0.011 | 18.012 | 0.008 | 18.019 | 0.010 | 66.3 | Young | 3 | 1.1 | 0.2 | ||
| B343-G105 | 15.885 | 0.006 | 17.245 | 0.012 | 16.594 | 0.007 | 1.7 | Old | 3 | … | … | ||
| B344-G127 | 15.716 | 0.003 | 17.030 | 0.007 | 16.224 | 0.004 | 15.8 | Old | 3 | … | … | ||
| B345-G143 | 16.287 | 0.003 | 17.617 | 0.005 | 16.983 | 0.004 | 7.8 | Old | 3 | … | … | ||
| B347-G154 | 16.338 | 0.005 | 17.349 | 0.009 | 16.765 | 0.006 | 16.7 | Old | 3 | … | … | ||
| B348-G153 | 16.702 | 0.007 | 18.077 | 0.017 | 17.225 | 0.009 | 8.2 | Old | 3 | … | … | ||
| B350-G162 | 16.233 | 0.003 | 17.551 | 0.005 | 16.928 | 0.004 | 9.8 | Old | 1 | … | … | ||
| B352-G180 | 16.404 | 0.005 | 17.411 | 0.010 | 16.858 | 0.006 | 9.5 | Old | 3 | … | … | ||
| B354-G186 | 17.620 | 0.016 | 18.802 | 0.032 | 18.184 | 0.020 | 14.9 | Old | 3 | … | … | ||
| B355-G193 | 17.658 | 0.017 | 18.422 | 0.024 | 17.961 | 0.017 | 10.6 | Star? | 3 | … | … | ||
| B356-G206 | 16.771 | 0.007 | 18.132 | 0.017 | 17.258 | 0.009 | 2.1 | Old | 3 | … | … | ||
| B365-G284 | 16.225 | 0.006 | 17.650 | 0.019 | 16.948 | 0.010 | 12.6 | Old | 3 | … | … | ||
| B366-G291 | 15.828 | 0.003 | 17.296 | 0.008 | 16.593 | 0.005 | 13.5 | Old | 3 | 0.0 | 0.0 | ||
| B368-G293 | 17.824 | 0.020 | 18.107 | 0.018 | 18.117 | 0.019 | 50.0 | Young | 2 | 1.4 | 0.6 | ||
| B370-G300 | 15.746 | 0.003 | 17.412 | 0.008 | 16.574 | 0.005 | 11.5 | Old | 3 | 0.0 | 0.0 | ||
| B371-G303 | 17.634 | 0.013 | 18.392 | 0.011 | 18.053 | 0.011 | 23.8 | Young | 3 | … | … | ||
| B372-G304 | 16.068 | 0.004 | 17.672 | 0.009 | 16.829 | 0.005 | 7.7 | Old | 3 | … | … | ||
| B373-G305 | 15.131 | 0.002 | 16.976 | 0.005 | 15.966 | 0.003 | 9.9 | Old | 3 | … | … | ||
| B374-G306 | 17.896 | 0.017 | 18.778 | 0.014 | 18.408 | 0.015 | 24.8 | Young | 3 | 0.0 | 0.0 | ||
| B375-G307 | 17.080 | 0.008 | 18.859 | 0.014 | 17.883 | 0.009 | 9.4 | Old | 3 | … | … | ||
| B376-G309 | 17.759 | 0.015 | 18.437 | 0.011 | 18.162 | 0.012 | 23.1 | Young | 3 | … | … | ||
| B378-G311 | 17.182 | 0.011 | 18.508 | 0.020 | 17.917 | 0.014 | 29.2 | Old | 3 | … | … | ||
| B382-G317 | 16.939 | 0.007 | 18.276 | 0.009 | 17.600 | 0.007 | 11.7 | Old | 3 | … | … | ||
| B386-G322 | 15.142 | 0.002 | 16.744 | 0.004 | 15.920 | 0.003 | 9.6 | Old | 3 | … | … | ||
| B388 | 17.684 | 0.013 | 20.005 | 0.036 | 18.694 | 0.018 | 36.7 | Star | 3 | … | … | ||
| B391-G328 | 16.779 | 0.006 | 18.322 | 0.009 | 17.493 | 0.007 | 10.1 | Old | 3 | … | … | ||
| B392-G329 | (16.327) | … | (17.884) | … | (16.977) | … | 15.2 | Young | 3 | … | … | ||
| B431-G027 | (17.084) | … | (19.539) | … | (18.065) | … | 56.8 | Young | 3 | … | … | ||
| B442-D033 | (17.609) | … | (19.008) | … | (18.201) | … | 48.1 | Young | 4 | … | … | ||
| B443-D034 | 18.154 | 0.025 | 18.432 | 0.014 | 18.420 | 0.017 | 25.9 | Young | 3 | … | … | ||
| B448-D035 | 17.368 | 0.013 | 18.352 | 0.012 | 17.923 | 0.012 | 19.5 | Young | 3 | … | … | Mean; km s-1 | |
| B451-D037 | 17.755 | 0.018 | 18.894 | 0.019 | 18.316 | 0.017 | 18.1 | Star? | 3 | … | … | ||
| B453-D042 | 17.926 | 0.022 | 18.302 | 0.012 | 18.254 | 0.017 | 43.1 | Young | 3 | … | … | ||
| B458-D049 | 17.552 | 0.021 | 18.352 | 0.014 | 17.994 | 0.016 | 39.0 | Young | 1 | 2.1 | 0.8 | ||
| B467-G202 | 17.360 | 0.013 | 18.500 | 0.025 | 17.836 | 0.015 | 10.3 | Old | 3 | … | … | ||
| B472-D064 | 14.648 | 0.002 | 16.219 | 0.002 | 15.436 | 0.002 | 12.1 | Old | 1 | … | … | ||
| B475-V128 | 17.150 | 0.011 | 18.086 | 0.016 | 17.682 | 0.012 | 33.9 | Young | 3 | … | … | ||
| B480-V127 | 17.640 | 0.016 | 18.475 | 0.020 | 18.158 | 0.018 | 26.4 | Young | 3 | … | … | ||
| B483-D085 | 17.995 | 0.022 | 18.796 | 0.027 | 18.468 | 0.024 | 25.4 | Young | 3 | … | … | ||
| B484-G310 | 17.892 | 0.020 | 18.860 | 0.029 | 18.444 | 0.023 | 28.3 | Young | 3 | … | … | ||
| BH16 | 17.164 | 0.029 | 18.656 | 0.042 | 17.623 | 0.023 | 27.8 | Old | 1 | 4.0 | 0.7 | ||
| BH18 | 17.384 | 0.036 | 19.270 | 0.070 | 18.428 | 0.047 | 20.6 | Old | 3 | 1.2 | 1.1 | ||
| C009-LGS04131 | (18.699) | … | (19.679) | … | (19.136) | … | 51.4 | Young | 3 | 1.0 | |||
| DAO23 | 18.364 | 0.025 | 20.592 | 0.081 | 19.579 | 0.046 | 40.1 | (Old) | … | … | … | ||
| DAO30 | 17.821 | 0.019 | 19.169 | 0.024 | 18.558 | 0.019 | 18.9 | Young | 3 | … | … | ||
| DAO47 | 18.494 | 0.050 | 19.258 | 0.031 | 18.855 | 0.035 | 31.5 | Young | 3 | 3.5 | 0.5 | ||
| DAO84 | 18.643 | 0.033 | 19.143 | 0.020 | 19.258 | 0.032 | 132.3 | Young | 2 | 0.3 | 2.0 | ||
| Fan 15 | 18.310 | … | … | … | … | … | 29.3 | … | … | … | … | ||
| Fan 16 | 18.640 | … | … | … | … | … | 24.4 | … | … | … | … | Mean; km s-1 | |
| Fan 37 | 15.290 | … | … | … | … | … | 48.0 | … | … | 1.9 | 0.5 | ||
| Fan 42 | 16.610 | … | … | … | … | … | 43.0 | … | … | 1.0 | 0.3 | ||
| Fan 55 | 18.220 | … | … | … | … | … | 38,4 | … | … | … | … | ||
| G083-V225 | (18.162) | … | (19.729) | … | (18.816) | … | 41.7 | Young | 1 | … | … | ||
| G137 | 18.914 | 0.018 | 19.170 | 0.014 | 19.175 | 0.015 | … | Old | 3 | 2.9 | 370 | PN | |
| KHM31-81 | (19.302) | … | (20.433) | … | (19.795) | … | 52.5 | Young | 3 | 0.0 | 0.0 | ||
| M009 | 17.306 | 0.016 | 18.661 | 0.015 | 18.019 | 0.014 | 24.4 | Old | 3 | 0.7 | 0.6 | ||
| M019 | 17.772 | 0.030 | 19.340 | 0.031 | 18.628 | 0.030 | 14.5 | Old | 3 | … | … | ||
| M028 | 18.316 | 0.051 | 19.234 | 0.030 | 18.811 | 0.037 | 16.7 | Star | 4 | … | … | ||
| M040 | 18.393 | 0.053 | 20.210 | 0.066 | 19.344 | 0.057 | 38.2 | Young | 2 | 4.1 | 1.6 | ||
| M043 | 19.337 | 0.102 | 20.709 | 0.090 | 19.936 | 0.080 | 46.2 | Young | 2 | … | … | ||
| M045 | 18.131 | 0.042 | 20.010 | 0.055 | 19.026 | 0.043 | 29.9 | Young | 2 | … | … | ||
| M047 | 18.237 | 0.046 | 19.872 | 0.049 | 19.005 | 0.042 | 16.4 | Intermediate | 1 | 0.0 | 0.0 | ||
| M058 | 17.885 | 0.034 | 19.356 | 0.032 | 18.925 | 0.039 | 19.4 | Young | 2 | … | … | ||
| M059 | 18.219 | 0.027 | 19.666 | 0.065 | 18.924 | 0.037 | 20.0 | Young | 3 | … | … | ||
| M094 | 19.666 | 0.101 | 20.753 | 0.158 | 20.354 | 0.130 | 21.7 | Star | 4 | 0.0 | 0.0 | ||
| MITA140 | (16.059) | … | (19.960) | … | (17.574) | … | 19.0 | Old | 1 | … | … | ||
| MITA166 | 18.230 | … | … | … | … | … | 35.8 | … | … | 0.4 | |||
| NB16 | 17.491 | 0.039 | 19.585 | 0.092 | 18.486 | 0.049 | 24.0 | Old | 3 | 0.7 | |||
| NB17-AU014 | 19.060 | 0.167 | 20.033 | 0.152 | 19.548 | 0.134 | 43.1 | Old | 4 | 1.3 | 0.8 | ||
| NB21-AU5 | 17.224 | 0.031 | 19.095 | 0.060 | 17.940 | 0.030 | 43.2 | Old | 1 | 0.4 | 0.3 | ||
| NB23 | 16.665 | 0.019 | 18.570 | 0.038 | 17.519 | 0.021 | 23.8 | Galaxy | 3 | 2.8 | 1.0 | FWHM = 262 km s-1ggBoth [O III] and H are well resolved and have the same double-peaked emission profile. | |
| NB63 | 16.788 | 0.021 | 17.955 | 0.024 | 17.296 | 0.018 | 18.4 | Star? | 3 | 1.0 | 0.4 | ||
| NB67-AU13 | 15.564 | 0.007 | 16.559 | 0.008 | 16.064 | 0.006 | 17.2 | Star | 3 | … | … | ||
| NB89 | (17.423) | … | (19.433) | … | (18.240) | … | 30.1 | Old | 4 | 2.1 | 1.5 | ||
| PHF7-2 | (17.773) | … | (19.123) | … | (18.347) | … | 28.4 | Young | 1 | … | … | ||
| SK006A | 18.811 | 0.045 | 20.267 | 0.063 | 19.459 | 0.043 | 38.5 | Star | 4 | … | … | ||
| SK007A | 17.630 | 0.017 | 17.563 | 0.007 | 17.834 | 0.012 | 45.6 | Young | 4 | … | … | ||
| SK008A | 18.581 | 0.038 | 20.209 | 0.059 | 19.350 | 0.042 | 21.8 | Star | 3 | … | … | ||
| SK009A | 19.374 | 0.079 | 20.838 | 0.106 | 20.260 | 0.097 | 23.6 | Star | 4 | … | … | ||
| SK010A | 18.154 | 0.025 | 19.519 | 0.032 | 19.116 | 0.031 | 24.4 | Star | 4 | … | … | ||
| SK012A | 18.125 | 0.025 | 20.022 | 0.049 | 18.964 | 0.030 | 19.7 | Star | 4 | … | … | ||
| SK013A | 18.568 | 0.038 | 20.399 | 0.069 | 19.423 | 0.045 | 67.7 | Star | 4 | … | … | ||
| SK014A | 17.460 | 0.014 | 18.449 | 0.013 | 17.955 | 0.013 | 44.0 | Star | 4 | 2.2 | 3.4 | ||
| SK015A | 19.716 | 0.110 | 20.524 | 0.085 | 20.416 | 0.114 | 33.1 | (Young) | … | 0.3 | 0.5 | ||
| SK016A | 19.259 | 0.070 | 21.578 | 0.194 | 20.275 | 0.096 | 26.8 | (Young) | … | 0.5 | 0.5 | ||
| SK017A | 18.867 | 0.050 | 19.830 | 0.045 | 19.322 | 0.042 | 17.3 | Star | 4 | … | … | ||
| SK018A | 18.701 | 0.048 | 19.975 | 0.047 | 19.425 | 0.040 | 14.9 | Young | 3 | 1.2 | Mean; km s-1 | ||
| SK019A | 18.225 | 0.029 | 20.675 | 0.073 | 19.283 | 0.031 | … | … | Old | 4 | … | … | |
| SK021A | 18.251 | 0.040 | 19.963 | 0.054 | 19.191 | 0.045 | 29.7 | Star | 4 | 0.4 | 0.3 | ||
| SK022A | 18.631 | 0.025 | 19.960 | 0.037 | 19.391 | 0.031 | 19.0 | Star | 4 | … | … | ||
| SK023A | 18.976 | 0.078 | 20.216 | 0.071 | 19.920 | 0.089 | 76.1 | Star | 4 | 0.0 | 0.0 | ||
| SK024A | 18.987 | 0.034 | 21.844 | 0.181 | 20.039 | 0.055 | 22.6 | Star | 4 | … | … | ||
| SK025A | 19.321 | 0.104 | 22.211 | 0.381 | 20.697 | 0.173 | 22.5 | Star | 4 | … | … | ||
| SK026A | 18.904 | 0.032 | 20.941 | 0.085 | 19.685 | 0.040 | 32.7 | Old | 4 | … | … | ||
| SK027A | 19.167 | 0.092 | 20.893 | 0.126 | 20.198 | 0.113 | 24.3 | Star | 4 | 0.4 | |||
| SK028A | 18.832 | 0.066 | 21.565 | 0.213 | 20.367 | 0.127 | 31.0 | Star | 4 | … | … | ||
| SK029A | 18.718 | 0.061 | 20.095 | 0.063 | 19.473 | 0.059 | 32.5 | Star | 4 | … | … | ||
| SK030A | 18.882 | 0.071 | 20.528 | 0.091 | 19.621 | 0.068 | 27.2 | Star | 4 | 2.2 | 0.9 | ||
| SK031A | 19.530 | 0.128 | 21.179 | 0.165 | 20.648 | 0.171 | 38.3 | Star | 3 | … | … | ||
| SK032A | 18.749 | 0.063 | 20.239 | 0.071 | 19.378 | 0.055 | 28.9 | Star | 4 | … | … | ||
| SK033A | 19.017 | 0.081 | 20.162 | 0.068 | 19.759 | 0.078 | 43.5 | Star | 4 | 0.9 | 0.9 | ||
| SK037A | 19.896 | 0.183 | 20.412 | 0.090 | 20.356 | 0.137 | 76.2 | Star | 4 | 1.5 | 0.9 | ||
| SK039A | 18.114 | 0.070 | 19.249 | 0.074 | 18.695 | 0.061 | 17.7 | Star | 4 | 1.5 | 0.7 | ||
| SK040A | 18.802 | 0.066 | 20.280 | 0.073 | 19.486 | 0.060 | 58.3 | Star | 4 | 1.9 | |||
| SK041A | 18.910 | 0.074 | 19.615 | 0.043 | 19.291 | 0.052 | 64.0 | Star | 4 | 3.6 | 2.2 | ||
| SK042A | 19.614 | 0.140 | 20.379 | 0.086 | 20.618 | 0.170 | 78.1 | HII | 4 | 0.8 | 4.2 | ||
| SK043A | 18.493 | 0.049 | 20.273 | 0.071 | 19.397 | 0.055 | 51.7 | Star | 4 | 0.9 | |||
| SK044A | 18.328 | 0.043 | 19.466 | 0.036 | 19.158 | 0.045 | 39.0 | Star | 4 | 5.0 | |||
| SK045A | 15.497 | 0.003 | 16.946 | 0.004 | 16.153 | 0.003 | 7.1 | Star | 4 | … | … | ||
| SK046A | 18.975 | 0.077 | 20.264 | 0.074 | 19.678 | 0.072 | 14.4 | Star | 4 | … | … | ||
| SK047A | 19.681 | 0.148 | 20.865 | 0.128 | 20.311 | 0.129 | 91.4 | Star | 4 | 2.1 | 1.5 | ||
| SK048A | 18.129 | 0.036 | 19.345 | 0.032 | 18.840 | 0.034 | 79.0 | Star | 4 | 4.0 | 2.4 | ||
| SK049A | 19.378 | 0.112 | 20.919 | 0.131 | 20.200 | 0.115 | … | … | Old | 4 | 3.6 | ||
| SK050A | 17.508 | 0.040 | 19.384 | 0.078 | 18.399 | 0.046 | 25.4 | Star | 4 | 1.3 | 0.5 | ||
| SK051A | 18.869 | 0.069 | 21.305 | 0.173 | 20.075 | 0.099 | 22.1 | Star | 4 | 1.5 | |||
| SK052A | 18.186 | 0.027 | 19.321 | 0.052 | 18.777 | 0.034 | 16.6 | Old | 4 | … | … | ||
| SK053A | 17.858 | 0.013 | 19.571 | 0.025 | 18.643 | 0.016 | 8.8 | Old | 4 | … | … | ||
| SK054A | 17.702 | 0.048 | 19.380 | 0.079 | 18.461 | 0.049 | 38.6 | Old | 4 | 0.0 | 0.0 | ||
| SK055A | 18.074 | 0.034 | 19.808 | 0.047 | 18.861 | 0.034 | … | … | Old | 4 | … | … | |
| SK056A | 18.405 | 0.046 | 19.853 | 0.050 | 19.011 | 0.039 | 84.6 | HII | 4 | 2.0 | 0.6 | ||
| SK058A | 18.945 | 0.054 | 19.800 | 0.082 | 19.593 | 0.073 | 23.2 | Star | 4 | … | … | ||
| SK059A | 17.111 | 0.027 | 19.630 | 0.092 | 18.169 | 0.036 | 24.5 | HII | 4 | 7.6 | 1.4 | ||
| SK060A | 18.561 | 0.052 | 20.731 | 0.104 | 19.631 | 0.067 | 17.4 | Old | 4 | … | … | ||
| SK061A | 18.754 | 0.075 | 19.823 | 0.050 | 18.904 | 0.040 | 31.3 | Old | 4 | 0.0 | 0.0 | ||
| SK062A | 19.081 | 0.060 | 20.525 | 0.143 | 19.670 | 0.073 | 18.9 | Old | 4 | … | … | ||
| SK063A | 17.644 | 0.026 | 20.095 | 0.056 | 18.680 | 0.031 | 14.0 | Star | 4 | … | … | ||
| SK064A | 19.305 | 0.051 | 20.938 | 0.095 | 19.840 | 0.052 | 16.1 | Old | 4 | … | … | ||
| SK065A | 18.094 | 0.041 | 19.354 | 0.032 | 18.749 | 0.034 | 42.0 | Star | 4 | … | … | ||
| SK066A | 19.808 | 0.198 | 20.989 | 0.142 | 20.645 | 0.192 | 52.0 | Old | 4 | … | … | ||
| SK067A | 17.988 | 0.036 | 20.237 | 0.065 | 19.011 | 0.042 | 36.1 | Galaxy | 3 | … | … | Probable M31 clusteriiClassified as a galaxy in the literature, but our spectrum is consistent with the object being a star cluster. | |
| SK068A | 19.083 | 0.041 | 21.031 | 0.101 | 19.866 | 0.052 | 36.5 | Young | 2 | … | … | ||
| SK069A | 18.222 | 0.046 | 19.681 | 0.042 | 19.159 | 0.049 | 12.3 | Star | 4 | … | … | ||
| SK070A | 18.485 | 0.057 | 20.855 | 0.112 | 19.462 | 0.063 | 21.6 | Galaxy | 3 | 12.0 | 13 | Probable M31 clusteriiClassified as a galaxy in the literature, but our spectrum is consistent with the object being a star cluster. | |
| SK071A | 18.760 | 0.073 | 21.380 | 0.178 | 19.778 | 0.083 | 17.3 | Old | 3 | … | … | ||
| SK072A | 16.973 | 0.012 | 18.799 | 0.016 | 17.809 | 0.012 | 16.5 | Old | 4 | 1.1 | 0.3 | ||
| SK073A | 17.507 | 0.019 | 19.431 | 0.027 | 18.403 | 0.020 | 10.7 | Old | 4 | … | … | ||
| SK074A | 18.375 | 0.053 | 19.938 | 0.053 | 19.198 | 0.050 | 22.9 | Star | 4 | … | … | ||
| SK075A | 18.873 | 0.083 | 20.372 | 0.079 | 19.765 | 0.085 | … | … | Galaxy | 3 | … | … | galaxyhhClassified using the redshifted emission lines of H and the [O III] doublet. |
| SK076A | 18.343 | 0.051 | 19.989 | 0.055 | 19.266 | 0.053 | 96.5 | Star | 4 | … | … | ||
| SK077A | 17.813 | 0.025 | 19.190 | 0.023 | 18.446 | 0.021 | 39.1 | Star | 4 | … | … | ||
| SK078A | 17.687 | 0.028 | 19.078 | 0.025 | 18.508 | 0.027 | 35.1 | Galaxy | 3 | … | … | Probable M31 clusteriiClassified as a galaxy in the literature, but our spectrum is consistent with the object being a star cluster. | |
| SK079A | 18.025 | 0.038 | 20.200 | 0.063 | 19.179 | 0.048 | 22.3 | Star | 3 | 1.7 | 0.7 | ||
| SK080A | 18.070 | 0.024 | 19.437 | 0.053 | 18.432 | 0.024 | 23.1 | Star | 4 | … | … | ||
| SK081A | 18.676 | 0.041 | 20.997 | 0.203 | 19.719 | 0.074 | 14.3 | Star | 4 | … | … | ||
| SK082A | 19.327 | 0.075 | 20.704 | 0.170 | 19.926 | 0.093 | 31.5 | Star | 4 | 1.0 | |||
| SK083A | 19.027 | 0.056 | 21.215 | 0.251 | 20.267 | 0.121 | 14.2 | Old | 4 | … | … | ||
| SK084A | 18.192 | 0.036 | 19.243 | 0.025 | 18.983 | 0.034 | 32.1 | (Young) | … | 1.1 | 1.7 | ||
| SK085A | 18.419 | 0.056 | 19.301 | 0.032 | 19.192 | 0.051 | 40.7 | Star | 4 | … | … | ||
| SK086A | 17.243 | 0.018 | 19.376 | 0.030 | 18.138 | 0.019 | 16.3 | Old | 4 | … | … | ||
| SK087A | 18.084 | 0.024 | 19.389 | 0.051 | 18.889 | 0.036 | 16.4 | Star | 4 | … | … | ||
| SK088A | 18.482 | 0.033 | 21.951 | 0.438 | 19.552 | 0.061 | 42.0 | Star | 4 | … | … | ||
| SK089A | 18.812 | 0.077 | 21.061 | 0.138 | 19.821 | 0.087 | 28.8 | Star | 4 | … | … | ||
| SK090A | 18.915 | 0.087 | 20.219 | 0.070 | 19.633 | 0.076 | 24.7 | (Old) | … | … | … | ||
| SK091A | 18.338 | 0.030 | 19.839 | 0.076 | 19.553 | 0.064 | 44.9 | Star | 4 | 0.6 | |||
| SK092A | 19.299 | 0.074 | 20.349 | 0.126 | 19.799 | 0.084 | 23.4 | (Young) | … | … | … | ||
| SK093A | 18.940 | 0.053 | 20.445 | 0.132 | 19.868 | 0.087 | 25.9 | Old | 4 | … | … | ||
| SK094A | 18.160 | 0.043 | 19.607 | 0.040 | 18.934 | 0.040 | 20.7 | Star | 3 | 0.5 | 1.0 | ||
| SK095A | 18.741 | 0.044 | 20.518 | 0.138 | 19.859 | 0.085 | 30.4 | (Old) | … | … | … | ||
| SK096A | 17.942 | 0.029 | 19.269 | 0.025 | 18.567 | 0.023 | 8.6 | Star | 4 | … | … | ||
| SK097A | 18.521 | 0.061 | 19.748 | 0.046 | 19.120 | 0.048 | 45.9 | (Old) | … | … | … | ||
| SK098A | 18.553 | 0.062 | 19.914 | 0.052 | 19.390 | 0.060 | 16.6 | Star | 4 | 0.9 | 5.0 | ||
| SK099A | 18.300 | 0.030 | 19.435 | 0.054 | 18.917 | 0.037 | 39.7 | Star | 4 | … | … | ||
| SK100A | 18.236 | 0.046 | 19.805 | 0.047 | 19.130 | 0.047 | 11.9 | Star | 4 | … | … | ||
| SK100C | (17.963) | … | (20.934) | … | (19.135) | … | 29.2 | (Old) | … | … | … | ||
| SK101A | 18.795 | 0.045 | 20.564 | 0.125 | 19.675 | 0.068 | 18.2 | Star | 4 | … | … | ||
| SK104A | 17.367 | 0.012 | 19.109 | 0.033 | 18.284 | 0.019 | 9.6 | Old | 4 | 0.0 | 0.0 | ||
| SK105A | 18.497 | 0.034 | 19.997 | 0.076 | 19.201 | 0.045 | 17.0 | (Old) | … | … | … | ||
| SK106A | 18.939 | 0.051 | 20.768 | 0.150 | 19.960 | 0.088 | 30.9 | Star | 4 | … | … | ||
| V014 | (17.052) | … | (18.113) | … | (17.519) | … | 55.8 | Young | 3 | … | … | ||
| V031 | 17.450 | 0.016 | 18.628 | 0.015 | 18.142 | 0.013 | 30.7 | Young | 1 | … | … | ||
| V034 | 16.475 | 0.016 | 17.398 | 0.015 | 17.969 | 0.031 | … | … | HII | 3 | … | … | galaxyhhClassified using the redshifted emission lines of H and the [O III] doublet. |
| V202 | … | … | … | … | … | … | 48.7 | Young | 3 | … | … | ||
| VDB0-B195D | 14.889 | 0.002 | 15.184 | 0.001 | 15.220 | 0.001 | 48.3 | Young | 1 | … | … | ||
| V202 (pos?) | 18.804 | 0.047 | 20.646 | 0.086 | 20.714 | 0.140 | … | … | Young | 3 | 1.8 | 66 | |
| Ma94a(380) | 14.720 | … | … | … | … | … | 6.7 | … | … | 0.0 | 0.066 | ||
| MIT311 | 18.340 | … | … | … | … | … | 28.0 | … | … | 1.8 | 0.866 |
| Cluster | Age (Gyr)aaAge estimate of Caldwell et al. (2009, 2011); Objects labeled as “Star” were classified by Peacock et al. (2010). | S/N (5007 Å) | S/N (H) | bbRatio of [O III] to H | EW (Å) | (km s-1) | |||
|---|---|---|---|---|---|---|---|---|---|
| Globular Clusters | |||||||||
| B115-G177 | 14 | 72 | 16 | 3.0 | 2.5 | 0.42 | |||
| BH16 | Old | 8.3 | 2.4 | 4.0 | 0.7 | 2.71 | |||
| NB89ccAge from Beasley et al. (2005); emission may be warm ISM | 10.4 | 36 | 12 | 2.1 | 1.5 | 1.10 | |||
| Young Clusters | |||||||||
| B458-D049 | 0.5 | 6.0 | 1.6 | 2.1 | 0.8 | 2.87 | |||
| M040 | Young | 5.5 | 1.1 | 4.1 | 1.6 | 0.91 | |||
| C009-LGS04131 | 0.3 | 6.3 | … | 1.0 | 0.32 | ||||
| SK018A | 0.8 | 7.0 | … | 1.2 | 0.50 | ||||
| DAO47 | 0.5 | 3.8 | … | 3.5 | 0.5 | 0.79 | |||
| Possible Clusters | |||||||||
| SK044A | “Star” | 15 | … | 1.9 | 0.12 | ||||
| SK051A | “Star” | 6.5 | … | 1.5 | 1.45 | ||||
| Milky Way Clusters | |||||||||
| Pal 6/JaFu1 | Old | … | … | 6.3 | … | 0.29 | |||
| M15/Ps 1 | Old | … | … | 2.0 | … | 1.35 | |||
| NGC 6441/JaFu2 | Old | … | … | 3.3 | … | 1.06 | |||
| M22/GJJC-1 | Old | … | … | … | 1.14 | ||||