Test of the hadronic interaction models at around *10 TeV with Tibet EAS core data
Abstract
A hybrid experiment has been started by AS collaboration at Tibet, China, since May 2009, that consists of a burst-detector-grid (YAC, Yangbajing Air shower Core array) and the Tibet air-shower array (Tibet-III). The first step of YAC, called YAC-I , contains 16 detector units and observes high energy electromagnetic particles in air-shower cores within several meters from the shower axis, and Tibet-III array measures the total energy and the arrival direction of air showers. YAC-I is used to check hadronic interaction models currently used for air-shower simulations such as QGSJET, SIBYLL , EPOS etc. through the multi-parameter measurement in air-shower cores. In this paper, we used a data set collected from May 1st 2009 through February 23rd 2010 by the YAC-I. The effective live time used for the present analysis is 169.65 days. The preliminary results of the interaction model checking at *10 TeV energy region is reported in this paper.
1 Introduction
The interpretation of the extensive air showers (EAS) is known to inevitably depend on the Monte Carlo simulations which are based on some hadronic interaction models and cosmic ray composition models. At present, the simulation code CORSIKA that is comprehensively used in the surface cosmic ray studies includes many interaction models. For multi-parameter measurements of EASs, it is known that no interaction model can explain all data consistently. Therefore, the hadronic interaction models need to be checked and further improved.
In this paper, we report our approach and the preliminary results to check the hadronic interaction models QGSJET2 and SIBYLL2.1 at an energy region of *10 TeV using the data obtained by the newly constructed YAC-I (Yangbajing Air shower Core detector, the first stage). The energy region of *10 TeV is chosen by the following considerations: 1) The primary composition at this energies has been better measured by direct measurements, and the uncertainty[1] is smaller. 2) The corresponding energies in the center-of-mass system are around *100 GeV, for that collider made good measurements on the inelastic cross section and on the particle production in the near-forward region. The uncertainty from the extrapolation to the very forward region is relatively small. 3) The check of interaction models should be step-by-step executed from lower energies to higher energies. 4) Due to the high altitude of our Tibet experiment we could have good EAS core events recorded by YAC-I at *10 TeV region.
2 YAC-I experiment
YAC-I, consisting of 16 scintillation detectors, has been successfully operated at Yangbajing in Tibet, China, since May 2009, together with the Tibet-III EAS array. Each unit of YAC-I is composed by a lead layer of 3.5 cm thickness (7 r.l.) and a plastic scintillator of size 40 cm 50 cm1 cm. Each YAC-I detector is used to record the electromagnetic showers induced by high energy electrons and/or photons in the EAS cores. 16 detectors are arranged by , forming a 10 m2 covering. To achieve a wider burst size measurement under the lead layer, a wide dynamic range from 1 MIP (Minimum Ionization Particle) to MIPs is demanded which is realized by two photomultipliers(PMT), i.e. a high-gain PMT and a low-gain PMT for the range of and MIPs, respectively. The response linearity of each YAC-I detector was calibrated by cosmic-ray single muons and by the accelerator beam (BEPC-LINAC)[10]. YAC-I is triggered when any one of 16 detectors records a local shower with the size of at least 20 MIPs. The event rate is about 30 Hz. The total live time of our data set in present analysis is 169.65 days.
| Composition model | Component | TeV | TeV | - TeV |
|---|---|---|---|---|
| P | 38.6% | 32.0% | 24.2% | |
| HD | He | 24.7% | 22.4% | 19.1% |
| model | M | 24.7% | 27.1% | 27.3% |
| Fe | 10.4% | 18.5% | 29.4% | |
| P | 47.3% | 31.1% | 26.3% | |
| NLA | He | 30.2% | 25.1% | 28.9% |
| model | M | 30.3% | 32.4% | 34.4% |
| Fe | 12.8% | 11.3% | 10.6% |
3 Simulations

A Monte Carlo simulation has been carried out on the development of EASs in the atmosphere and their response in YAC-I. The simulation code CORSIKA (version 6.204)[2] including QGSJET2 and SIBYLL2.1 hadronic interaction models are used to generate air shower events. In this work, two primary composition models are used, the heavy dominant model(HD)[3] and the non-linear acceleration model(NLA)[4], as shown in Fig.1. The proton spectrum of the two models is connected with the direct experiment in the low energy and consistent with the spectrum obtained from the Tibet AS+EC experiment in the high energy. The He spectrum of HD model coincides with the results from RUNJOB and ATIC-I, but the He spectrum of NLA coincides with the results from JACEE, ATIC-II, CREAM3. The sum of all single-component spectra can reproduce the sharp knee in all particle spectrum[4]. The fractions of the component of the two composition models in different energy regions are listed in Table 1.
In the simulation, the primary energy is sampled from 1 TeV to infinite with zenith angles from 0 to 60 degrees incident isotropically. The axis of each EAS event is randomly dropped onto an area of 32.84 m 32.14 m with YAC-I at its central part. When high energy electrons or photons hit a YAC-I detector, the EPICS(8.64)[5] code is used to generate the cascade showers in the Pb layer and in the detector. To identify an AS core event we use following quantities:
: number of shower particles recorded by a YAC-I detector;
: number of YAC-I detectors with higher than a threshold value min (If min for a YAC detector, it is called that this detector is fired);
: the sum of all from 1 to ;
: the maximum of all ;
: the mean lateral distance from the center of a fired detector to the weighter center of all fired detectors;
: the mean weighted lateral distance from the center of a fired detector to the weighted center.
By choosing a min value and setting some event selection conditions we can obtain different event samples for that primary energies range at different region. For the present work using min=200 and the conditions of 1) =3, , 2) =4, , 3) =5, , three Monte Carlo samples with the mode energy at 35 TeV, 70 TeV and 90 TeV are obtained, respectively. Their sample sizes are seen from Table 2. In all 12 cases, Monte Carlo shows that the core resolution is better than 2 m if the weighted center is taking as the AS core.
| Mode energy | TeV | TeV | TeV |
|---|---|---|---|
| QGSJET2+HD | 2640 | 8893 | 5352 |
| SIBYLL2.1+HD | 2921 | 9239 | 5495 |
| QGSJET2+NLA | 4484 | 15515 | 9312 |
| SIBYLL2.1+NLA | 3941 | 12568 | 7492 |
| YAC-I data | 1773 | 5640 | 3220 |
4 Data analysis


The present analysis uses a subset of data collected in the period from May 1st, 2009 to February 23rd, 2010, having stable instrument conditions. We first check some noises appeared in our data set due to the hardware and the environment conditions. It is found that most noises appear as smaller ’signals’. Taking min=200 can remove them and achieve a biggest available data sample. In addition, we found some gain drift for some YAC-I detectors during the operating process, by checking spectrum of each YAC-I detector. By an ’off-line self-calibration’ method this effect is carefully treated and corrected. Then the fit between high-gain signals and low-gain signals in their overlapping region is executed and (or MIPs) is obtained for each fired YAC-I detector.
After the off-line calibration, events with 200 and 1 are obtained. Three experimental data samples with the same selection criteria of Monte Carlo are obtained. The sizes of each sample are also listed in Table2.
5 Results and Discussion
Since our Monte Carlo simulation is started from 1 TeV, in order to normalize MC data and experimental data, we need to know the integral intensity of all particles of cosmic rays at E0 = 1 TeV. Starting from Hrandal’s spectra of each composition[7], we improve the major 8 ones (p, He, C, O, Ne, Mg, Si , and Fe) by the newest measurements [8][9][10]. The resultant integral intensity: I(E01 TeV) = 0.139 cm-2s-1sr-1 with the error +0.0013, -0.0012 coming from the error of the index of each of the 8 spectra.
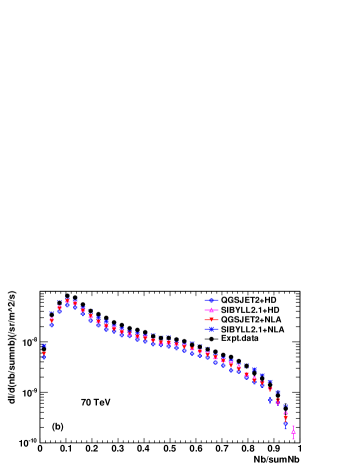
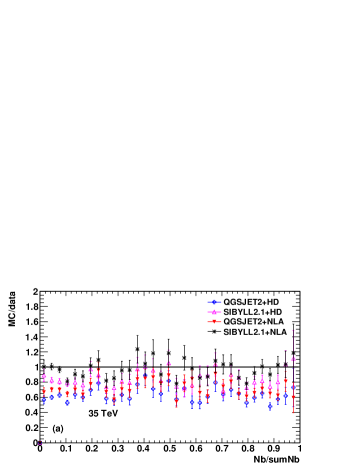
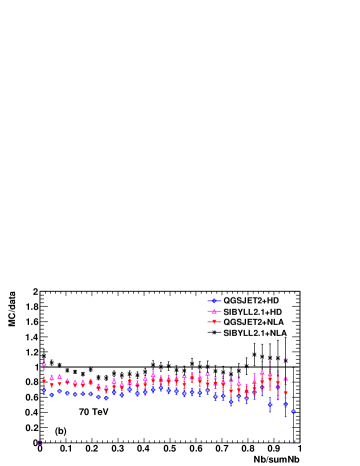
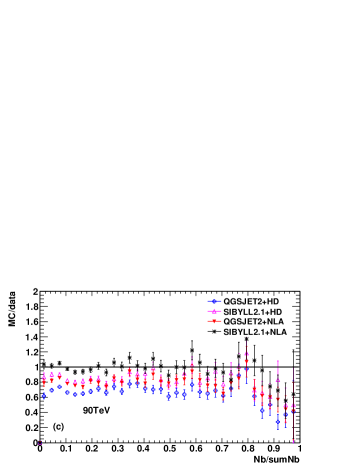
The comparison of our data with Monte Carlo simulations of QGSJET2+NLA, QGSJET2+HD, SIBYLL2.1+NLA and SIBYLL2.1+HD is seen from Fig.2 and Fig.3:
(1) The shape of the distributions of / are consistent between the YAC-I data and simulation data in all four cases, indicating that in the *10 TeV energy region the particle production spectrum of QGSJET2 and SIBYLL2.1 may correctly reflect the reality within our experimental systematic uncertainty of a level about 10%.
(2) The comparison of event absolute intensities in all cases, as seen from Fig.2 and Fig.3, shows some discrepancies. The smallest one is SIBYLL2.1+NLA and the most obvious one is QGSJET2+HD. For a given interaction model the NLA composition is better than HD. For a given composition model SIBYLL2.1 is better than QGSJET2.
(3) But note that, as seen from Fig 1, both composition models NLA and HD used a steeper He spectrum, if comparing with the new results from PAMELA and CREAM. It can be estimated that NLA under-estimated the number of He events for about 30-40% in the related energy region. If involving this factor, QGSJET2 results can go higher and be possible better consistent with data. A further analysis is going on.
6 Summary
A smaller high-altitude AS core detector YAC-I shows the ability and sensitivity in checking the hadronic interaction models in *10 TeV region.
The experimental distributions, / and has the shape very close to the Monte Carlo predictions of QGSJET2+NLA, QGSJET2+HD, SIBYLL2.1+NLA and SIBYLL2.1+HD. Some other quantities, such as , , top, Rw, Rw have the same behavior as well, though we did not show them in this paper due to the limit of the space.
Some discrepancies in the absolute intensities are seen. Data normally shows a higher intensity than Monte Carlo. Taking a more hard He spectrum (and somewhat hard proton spectrum) as given by CREAM at the 1-100 TeV region can improve this situation. A further study is going on.
7 Acknowledgement
This work is supported by the Chinese Academy of Sciences (H9291450S3) and the Key Laboratory of Particle Astrophysics, Institute of High Energy Physics, CAS. The Knowledge Innovation Fund (H95451D0U2 and H8515530U1) of IHEP, China. The project Y0293900TF of NSFC also provide support to this study.
References
- [1] B. Wiebel-Sooth, et al., Astronomy and Astrophysics 330, 389 (1998).
-
[2]
D.Heck et al., Report FZKA 6019,(1998);
J.Knapp, D.Heck et al., Report FZKA 3640,(1997). - [3] M.Amenomori, et al., ApJ 678:1165-1179,(2008).
- [4] M.Shibata, J.Huang et al., ApJ 716, 1076-1083,(2010).
-
[5]
K.Kasahara, et al., http://eweb.b6.kanagawa-u.ac.jp
/Kasahara/ResearchHome/EPICSHome/Index.html. - [6] H.S.Ahn et.al., ApJL, 714:l89-l93,(2010).
- [7] J.R. Hrandel, Astrop. Phys., 19,192,(2003).
- [8] O.Adriani, et al., Science 332,69,(2011).
- [9] H.S.Ahn, et al., ApJ., 707,593-603,(2009).
- [10] M.Amenomori, et al., ICRC32(HE 1.4,ID: 1217), (2011).