Detection of the large scale alignment of massive galaxies at
Abstract
We report on the detection of the alignment between galaxies and large-scale structure at based on the CMASS galaxy sample from the Baryon Oscillation Spectroscopy Survey data release 9. We use two statistics to quantify the alignment signal: 1) the alignment two-point correlation function which probes the dependence of galaxy clustering at a given separation in redshift space on the projected angle () between the orientation of galaxies and the line connecting to other galaxies, and 2) the statistic which estimates the average of for all correlated pairs at given separation . We find significant alignment signal out to about 70 Mpc in both statistics. Applications of the same statistics to dark matter halos of mass above in a large cosmological simulation show similar scale-dependent alignment signals to the observation, but with higher amplitudes at all scales probed. We show that this discrepancy may be partially explained by a misalignment angle between central galaxies and their host halos, though detailed modeling is needed in order to better understand the link between the orientations of galaxies and host halos. In addition, we find systematic trends of the alignment statistics with the stellar mass of the CMASS galaxies, in the sense that more massive galaxies are more strongly aligned with the large-scale structure.
Subject headings:
dark matter — large-scale structure of universe — galaxies: halos — galaxies: formation — methods: statistical1. Introduction
Galaxies are not oriented at random, but show various forms of spatial alignment (Carter & Metcalfe, 1980; Binggeli, 1982; Dekel, 1985; West, 1989; Struble, 1990; Plionis, 1994; Plionis et al., 2003; Hashimoto et al., 2008). In particular, recent studies of galaxies in the Sloan Digital Sky Survey (SDSS; York et al., 2000) have revealed that satellite galaxies are preferentially distributed along the major axis of the central galaxies (Brainerd, 2005; Yang et al., 2006; Azzaro et al., 2007; Faltenbacher et al., 2007, 2009), and tend to be preferentially oriented toward the central galaxy (Pereira & Kuhn, 2005; Agustsson & Brainerd, 2006; Faltenbacher et al., 2007). These studies were mostly limited to the local universe and intermediate-to-small scales (less than a few tens of Mpc). Similar alignment signals have been detected for galaxies at intermediate redshifts (; Donoso et al., 2006; Okumura et al., 2009). In a recent study Smargon et al. (2012) reported on the detection of intrinsic alignment between clusters of galaxies at out to 100 Mpc in the SDSS cluster catalogs. There have also been many observational studies which include galaxy ellipticity and measure both the galaxy orientation-density correlation and the intrinsic shear-density correlation (e.g. Mandelbaum et al., 2006; Hirata et al., 2007; Blazek et al., 2011; Joachimi et al., 2011), in order to better understand the potential contamination of galaxy alignment to cosmic shear surveys.
The various forms of the alignment of galaxies and clusters are generally expected in the cold dark matter cosmological paradigm in which galaxies are hosted by dark matter halos and are embedded in a cosmic web containing a varity of structures. The shapes of halos (and galaxies) are predicted to be aligned with each other due to the large-scale tidal field and the preferred accretion of matter along filaments (Pen et al., 2000; Croft & Metzler, 2000; Heavens et al., 2000; Catelan et al., 2001; Crittenden et al., 2001; Jing, 2002; Porciani et al., 2002). Therefore, measuring the alignment of galaxies/clusters, as function of redshift, spatial scale and galaxy properties, is expected to provide useful constraints on both galaxy formation and structure formation models.
In this work we extend the effort of detecting galaxy alignment to higher redshifts () and larger scales (Mpc). For this we use the recently-released CMASS galaxy sample from the ninth data release (DR9; Ahn et al., 2012) of the Baryon Oscillation Spectroscopic Survey (BOSS; Schlegel et al., 2009; Dawson et al., 2013), which is a part of the SDSS-III (Eisenstein et al., 2011). We apply two different statistics suitable for quantifying the spatial alignment of galaxies to the CMASS sample, and show that the alignment between the orientation of the CMASS galaxies and the large-scale galaxy distribution extends out to Mpc. Applying the same statistics to dark matter halos in a large cosmological simulation, we detect similar alignment signals for the halos. This indicates that the observed large-scale alignment of galaxies can be explained by the anisotropy in the large-scale matter distribution, as we have recently found from a theoretical analysis of dark matter halos (Faltenbacher et al., 2012).
2. Methodology
We use two different statistics to quantify the alignment between the orientation of galaxies and their large-scale spatial distribution: the alignment correlation function (ACF) and the statistic, which were originally introduced in Faltenbacher et al. (2009). Here we briefly describe the statistics and refer the reader to that paper for details.
2.1. Alignment correlation function
The ACF extends the conventional two-point correlation function (2PCF) by including the angle between the major axis of a galaxy and the line connecting to another galaxy (, projected on the sky for a survey sample) as an additional property of galaxy pairs. For a pair of galaxies with one member in the sample in question (called Sample Q hereafter) and another member in the reference sample (called Sample G hereafter), we consider as a secondary property of the pair, in addition to the separation of the paired galaxies. The estimator for the conventional 2PCF is then easily modified to give a measure of the ACF:
| (1) |
where is the redshift-space pair separation, and are the number of galaxies in the reference and random samples. and are the counts of cross pairs between the given samples for given and . The value of ranges from zero (parallel to the major axis of the main galaxy) to 90 degrees (perpenticular). Thus, higher amplitudes of at small (large) indicate the galaxies in G are preferentially aligned along the major (minor) axis of the galaxies in Q. Sample Q is either the same as, or a subset of Sample G. In the former case the ACF is actually the alignment auto-correlation function, thus probing the alignment between galaxies within the same sample.
2.2. The statistic
The statistic measures the average value of over all correlated pairs for a given spatial separation. This statistic is related to the ACF by
| (2) |
and estimated by
| (3) |
where is the sum of for all the cross pairs between samples and at separation :
| (4) |
The statistic so-defined ranges between -1 and 1, with positive and negative values indicating a preference for small () and large () angles. Values of zero means isotropy.
3. Data
3.1. The BOSS/CMASS galaxy sample
By selection the CMASS is a roughly volume-limited sample of massive galaxies in the redshift range of (Eisenstein et al., 2011; Anderson et al., 2012). Clustering measurements and halo occupation distribution modeling (White et al., 2011) revealed that the CMASS galaxies are hosted by dark matter halos with mass above , with the majority () being central galaxies in halos of mass . The CMASS galaxy sample from BOSS/DR9 and the corresponding random sample suitable for large-scale structure analyses are generated by Anderson et al. (2012), and are publicly available at the SDSS-III website111http://data.sdss3.org/datamodel/fiels/BOSS_LSS_REDUX/. For this work we restrict ourselves to the survey area in the northern Galactic cap, including a total number of 207,246 galaxies. We exclude the sourthern Galactic cap from our analysis in order to avoid possible effects of the systematic differences between the northern and southern parts as found in recent BOSS-based studies (e.g. Sánchez et al., 2012). The orientation of the galaxies is given by the position angle (PA) of the major axis of their -band images, determined from the de Vaucouleurs model fit by the SDSS photometric pipeline Photo(Lupton et al., 2001; Stoughton et al., 2002).
3.2. The MultiDark Run 1 Simulation
In addition to analyzing the CMASS galaxy sample, we also apply our alignment statistics to dark matter halos in the MultiDark Run 1 simulation (MDR1; Prada et al., 2012) 222http://www.multidark.org/MultiDark/. Assuming the WMAP7 concordant CDM cosmology, the simulation uses particles to follow the dark matter distribution in a cubic region with 1 Gpc on a side, which corresponds to a particle mass of . Dark matter halos are identified by means of a friends-of-friends (Davis et al., 1985) algorithm with a linking length of 0.17 times the mean particle separation. For the comparison with the CMASS galaxy sample we use snapshot 60 which corresponds to a redshift of .
Following Joachimi et al. (2013) we determine the projected orientations of the dark matter halos based on the 3D mass ellipsoids which are provided in the Multidark database. For this approach the line of sight is assumed to be parallel to the -axis. We limit our analysis to dark matter halos with masses above , i.e., the aforementioned lower limit of the host halo mass for CMASS galaxies as found by White et al. (2011). Halos of this mass are identified with a number of 115 particles. In this case an uncertainty of 10% is expected for the halo orientation determination (Bett et al., 2007; Joachimi et al., 2013), which we expect not to introduce significant bias into our result in the next section.
4. Results

We have obtained the alignment correlation function from the CMASS galaxy sample for three successive angular intervals: , , and , as well as the conventional two-point correlation function, , which is a function of only the redshift-space separation and can be regarded as an average of the alignment correlation function over the full range of .
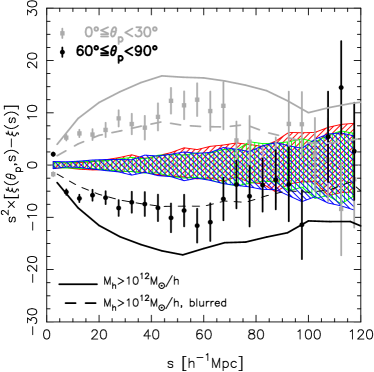
In Figure 1 (left panel) we plot the difference in the alignment correlation function at small/large angles with respect to the conventional correlation function . The error bars plotted in the figure and in what follows are estimated using the bootstrap resampling technique (Barrow et al., 1984). We have constructed 100 bootstrap samples based on the real sample, and we estimate the difference between and for each sample. The error at given scale is then estimated from the variance between the bootstrap samples.
As can be seen, differ from at both small and large angles, with stronger clustering at smaller angles and weaker clustering at larger angles, consistent with the picture that the major axis of the galaxies is preferentially aligned with their spatial distribution.
It is essential to perform systematics tests on any clustering measurements (e.g. Mandelbaum et al., 2005; Sanchez et al., 2012). As one of such tests, we have repeated the same analysis as above for a set of 100 random samples in which the position angles are shuffled at random among the main galaxies (Sample Q). The hatched regions plotted in red/green/blue in Figure 1 show the variance of the alignment correlation function between the random samples, measured for the three angle bins separately. It is interesting that the alignment signal detected in the real sample is significantly seen for a wide range of scales, from the smallest scales probed (Mpc) out to Mpc according to both the bootstrap errors of the measurements and the regions of the random samples.
The right-hand panel of Figure 1 shows the statistic, plotted in solid circles for the CMASS sample and in green hatched region for the 100 randomly shuffled samples. The statistic for the real sample shows positive values on all scales probed, while its difference from the random samples is significantly seen only for scales below Mpc, consistent with what the left-hand panel reveals. As mentioned above, a positive value in the statistic indicates a preference for angles smaller than , thus implying that the major axis of the galaxies tends to be aligned with the large-scale distribution of galaxies. The statistic of the random samples shows a systematic positive bias at scales above Mpc, implying that the position angle of the CMASS galaxies is not randomly distributed on the sky, a cosmic variance effect due to the limited survey area and probably also the quite irregular shape of the survey geometry. This can be tested in future with mock catalogs or later data releases of the BOSS survey.
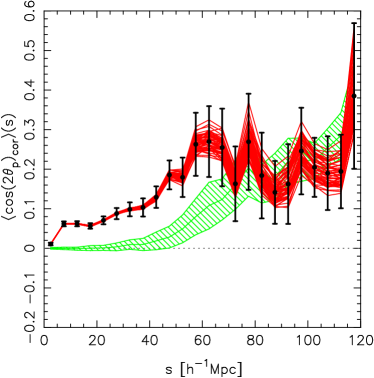

For comparison the same statistics obtained for dark matter halos of mass in the MDR1 simulation are shown in Figure 1 as solid lines. Alignment signal is seen in both statistics and on all the scales up to 120 Mpc. Both statistics show strong dependence on the spatial scale, which is very similar to what is seen for the CMASS galaxies. At fixed scale, however, the alignment of the halos is systematically stronger than that of the galaxies. This discrepancy might be partially (if not totally) due to the misalignment between the orientation of central galaxies and that of their host halos. A previous study done by Okumura et al. (2009) on the alignment of luminous red galaxies (LRGs) at in the SDSS/DR6 suggested that the misalignment angle between a central LRG and its host halo follows a Gaussian distribution with a zero mean and a typical width deg (see also Faltenbacher et al., 2009). Such misalignment is expected to smooth out the alignment to some extent, leading the alignment of galaxies to be weaker than that of their host halos. Those authors found no evidence for the redshift evolution of their results. Thus, it is likely that a similar misalignment occurs also at the redshift of the CMASS sample.
To test the effect of such misalignment on our statistics, we artificially assign misalignment to the orientation of the dark matter halo before the alignment statistics are measured, assuming a Gaussian distribution with for the misalignment angle. The results are plotted as dashed lines in Figure 1. As expected, the amplitude of both statistics decreases considerably, becoming comparable with the data on scales below Mpc. This simple experiment implies that the observed large-scale alignment signal for the massive galaxies at is real and can be explained by the alignment between dark matter halos and the large-scale matter distribution after the misalignment between the galaxies and their halos has been considered properly.
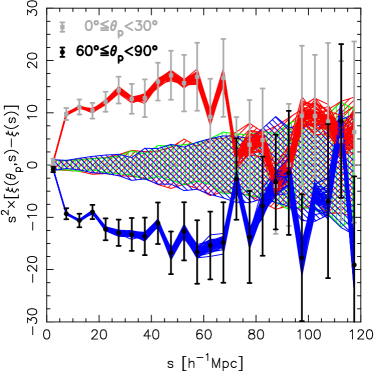
In order to test whether the uncertainties in the position angle measurements of the CMASS galaxies can introduce any systematic errors, we have repeated the analysis for a subset of galaxies with the weight of the de Vaucouleurs model component fracDev, the de Vaucouleurs model scale radius , and ellipticity . The results are shown in Figure 2, with the grey/black symbols for the real sample and the hatched regions for the randomly shuffled samples. In addition, we have constructed 51 jacknife samples by dividing the CMASS/North area into 51 non-overlapping subregions and dropping one of the subregions from each of the 51 samples. The results of these samples are plotted in the red/blue lines in the same figure. These tests demonstrate that the alignment signal is reliably detected in the CMASS sample, at least to Mpc, and is robust to the position angle measurements and the statistical error estimation.
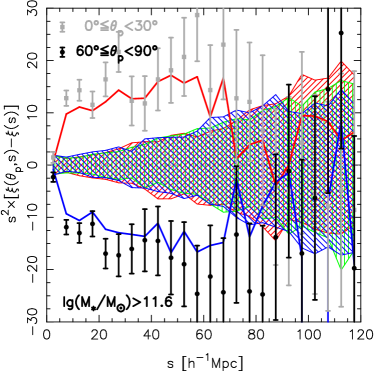
Finally, we focus on the CMASS galaxies and examine the dependence of the alignment statistics on the stellar mass of the galaxies. For this we take the stellar mass esimates from the Wisconsin group 333http://www.sdss3.org/dr9/algorithms/galaxy_wisconsin.php derived by Chen et al. (2012) from a BOSS spectrum principal component analysis (PCA) using the stellar population models of Bruzual & Charlot (2003). We divide the CMASS galaxies into two subsamples, with stellar mass either below or above . We take each of the subsamples as Sample Q, and we measure the alignment cross-correlation function with respect to the full CMASS galaxy sample (Sample G) in the same way as above. The results are shown in Figure 3, with the two panels for the two subsamples separately. The result of the full sample is repeated in both panels as red/blue solid lines, for reference. Both subsamples show systematic differences from the full sample, in the sense that the high-mass subsample shows stronger-than-average alignment signals and the low-mass subsample shows weaker-than-average signals.
5. Summary
We have applied two statistics, that are defined to be suitable for quantifying the spatial alignment of galaxies, to the CMASS galaxy sample from the SDSS-III/BOSS DR9, which consist of about massive galaxies with mass above and redshift in the range . Both statistics have revealed significant alignment, out to Mpc, between the major axis of the CMASS galaxies and the large-scale distribution of the galaxies in the same sample. In addition, we have also detected a systematic trend of the alignment with the stellar mass of the galaxies, in the sense that more massive galaxies are more strongly aligned with the large-scale structure.
We have applied the same statistics to dark matter halos with mass above in the MultiDark Run 1 (MDR1) simulation, and obtained very similar alignment sginals to what we have seen for the CMASS galaxies. This is consistent with previous studies of halo occupation distribution models on the CMASS sample which indicated that the majority of the CMASS galaxies are central galaxies in halos of mass . Furthermore, to test whether and how the possible misalignment between galaxies and host halos may affect our results for dark matter halos, we have performed a simple experiment in which we artifically asign a misalignment to the orientation of the halos, assuming a Gaussian distribution function for the misalignment angle with a width of 35 degrees. With such misalignment being included, the alignment statistics for the halos become substantially weaker, thus agreeing better with the observational results from the CMASS. This suggests that the large-scale alignment detected in the BOSS data is physically real and can be explained by the large-scale alignment of dark matter halos with respect to the matter distribution, as recently found by Faltenbacher et al. (2012) from cosmological simulations (also see a follow-up work by Pápai & Sheth 2013 who developed a theoretical model to explain this finding). Detailed modeling of the observed alignment statistics should be able to provide powerful constraints on many aspects in both galaxy formation and structure formation theories, and would need to include a number of effects that are not considered in this work, including the contamination of satellite galaxies in the CMASS sample and the too simple mass cut in the dark matter halo sample. We will come back to this point in next studies.
References
- Agustsson & Brainerd (2006) Agustsson, I., & Brainerd, T. G. 2006, ApJ, 644, L25
- Ahn et al. (2012) Ahn, C. P., Alexandroff, R., Allende Prieto, C., et al. 2012, ApJS, 203, 21
- Anderson et al. (2012) Anderson, L., Aubourg, E., Bailey, S., et al. 2012, MNRAS, 427, 3435
- Azzaro et al. (2007) Azzaro, M., Patiri, S. G., Prada, F., & Zentner, A. R. 2007, MNRAS, 376, L43
- Barrow et al. (1984) Barrow, J. D., Bhavsar, S. P., & Sonoda, D. H. 1984, MNRAS, 210, 19P
- Bett et al. (2007) Bett, P., Eke, V., Frenk, C. S., et al. 2007, MNRAS, 376, 215
- Binggeli (1982) Binggeli, B. 1982, A&A, 107, 338
- Blazek et al. (2011) Blazek, J., McQuinn, M., & Seljak, U. 2011, JCAP, 5, 10
- Brainerd (2005) Brainerd, T. G. 2005, ApJ, 628, L101
- Bruzual & Charlot (2003) Bruzual, G., & Charlot, S. 2003, MNRAS, 344, 1000
- Carter & Metcalfe (1980) Carter, D., & Metcalfe, N. 1980, MNRAS, 191, 325
- Catelan et al. (2001) Catelan, P., Kamionkowski, M., & Blandford, R. D. 2001, MNRAS, 320, L7
- Chen et al. (2012) Chen, Y.-M., Kauffmann, G., Tremonti, C. A., et al. 2012, MNRAS, 421, 314
- Crittenden et al. (2001) Crittenden, R. G., Natarajan, P., Pen, U.-L., & Theuns, T. 2001, ApJ, 559, 552
- Croft & Metzler (2000) Croft, R. A. C., & Metzler, C. A. 2000, ApJ, 545, 561
- Davis et al. (1985) Davis, M., Efstathiou, G., Frenk, C. S., & White, S. D. M. 1985, ApJ, 292, 371
- Dawson et al. (2013) Dawson, K. S., Schlegel, D. J., Ahn, C. P., et al. 2013, AJ, 145, 10
- Dekel (1985) Dekel, A. 1985, ApJ, 298, 461
- Donoso et al. (2006) Donoso, E., O’Mill, A., & Lambas, D. G. 2006, MNRAS, 369, 479
- Eisenstein et al. (2011) Eisenstein, D. J., Weinberg, D. H., Agol, E., et al. 2011, AJ, 142, 72
- Faltenbacher et al. (2007) Faltenbacher, A., Li, C., Mao, S., et al. 2007, ApJ, 662, L71
- Faltenbacher et al. (2012) Faltenbacher, A., Li, C., & Wang, J. 2012, ApJ, 751, L2
- Faltenbacher et al. (2009) Faltenbacher, A., Li, C., White, S. D. M., et al. 2009, Research in Astronomy and Astrophysics, 9, 41
- Hashimoto et al. (2008) Hashimoto, Y., Henry, J. P., & Boehringer, H. 2008, MNRAS, 390, 1562
- Heavens et al. (2000) Heavens, A., Refregier, A., & Heymans, C. 2000, MNRAS, 319, 649
- Hirata et al. (2007) Hirata, C. M., Mandelbaum, R., Ishak, M., et al. 2007, MNRAS, 381, 1197
- Jing (2002) Jing, Y. P. 2002, MNRAS, 335, L89
- Joachimi et al. (2011) Joachimi, B., Mandelbaum, R., Abdalla, F. B., & Bridle, S. L. 2011, A&A, 527, A26
- Joachimi et al. (2013) Joachimi, B., Semboloni, E., Bett, P. E., et al. 2013, MNRAS, 431, 477
- Lupton et al. (2001) Lupton, R., Gunn, J. E., Ivezić, Z., et al. 2001, in Astronomical Data Analysis Software and Systems X, ed. F. R. Harnden, Jr., F. A. Primini, & H. Payne, Vol. 238, 269
- Mandelbaum et al. (2005) Mandelbaum, R., Hirata, C. M., Seljak, U., et al. 2005, MNRAS, 361, 1287
- Mandelbaum et al. (2006) Mandelbaum, R., Seljak, U., Cool, R. J., et al. 2006, MNRAS, 372, 758
- Okumura et al. (2009) Okumura, T., Jing, Y. P., & Li, C. 2009, ApJ, 694, 214
- Pápai & Sheth (2013) Pápai, P., & Sheth, R. K. 2013, MNRAS, 429, 1133
- Pen et al. (2000) Pen, U.-L., Lee, J., & Seljak, U. 2000, ApJ, 543, L107
- Pereira & Kuhn (2005) Pereira, M. J., & Kuhn, J. R. 2005, ApJ, 627, L21
- Plionis (1994) Plionis, M. 1994, ApJS, 95, 401
- Plionis et al. (2003) Plionis, M., Benoist, C., Maurogordato, S., Ferrari, C., & Basilakos, S. 2003, ApJ, 594, 144
- Porciani et al. (2002) Porciani, C., Dekel, A., & Hoffman, Y. 2002, MNRAS, 332, 325
- Prada et al. (2012) Prada, F., Klypin, A. A., Cuesta, A. J., Betancort-Rijo, J. E., & Primack, J. 2012, MNRAS, 423, 3018
- Sánchez et al. (2012) Sánchez, A. G., Scóccola, C. G., Ross, A. J., et al. 2012, MNRAS, 425, 415
- Sanchez et al. (2012) Sanchez, E., Alonso, D., Sanchez, F. J., Garcia-Bellido, J., & Sevilla, I. 2012, ArXiv e-prints, arXiv:1210.6446
- Schlegel et al. (2009) Schlegel, D., White, M., & Eisenstein, D. 2009, in astro2010: The Astronomy and Astrophysics Decadal Survey, Vol. 2010, 314
- Smargon et al. (2012) Smargon, A., Mandelbaum, R., Bahcall, N., & Niederste-Ostholt, M. 2012, MNRAS, 423, 856
- Stoughton et al. (2002) Stoughton, C., Lupton, R. H., Bernardi, M., et al. 2002, AJ, 123, 485
- Struble (1990) Struble, M. F. 1990, AJ, 99, 743
- West (1989) West, M. J. 1989, ApJ, 347, 610
- White et al. (2011) White, M., Blanton, M., Bolton, A., et al. 2011, ApJ, 728, 126
- Yang et al. (2006) Yang, X., van den Bosch, F. C., Mo, H. J., et al. 2006, MNRAS, 369, 1293
- York et al. (2000) York, D. G., Adelman, J., Anderson, Jr., J. E., et al. 2000, AJ, 120, 1579