The mass and radius of the M-dwarf companion in the double-lined eclipsing binary T-Cyg1-01385
Abstract
We observed spectroscopically the eclipsing binary system T-Cyg1-01385 in order to determine physical properties of the components. The double-lined nature of the system is revealed for the first time and the radial velocities are obtained for both stars. We have derived masses, radii and luminosities for both components. Analyses of the radial velocities and the KeplerCam and the TES light curves yielded masses of M1=1.0590.032 and M2=0.3420.017 and radii of R1=1.9890.022 and R2=0.4570.013 . Locations of the low-mass companion in the mass-radius and mass-effective temperature planes and comparison with the other low-mass stars show that the secondary star appears just at the transition from partially to fully convective interiors for the M dwarfs. When compared to stellar evolution models, the luminosities and effective temperatures of the components are consistent with Z=0.004 and an age of about 6 Gyr. A distance to the system was calculated as d=3557 pc using the BV and JHK magnitudes.
keywords:
binaries; eclipsing - stars: fundamental parameters; individual — method: spectroscopy1 Introduction
The lower-mass stars of the main-sequence of the Hertzsprung-Russell diagram are known as M-dwarfs. They constitute the majority of stars in the solar neighbourhood. They are intrinsically faint since they are cooler and smaller than the other stars . Because of their faintness photometric and spectroscopic observations could be obtained for a limited number M-dwarfs. Chabrier (2003) suggests that at least 70 per cent of all stars in the sphere with a radius of 10 pc about the Sun are M-dwarfs. Therefore, detailed studies of these faint but numerous low-mass stars are critical importance to evaluate a model of the galactic evolution and present status. Moreover the M-dwarfs are particularly needed in the understanding of evolution of main-sequence stars towards the lower-mass regime. The evolutionary calculations of low-mass stars allow us to define not only the transition from partly to fully convection but also to define a limit between stars and brown dwarfs. As pointed out by Shulyak et al. (2011) around spectral type M3.5 stars become fully convective and thus the dynamo mechanism must be different in cooler stars because they do not posses tachocline layer with strong differential rotation. However, Reiners & Basri (2007) have concluded from the measurements of Stokes parameter about tens of stars spanning the whole M-dwarfs that no significant change in the average magnetic field strengths occurs when stars become fully convective. Later on Reiners, Basri,& Browning (2009) could reveal the rotation- magnetic field relation in which magnetic field strengths increase towards short rotation periods.
Low-mass M-dwarfs are generally faint objects because of their small radii and low temperatures. Due to their faintness the M-dwarfs have limited the number of high-resolution, high signal-to-noise spectroscopic studies. In addition, the optical spectrum of these cool stars is mostly covered by molecular bands which hide and blend the atomic lines used in spectral analysis. These dominant molecular bands make it difficult to measure the atomic line strengths which are needed for metallicity determination. The physical parameters, such as mass, radius and luminosity as well as age and rotational period could only be derived if a M-dwarf is a member of a close binary or a multiple system. In a binary or a multiple system the components are most likely coeval and their spin axes are perpendicular to the orbital plane.
Numerous photometric observations of binary stars were recently gathered by the surveys of like the TES (Alonso et al., 1996), NSVS (Wozniak et al., 2004), SuperWASP (Christian et al., 2006), Kepler (Borucki, Koch, & Kepler Science Team, 2010), etc. Despite the main aim of these surveys is to search gamma-ray bursters, and especially extra-solar planetary transits many binary systems are discovered and light curves of many systems could be obtained. Therefore, the tremendous photometric datasets containing unknown or little known binary systems are presented for the use of astronomers.
Light variability of T-Cyg1-01385 was announced by Devor (2008) and Devor et al. (2008) in the list of 773 eclipsing binaries found in the Trans-Atlantic Exoplanet Survey. It was classified as an ”ambiguous” binary in their list. Mass and radius of the components were estimated for the first time by Fernandez et al. (2009) combining the spectroscopic orbital elements obtained from the primary star’s radial velocities with a high-precision transit light curve obtained by the KeplerCam. The results obtained up-to-date point out that the fainter component of T-Cyg1-01385 is so close to the fully convective M-dwarfs. Therefore we planned new spectroscopic observations of the system to refine the masses, radii and effective temperatures of both stars.
| Source Catalog | Parameter | Value |
|---|---|---|
| 2MASSa | (J2000) | 20h15m 21.94s |
| 2MASS | (J2000) | +4817′14.14′′ |
| PPMXb | mag | 10.92 0.08 |
| GSC2.3c | mag | 11.68 0.08 |
| GSC2.3 | mag | 11.02 0.07 |
| TYCHOd | mag | 11.68 0.08 |
| TYCHO | mag | 11.02 0.07 |
| 2MASS | mag | 9.834 0.026 |
| 2MASS | mag | 9.593 0.031 |
| 2MASS | mag | 9.513 0.021 |
| NOMADe | mag | 11.520 0.118 |
| NOMAD | mag | 10.956 0.121 |
| NOMAD | mag | 10.580 0.150 |
| CMC14f | mag | 10.892 0.185 |
| ASCC-2.5V3g | mag | 11.565 0.093 |
| ASCC-2.5V3 | mag | 10.920 0.082 |
| ACT2000.2h | mag | 11.680 0.013 |
| ACT2000.2 | mag | 11.016 0.091 |
| TASS Mark IVi | mag | 11.103 0.065 |
| TASS Mark IV | mag | 10.363 0.049 |
| UCAC4j | mag | 11.7410.011 |
| UCAC4 | mag | 10.9970.010 |
| 2MASS | Identification | 2MASS20152193+4817141 |
| UCAC4 | Identification | 692-074290 |
| TASS Mark IV | Identification | 1937252 |
| TYCHO | Identification | TYC3576-2035-1 |
| GSC2.3 | Identification | GSC 03576 02035 |
| USNO-B1.0 | Identification | 1382-0386191 |
| PPMX | Identification | 201521.9+481714 |
| TESk | Identification | T-Cyg1-01385 |
| SB9 l | Identification | 3018 |
| SWASP m | Identification | 1SWASP J201521.94+481714.1 |
| UCAC4 | , () | -9.20.6, -22.41.2 |
| TYCHO | , () | -8.43.6, -23.43.1 |
| ASCC-2.5V3 | , () | -8.772.92, -20.372.51 |
| USNO-B1.0 | , () | -101, -201 |
| PPMX | , () | -7.81.6, -19.51.8 |
a2MASS Two Micron All Sky Survey Catalog (Skrutskie et al., 2006), bPPMX Position and Proper Motions Catalog, (Röser et al., 2008), cGSC2.3 Guide Star Catalog, version 2.3.2 (Morrison et al., 1999), dTYCHO Tycho Catalog, (Perryman & ESA, 1997), eNOMAD NOMAD Catalog, (Zacharias et al., 2005), fCMC14 Carlsberg Meridian Catalog 14 (Copenhagen University et al., 2006), gASCC-2.5V3 All-Sky Compiled Catalog of 2.5 Millon Stars, (Kharchenko & Roeser, 2009), hACT Astrographic Catalog, (Urban, Corbin, & Wycoff, 1997), iTASS The Amateur Sky Survey (TASS) Catalog, (Droege et al., 2006), jUCAC High density, Highly Accurate, Astrometric Catalog, (Urban et al., 2004), kTES Trans Eclipsing Binary Catalog, (Devor et al., 2008), lSB 9th Catalog of Spectroscopic Binary Orbits, (Pourbaix et al., 2009). mSuperWASP (Christian et al., 2006) .
2 Period determination
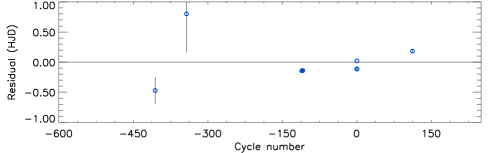
The catalog information for T-Cyg1-01385 was given in Table 1. First we collected the times for mid-light minimum obtained by various automatic and robotized telescopes and surveys. These times of minima are given in Table 2 as averaged for the filters used. A linear least-squares fit to the data yields the following ephemeris
where the bracketed quantity is the uncertainty in the last digit(s) of the preceding number. All uncertainties quoted in this work are standard errors. The residuals of the fit are plotted in Fig. 1 and show no indication of any form of period change in about ten years.
| Minimum time | Cycle number | O-C | Ref. |
|---|---|---|---|
| (HJD-2 400 000) | |||
| 51263.5000 | -406.0 | 0.0983 | 1 |
| 53198.6330 | -111.0 | -0.0041 | 2 |
| 53205.1940 | -110.0 | -0.0032 | 2 |
| 53208.4730 | -109.5 | -0.0043 | 2 |
| 53211.7550 | -109.0 | -0.0023 | 2 |
| 53926.6737 | 0.0 | -0.1367 | 3 |
| 53926.6743 | 0.0 | -0.1361 | 3 |
| 53926.6755 | 0.0 | -0.1349 | 3 |
| 53926.6761 | 0.0 | -0.1343 | 3 |
| 53926.8104 | 0.0 | 0.0000 | 3 |
| 54661.5413 | 112.0 | -0.00126 | 4 |
3 Echelle Spectroscopy
Optical spectroscopic observations of the T-Cyg1-01385 were obtained with the RTT150111http://tug.tug.tubitak.gov.tr/rtt150_tfosc.php 1.5 m telescope at TUG222TÜBİTAK National Observatory (Turkey) using the 7 000 Echelle spectrograph that covers 400 nm 900 nm. These observations were used to resolve the components of T-Cyg1-01385 and get individual radial velocity measurements for each star in the system. Eleven spectra were obtained using 60 minute integrations on 8 nights in July, 2010 with typical signal-to-noise ratios of 120 at 6563 Å.
The spectra were processed in the standard way for cross-dispersed Echelle spectra, using fxcor package in IRAF. The routine processes the data using biases and halogen lamp observations taken at the beginning of the night, median combines three individual images while performing cosmic ray rejection, extracts the individual orders from the combined image and performs the wavelength solution on each order using a FeAr arc lamp taken either before or after each set of science exposures.
A total of 11 orders are used each night to derive radial velocities via cross-correlation with a standard template. We use the bright Psc (F7 V) and 50 Ser (F0 V) as the heliocentric radial velocity standard stars. Each spectral order is cross-correlated separately, then an iterative 3- clipping is performed prior to performing a weighted average to obtain a final radial velocity measurement for each night. The components are identified each night via the peak and width of each feature in the cross correlated functions. The typical radial velocity precisions ranged from 2 to 13 for the various components.
3.1 Radial velocities
To derive the radial velocities, the eleven spectra obtained for the system are cross-correlated against the template spectra of standard stars on an order-by-order basis using the fxcor package in IRAF (Simkin, 1974).
The majority of the spectra showed two distinct cross-correlation peaks in the quadratures, one for each component of the binary. Thus, both peaks are fitted independently with a profile to measure the velocities and their errors for the individual components. If the two peaks appear blended, a double Gaussian was applied to the combined profile using de-blend function in the task. For each of the eleven observations we then determined a weighted-average radial velocity for each star from all orders without significant contamination by telluric absorption features. Here we used as weights the inverse of the variance of the radial velocity measurements in each order, as reported by fxcor.
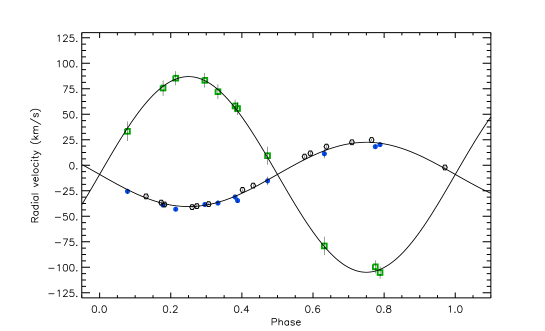
The heliocentric radial velocities for the primary (Vp) and the secondary (Vs) components are listed in Table 3 , along with the dates of observations and the corresponding orbital phases computed with the new ephemeris given in the previous section. The velocities in this table have been corrected to the heliocentric reference system by adopting a radial velocity value for the template stars. The radial velocities are plotted against the orbital phase in Fig. 2. The radial velocities of the more massive star measured by Fernandez et al. (2009) are also plotted as circles in the same figure. There is no systematic difference between the measurements.
We analysed the radial velocities for the initial orbital parameters using the RVSIM software program (Kane, Schneider, & Ge, 2007). Figure 2 shows the best-fit orbital solution to the radial velocity data. The results of the analysis are as follow: = -91 km s-1, =313 and =964 km s-1with circular orbit. Using these values we estimate the projected orbital semi-major axis and mass ratio as: sin=16.460.18 and =0.3230.020.
| HJD 2400000+ | Phase | Star 1 | Star 2 | ||
|---|---|---|---|---|---|
| 55390.5404 | 0.1783 | -39.1 | 1.6 | 75.6 | 7.5 |
| 55391.3117 | 0.2959 | -38.5 | 1.8 | 83.3 | 7.1 |
| 55391.5538 | 0.3328 | -37.1 | 2.3 | 72.1 | 7.2 |
| 55392.4691 | 0.4723 | -15.3 | 4.1 | 9.3 | 8.8 |
| 55393.5155 | 0.6319 | 11.3 | 4.4 | -79.1 | 9.0 |
| 55394.4550 | 0.7751 | 18.2 | 1.6 | -99.6 | 6.4 |
| 55394.5423 | 0.7884 | 20.2 | 1.8 | -105.2 | 5.9 |
| 55396.4442 | 0.0784 | -25.6 | 2.7 | 32.3 | 13.5 |
| 55397.3337 | 0.2140 | -43.1 | 1.5 | 85.4 | 6.9 |
| 55398.4284 | 0.3810 | -31.1 | 2.2 | 58.1 | 6.1 |
| 55398.4746 | 0.3880 | -34.7 | 2.2 | 55.6 | 6.3 |
4 Light curves and their analyses
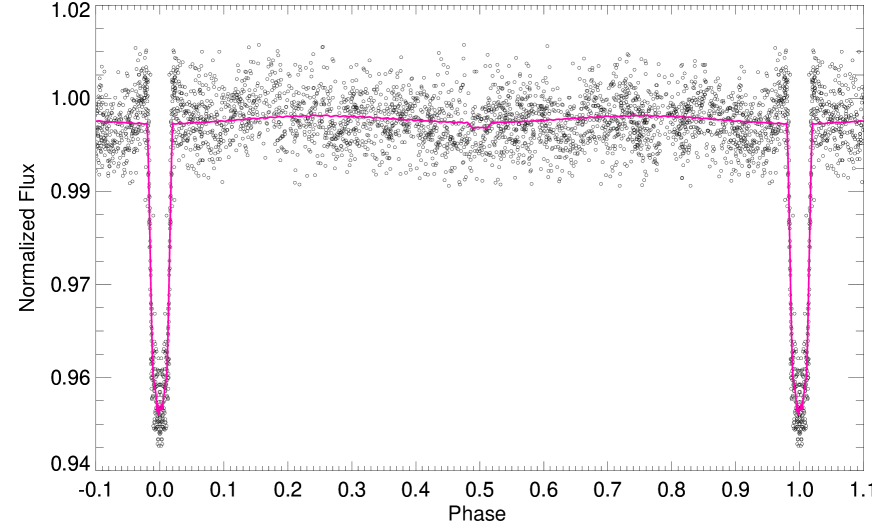
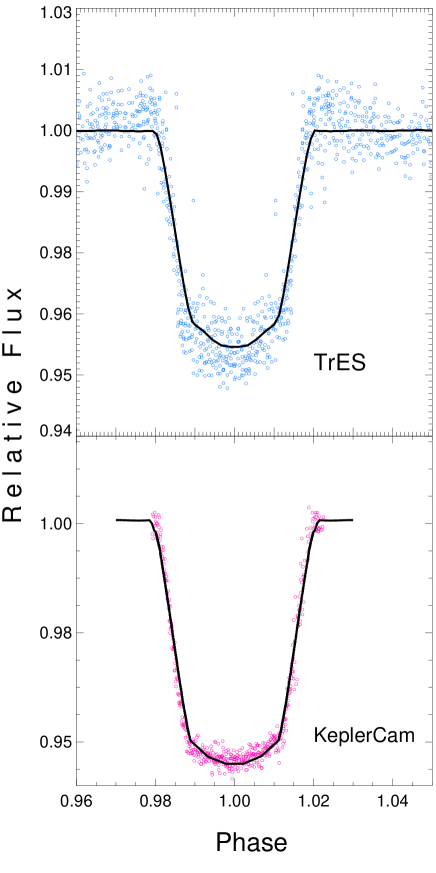
Photometric observations of T-cyg1-01385 were obtained by automatic and robotised telescopes. The first complete light curve was obtained by the TES wide-angle transiting planet survey (Alonso et al., 1996). Additional photometric data, especially in the primary eclipse, were obtained by the NSVS (Wozniak et al., 2004), SuperWASP (Christian et al., 2006), and Cam(Borucki, Koch, & Kepler Science Team, 2010). Since the data gathered by the SuperWASP have too large scatters we do not include them into the analysis for the orbital parameters. In Fig. 3 we plotted the TES data against orbital phase. The observations obtained by the TES and the Cam within the primary eclipse are shown in Fig.4.
We may constrain the effective temperature and spectral type of the primary star using the BT, VT, J, H, and K magnitudes which are already given in Table 1. We have derived V=10.96, B-V=0.56, J-H=0.241 and H-K=0.08 mag. Comparing the color indices with color-spectral type calibrations given by Drilling & Landolt (2000) and Tokunaga (2000) we estimated a spectral type of F8 sub-giant for the primary star. Thus, an effective temperature of K and a color excess of 0.04 mag are estimated.
We used the most recent version of the eclipsing binary light curve modeling algorithm of Wilson & Devinney (1971), as implemented in the phoebe code of Prša & Zwitter (2005). In order to obtain the physical parameters of the component stars we, first analysed the TES data. The code needs some input parameters, which depend upon the physical structures of the component stars. The values of these parameters can be estimated from global stellar properties. Therefore, we adopted the linear limb-darkening coefficients from van Hamme (1993), the bolometric albedos from Lucy (1967) and the gravity brightening coefficients as 0.32 for both components. The rotational velocities of the components are assumed to be synchronous with the orbital one.
The adjustable parameters in the light curves fitting were the orbital inclination, the surface potentials of the two stars, the effective temperature of the secondary, and the color-dependent luminosity of the hotter star, the zero-epoch offset, semi-major axis of the orbit, the mass-ratio and the systemic velocity. A detached configuration (Mode 2) with coupling between luminosity and temperature was used for solution. The iterations were carried out automatically until convergence, and a solution was defined as the set of parameters for which the differential corrections were smaller than the probable errors. Our final results are listed in Table 4. The uncertainties assigned to the adjusted parameters are the internal errors provided directly by the code. The computed light curve corresponding to the simultaneous light-velocity solution is compared with the observations in the Fig. 3 and 4.
| Parameters | Adopted |
|---|---|
| 86.40.02 | |
| T (K) | 6 250[Fix] |
| T (K) | 2 940120 |
| 8.6090.023 | |
| 12.9890.030 | |
| 0.12060.0003 | |
| 0.02720.0001 | |
| (TES-r) | 0.99930.0005 |
| (-z) | 0.99960.0004 |
| 0.051 |
The fundamental stellar parameters for the components such as masses, radii, luminosities were calculated and listed in Table 5 together with their formal standard deviations. The standard deviations of the parameters have been determined by JKTABSDIM333This can be obtained from http://http://www.astro.keele.ac.uk/jkt/codes.html code, which calculates distance and other physical parameters using several different sources of bolometric corrections (Southworth et al., 2005). The mass for the primary of = 1.06 0.03M ⊙ and secondary of = 0.34 0.02M⊙ are consisting of an evolved late F-star and mid M-dwarf (Drilling & Landolt, 2000).
| Parameter | Primary | Secondary |
|---|---|---|
| Spectral Type | F8(2)IV-V | M4(1)V |
| (R⊙) | 16.490.18 | |
| (km s-1) | -91 | |
| (∘) | 86.360.02 | |
| 0.3230.020 | ||
| Mass (M⊙) | 1.0590.032 | 0.3420.017 |
| Radius (R⊙) | 1.9890.022 | 0.4570.013 |
| (K) | 6 250100 | 2 940120 |
| 0.7360.035 | 2.0390.083 | |
| () | 3.8660.005 | 4.6520.026 |
| (km s-1) | 151 | 41 |
| (pc) | 3557 | |
There is no measured trigonometric parallax available for the system. From the B- and V-passband measurements of Tycho and the JHK magnitudes given in the 2MASS catalog we estimated an interstellar reddening of mag. Then we estimated an average distance to the system as 3557 pc.
5 Comparison with models and other low-mass stars
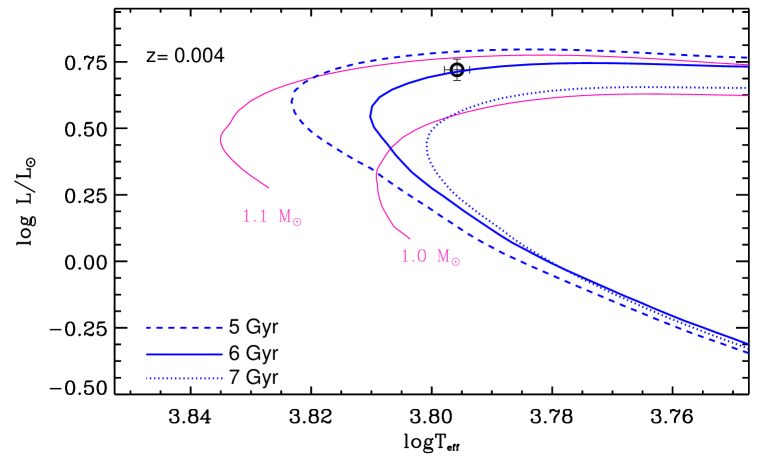
Using the radii and effective temperatures we computed the luminosities of the components as = 5.4 0.4L ⊙ and = 0.009 0.002L ⊙ for the primary and secondary, respectively. In Fig. 5 we compare the positions of the stars in the diagram. The isochrones for 5, 6, and 7 Gyr obtained by models ((Yi et al., 2001), (Demarque et al., 2004)) for Z=0.004 are also plotted. The primary star appears to an evolved F-star with an age of about 6 Gyr. This comparison with the theoretical models indicates that the primary star should have poor metal abundance.
For the first time Ribas (2003) and Ribas (2006) called attention about the significant difference of low-mass stars’ radii between measured and predicted by the theory. His comparison for a limited stars with masses and radii determined with an accuracy better than 3 percent revealed that the observed radii are systematically larger than those estimated by theoretical models. In contrary, their effective temperatures are significantly cooler than in the models. Later on, Cakirli et al. (2010) collected the available masses, radii and effective temperatures of the low-mass stars obtained up to at that date and compared with those calculated by the stellar evolution models. They have also compared radii and effective temperatures of 21 low-mass stars in the mass-radius and mass-effective temperature diagrams. They conclude that stars below 0.3 M⊙ have radii and effective temperatures which are consistent with those of models. However, larger mass stars, above 0.3 M⊙, begin to deviate from the theoretical predictions in the diagram. The observed radii are significantly larger than that of models. In contrary, their observed effective temperatures are significantly lower than those models, i.e. they appear as below-shifted from the theoretical relation. The discrepancies in radii and effective temperatures could neither be explained by changing the ratio of mixing-length to pressure scale height nor metallicity (Demory et al., 2009). As an alternative explanation the magnetic activity, which is responsible for the observed larger radii but cooler effective temperatures, was adopted by Mullan & MacDonald (2001), Torres et al. (2006), Ribas (2006) and Cakirli et al. (2013). Due to high magnetic activity in fast-rotating dwarfs, because of spin-orbit synchronization, their surfaces are covered by dark spots. Faster rotation enhances solar-type activity which results in larger radius and lower effective temperature.
Fig. 6 shows locations of the low-mass stars in the in and planes. The low-mass companion of T-Cyg1-01385 appears to have a radius about 26 per cent larger and effective temperature about 18 per cent cooler than the models (Baraffe et al., 1998). In a very recent paper Cakirli et al. (2013) called attention to the stars having masses about 0.34 M⊙. The empirical diagram shows that the stars with masses lower than about 0.3 M⊙ do not deviate from that predicted by the models. However, largest deviations both in and occur just at the mass higher than 0.34 M⊙. This mass may be taken as transition from partly convective atmospheres to the fully convective stars.

6 Conclusions
Spectroscopic observations of T-Cyg1-01385 are obtained and the radial velocity curves of both components are revealed for the first time. Analysis of the radial velocities and the TES at the -passband and the Cam at the z-passband light curves yielded the physical parameters of the components. Our analysis indicates that the eclipsing binary consists of an F8 subgiant and an M4 dwarf. The radius of the less massive M-dwarf is larger about 26 percent but the effective temperature 18 percent cooler than those estimated from the models. The radii and effective temperatures of low-mass stars obtained so far have been compared with each other and also with the models both in the and panels. The less massive secondary star with a mass of 0.34M⊙ appears to be just in the boundary between partially convection and fully convection.
Acknowledgments
We thank to TÜBİTAK National Observatory (TUG) for a partial support in using RTT150, T100 and T60 telescopes with project numbers 10ARTT150-483-0, 11ARTT150-123-0, 10CT100-101, 12BRTT150-338-1 and 10CT60-72. This study supported by the Turkish Scientific and Technology Council under project number 112T016 and 112T263. We also thank to the staff of the Bakırlıtepe observing station for their warm hospitality. The following internet-based resources were used in research for this paper: the NASA Astrophysics Data System; the SIMBAD database operated at CDS, Strasbourg, France; TÜBİTAK ULAKBİM Süreli Yayınlar Kataloǧu-TURKEY; and the ariv scientific paper preprint service operated by Cornell University.
References
- Alonso et al. (1996) Alonso, A., Arribas S., and Martinez-Roger, C., 1996, AA, 313, 873
- Baraffe et al. (1998) Baraffe I., Chabrier G., Allard F., Hauschildt P. H., 1998, A&A, 337, 403
- Borucki, Koch, & Kepler Science Team (2010) Borucki W. J., Koch D., Kepler Science Team, 2010, DPS, 42, 1052
- Cakirli et al. (2010) Cakirli O., Ibanoglu C., Dervisoglu A., 2010, RevMxAA, 46, 363
- Cakirli et al. (2013) Cakirli O., Ibanoglu C., Sipahi E., 2013, MNRAS, 429, 85
- Chabrier (2003) Chabrier G., 2003, PASP, 115, 763
- Christian et al. (2006) Christian D. J., Pollacco D. L., Skillen I., et al., 2006, MNRAS, 372, 1117
- Copenhagen University et al. (2006) Copenhagen University O., Institute A. O., Cambridge, Uk, Real Instituto Y Observatorio de La Armada F. E. S., 2006, yCat, 1304, 0
- Demarque et al. (2004) Demarque P., Woo J.-H., Kim Y.-C., Yi S. K., 2004, ApJS, 155, 667
- Demory et al. (2009) Demory B. O., Segransan, D., Forveille, T., et al. 2009, A&A, 505, 205
- Devor (2008) Devor, J., 2008, PhD Thesis, Harvard Uninersity
- Devor et al. (2008) Devor J., Charbonneau D., O’Donovan F. T., Mandushev G., Torres G., 2008, AJ, 135, 850
- Drilling & Landolt (2000) Drilling J. S., Landolt A. U., 2000, Allen’s astrophysical quantities, 4th ed. Edited by Arthur N. Cox. ISBN: 0-387-98746-0. Publisher: New York: AIP Press; Springer, 2000, p.381
- Droege et al. (2006) Droege T. F., Richmond M. W., Sallman M. P., Creager R. P., 2006, PASP, 118, 1666
- Fernandez et al. (2009) Fernandez J. M., Latham D. W, Tores G., Everett M. E., Mandushev G., Charbonneau D., O’Donovan F. T, Alonso R., Esquerdo G. A., Hergenrother C. W, and Stefanik P. P., 2009, ApJ, 701, 764
- Girardi et al. (2002) Girardi L., Bertelli G., Bressan A., Chiosi C., Groenewegen M. A. T., Marigo P., Salasnich B., Weiss, A., 2002, A&A, 391, 195
- Kane, Schneider, & Ge (2007) Kane S. R., Schneider D. P., Ge J., 2007, MNRAS, 377, 1610
- Kharchenko & Roeser (2009) Kharchenko N. V., Roeser S., ”All-Sky Compiled Catalogue of 2.5 million stars”.
- Lucy (1967) Lucy L. B., 1967, Z. Astrophys., 65, 89
- Morrison et al. (1999) Morrison J. E., Roeser S., McLean B., Bucciarelli B., Lasker B., 1999, Vizier Online Data Catalog, 1254
- Lopez-Morales et al. (2008) Morales J. C., Ribas I., Jordi C., 2008, A&A, 478, 507
- Mullan & MacDonald (2001) Mullan D. J., MacDonald J., 2001, ApJ, 559, 353
- Prša & Zwitter (2005) Prša A., Zwitter T. 2005, ApJ, 628, 426P
- Perryman & ESA (1997) Perryman M. A. C., ESA, 1997, ESASP, 1200,
- Pourbaix et al. (2009) Pourbaix D., Tokovinin A. A., Batten A. H., et al., 2009, ”SB9:9th Catalog of Spectroscopic Binary Orbits”
- Reiners & Basri (2007) Reiners A., Basri G., 2007, ApJ, 656, 1121
- Reiners, Basri,& Browning (2009) Reiners A., Basri G., Browning M., 2009, ApJ, 692, 538
- Ribas (2003) Ribas I., 2003, A&A, 398, 239
- Ribas (2006) Ribas I., 2006, Ap&SS, 304, 89
- Röser et al. (2008) Röser S., Schilbach E., Schwan H., Kharchenko N. V., Piskunov A. E., Scholz R.-D., 2008, A&A, 488, 401
- Shulyak et al. (2011) Shulyak D., Seifahrt A., Reiners A., Kochukhov O., Piskunov N., 2011, MNRAS, 418, 2548
- Skrutskie et al. (2006) Skrutskie M. F., et al., 2006, AJ, 131, 1163
- Simkin (1974) Simkin, S. J., 1974, A&A, 31, 129
- Southworth et al. (2005) Southworth J., Smalley B., Maxted P. F. L., Claret A. & Etzel P. B. 2005, MNRAS, 363, 529
- Tokunaga (2000) Tokunaga A. T., 2000, ”Allen’s astrophysical quantities”, Fouth Edition, ed. A.N.Cox (Springer), p.143A
- Torres et al. (2006) Torres G., Lacy C. H., Marschall L. A., Sheets H. A., Mader J. A., 2006, ApJ, 640, 1018
- van Hamme (1993) van Hamme, W. 1993 AJ, 106, 2096
- Wilson & Devinney (1971) Wilson R.E. & Devinney E.J., 1971, ApJ, 166, 605
- Zacharias et al. (2005) Zacharias N., Monet D. G., Levine S. E., Urban S. E., Gaume R., Wycoff G. L., 2005, Vizier Online Data Catalog, 1297, 0
- Urban, Corbin, & Wycoff (1997) Urban S. E., Corbin T. E., Wycoff G. L., 1997, The ACT Reference Catalog
- Urban et al. (2004) Urban S. E., Zacharias N., Wycoff O. G. L. U. S. N., Washington 2.-2. D. C., 2004, The UCAC2 Bright Star Supplement
- Wozniak et al. (2004) Wozniak P.R., Vestrand C.W., Akerlof R., et al., 2004, AJ, 127, 2436
- Yi et al. (2001) Yi S., Demarque P., Kim Y.-C., Lee Y.-W., Ree C. H., Lejeune T., Barnes S., 2001, ApJS, 136, 417