PHYSICAL PROPERTIES OF SPECTROSCOPICALLY-CONFIRMED GALAXIES AT . II. MORPHOLOGY OF THE REST-FRAME UV CONTINUUM AND Ly- EMISSION∗∗\ast∗∗\ast Based in part on observations made with the NASA/ESA Hubble Space Telescope, obtained from the data archive at the Space Telescope Science Institute, which is operated by the Association of Universities for Research in Astronomy, Inc. under NASA contract NAS 5-26555. Based in part on observations made with the Spitzer Space Telescope, which is operated by the Jet Propulsion Laboratory, California Institute of Technology under a contract with NASA. Based in part on data collected at Subaru Telescope and obtained from the SMOKA, which is operated by the Astronomy Data Center, National Astronomical Observatory of Japan.
Abstract
We present a detailed structural and morphological study of a large sample of spectroscopically-confirmed galaxies at , using deep near-IR broad-band images and Subaru optical narrow-band images. The galaxy sample consists of 51 Ly emitters (LAEs) at , 6.5, and 7.0, and 16 Lyman-break galaxies (LBGs) at . These galaxies exhibit a wide range of rest-frame UV continuum morphology in the images, from compact features to multiple component systems. The fraction of merging/interacting galaxies reaches 40% 50% at the brightest end of mag. The intrinsic half-light radii , after correction for PSF broadening, are roughly between (0.3 kpc) and (1.7 kpc) at mag. The median value is (0.9 kpc). This is consistent with the sizes of bright LAEs and LBGs at in previous studies. In addition, more luminous galaxies tend to have larger sizes, exhibiting a weak size-luminosity relation at mag. The slope of 0.14 is significantly flatter than those in fainter LBG samples. We discuss the morphology of galaxies with nonparametric methods, including the system and the Gini and parameters, and demonstrate their validity through simulations. We search for extended Ly emission halos around LAEs at and 6.5, by stacking a number of narrow-band images. We do not find evidence of extended halos predicted by cosmological simulations. Such Ly halos, if they exist, could be weaker than predicted. Finally, we investigate any positional misalignment between UV continuum and Ly emission in LAEs. While the two positions are generally consistent, several merging galaxies show significant positional differences. This is likely caused by a disturbed ISM distribution due to merging activity.
Subject headings:
cosmology: observations — galaxies: evolution — galaxies: high-redshift1. INTRODUCTION
Galaxy structural and morphological studies provide basic apparent information about galaxies. Nearby galaxies are generally classified into three broad categories: spiral, elliptical, and irregular. The majority of luminous nearby galaxies () are spirals and ellipticals (Abraham & van den Bergh, 2001). At higher redshift, galaxies are less well developed, and the fraction of irregular galaxies increases steadily (e.g., Driver et al., 1995, 1998). In the redshift range of , galaxy morphology and structure have also been well studied (e.g., Brinchmann et al., 1998; Lilly et al., 1998; Schade et al., 1999; Carlberg et al., 2000; Le Fèvre et al., 2000; van den Bergh et al., 2000, and references therein). These galaxies show more disturbed structures than nearby galaxies do in the rest-frame UV and optical (e.g., Abraham & van den Bergh, 2001; Windhorst et al., 2002; Taylor-Mager et al., 2007; Blanton & Moustakas, 2009; Shi et al., 2009). The fraction of irregular galaxies increases from less than 10% at to % at (e.g., Brinchmann et al., 1998; van den Bergh et al., 2000). In addition, more galaxies were identified as merging systems, reflecting the hierarchical build-up of galaxies and mass assembly in the cold dark matter (CDM) scenario (White & Rees, 1978; Cole et al., 2000). For example, nearly 20% of galaxies in the Le Fèvre et al. (2000) sample are in close pairs.
For galaxies at , morphological classification is challenging, as most galaxies appear peculiar. Galaxies are also smaller towards higher redshift (Ferguson et al., 2004). In addition, galaxies appear much fainter due to the cosmological surface brightness dimming. Traditional classifications, including Hubble’s tuning-fork system, are no longer practical at these higher redshifts. Therefore, nonparametric methods such as the system (Conselice, 2003) and the Gini and parameters (Lotz et al., 2004) play an important role. Most morphological and structural analyses in this redshift range were done in the GOODS fields (Giavalisco et al., 2004), because of the high-quality Hubble Space Telescope () data (e.g., Lowenthal et al., 1997; Ravindranath et al., 2006; Law et al., 2007; Cassata et al., 2010). In the rest-frame UV, galaxies are usually compact (from one to several kpc), but many of them display extended features or multiple clumps in deep images (e.g., Giavalisco et al., 1996; Venemans et al., 2005; Ravindranath et al., 2006; Pirzkal et al., 2007; Conselice & Arnold, 2009; Cooke et al., 2010; Gronwall et al., 2011; Law et al., 2012). For example, the Ravindranath et al. (2006) sample contains thousands of photometrically-selected LBGs at , and about 30% of them have multiple cores. In Law et al. (2012), a sample of spectroscopically-confirmed galaxies in a similar redshift range also showed a high fraction of interacting systems.
In the highest-redshift range , morphological studies become even more difficult. Galaxies appear very faint, and their rest-frame UV light moves to the near-IR wavelength range, where telescope resolution is poorer. A typical galaxy occupies only a few pixels even in near-IR images, so size is usually the only physical parameter that can be reliably measured in the literature. Studies based on photometrically-selected galaxies have shown that galaxies are generally very compact, and most of them are just barely spatially resolved. For example, Oesch et al. (2010) reported the sizes of 16 LBGs at in the Hubble Ultra-Deep Field (HUDF). They found that only two in their sample show extended features, and the rest are very compact ( kpc). This sample is very faint. Observations of a handful brighter galaxies with spectroscopic redshifts also suggest compact morphology, with a typical size of kpc (e.g., Stanway et al., 2004; Dow-Hygelund et al., 2007; Cowie et al., 2011). Note that galaxy size is correlated with physical properties, such as mass and luminosity at low redshift. Such relations may still exist in high-redshift galaxies, but could have evolved with time (e.g., Grazian et al., 2012; Mosleh et al., 2012).
In this paper, we will carry out a structural and morphological study of a sample of 67 galaxies at . The sample is the largest collection of spectroscopically-confirmed galaxies in this redshift range, including 51 Ly emitters (LAEs) and 16 Lyman-break galaxies (LBGs). This paper is the second in a series presenting the physical properties of these galaxies. In the first paper of the series (Jiang et al., 2013, hereafter Paper I), we presented deep Subaru optical and near-IR data. We also derived various rest-frame UV continuum and Ly emission properties, including UV-continuum slope , the Ly rest-frame equivalent width (EW), and star formation rates (SFRs). These galaxies have steep UV continuum slopes roughly between and , with a mean value of . They have a range of Ly EW from 10 to 200 Å. Their SFRs are moderate from a few to a few tens solar masses per year. In this paper, we will study the structure and morphology of their rest-frame UV-continuum emission based on our images, and of their Ly emission based on our ground-based narrow-band images.
The layout of the paper is as follows. In Section 2, we briefly review our galaxy sample and the optical and near-IR data that will be used for the paper. We measure the structure and morphology of UV continuum emission in Section 3, and of the Ly emission in Section 4. We then discuss our results and summarize the paper in Section 5. Throughout the paper we use a -dominated flat cosmology with km s-1 Mpc-1, , and (Komatsu et al., 2011). All magnitudes are on the AB system (Oke & Gunn, 1983).
2. GALAXY SAMPLE AND DATA
In Section 2 of Paper I, we provided a detailed description of our galaxy sample and the multi-wavelength data that we studied. Here we summarize the information below. There are a total of 67 spectroscopically-confirmed galaxies in our sample: 62 are from the Subaru Deep Field (SDF; Kashikawa et al., 2004), and the remaining 5 are from the Subaru XMM-Newton Deep Survey field (SXDS; Furusawa et al., 2008). They represent the most luminous galaxies in terms of Ly luminosity (for LAEs) or UV continuum luminosity (for LBGs) in this redshift range. The SDF galaxy sample contains 22 LAEs at (Shimasaku et al., 2006; Kashikawa et al., 2011), 25 LAEs at (Taniguchi et al., 2005; Kashikawa et al., 2006, 2011), and a LAE at (Iye et al., 2006). The LAEs at and 6.5 have a relatively uniform magnitude limit of 26 mag in the narrow bands NB816 and NB921, and thus make a well-defined sample. The SDF sample also contains 14 LBGs at (Nagao et al., 2004, 2005, 2007; Ota et al., 2008; Jiang et al., 2011; Toshikawa et al., 2012). The LBG candidates in these studies were selected with different criteria, and have a rather inhomogeneous depth. The SXDS sample consists of five galaxies, including two LBGs at (Curtis-Lake et al., 2012) and three LAEs at (Ouchi et al., 2010). All these galaxies are listed in Table 1 of Paper I.
The SDF and SXDS were observed with Subaru Suprime-Cam (Kashikawa et al., 2004; Furusawa et al., 2008). They have extremely deep optical images in a series of broad and narrow bands. Public stacked images are available for the two fields, but the public data do not include the images taken recently. In Paper I, we produced our own stacked images in six broad bands () and three narrow bands (NB816, NB921, and NB973) by including all available data in the archive. Our stacked images have great depth with excellent PSF full width at half-maxima (FWHMs) of . The near-IR imaging data for the SDF galaxies are from three GO programs 11149 (PI: E. Egami), 12329 and 12616 (PI: L. Jiang). The observations were made with a mix of instruments and depth. The majority of the galaxies were observed with WFC3 in the F125W (hereafter ) and F160W (hereafter or ) bands. The typical integration time was two orbits (roughly 5400 s) per band. This provides a depth of mag ( detection) in the band and mag in the band (see also Windhorst et al., 2011). The pixel size in the final reduced WFC3 images is . Several SDF galaxies were observed with NICMOS in the F110W (hereafter ) and bands. The typical integration time was also two orbits. The depth in the two bands are mag and mag, respectively. The pixel size in the final reduced NICMOS images is . The five SXDS galaxies were covered by the UKIDSS Ultra-Deep Survey (UDS). Their WFC3 near-IR data were obtained from the Cosmic Assembly Near-infrared Deep Extragalactic Legacy Survey (CANDELS; Grogin et al., 2011; Koekemoer et al., 2011). The exposure depth of the CANDELS UDS data is 1900 s in the band and 3300 s in the band.
The majority of the galaxies in our sample were detected with high significance in the near-IR images. Only 15 of them — among the faintest in the optical — have weak detections () in the band ( or ). In Table 1 of Paper I, we listed the optical and near-IR photometry of the galaxies. In Table 2 of Paper I, we presented basic physical properties, including the rest-frame UV continuum luminosity and slope , the Ly luminosity and EW, and SFR, etc. The thumbnail images of all the galaxies are provided in Appendix A of Paper I.
3. UV CONTINUUM MORPHOLOGY
In this section, we will derive structural and morphological parameters for the galaxies in our sample. Although our galaxies represent the most luminous galaxies at , they appear faint and small compared to lower-redshift galaxies. The majority of them are point-like sources in the Subaru optical images. Even in the WFC3 images they usually occupy a very limited number of pixels. Hence, the study of these distant galaxies is challenging. In previous literature, galaxy size was often the only parameter that could be reliably measured for galaxies. Classifications for nearby galaxies, such as the classical Hubble’s tuning-fork system, cannot be applied to these objects. In this section, we will measure the sizes of our galaxies, and try to characterize their morphology using nonparametric methods, such as the system (Conselice, 2003) and the Gini and parameters (Lotz et al., 2004). These methods are primarily used for low-redshift galaxies, though they have already been used for galaxies at (e.g., Pirzkal et al., 2007; Conselice & Arnold, 2009). We will also study interacting/merging systems in our sample.
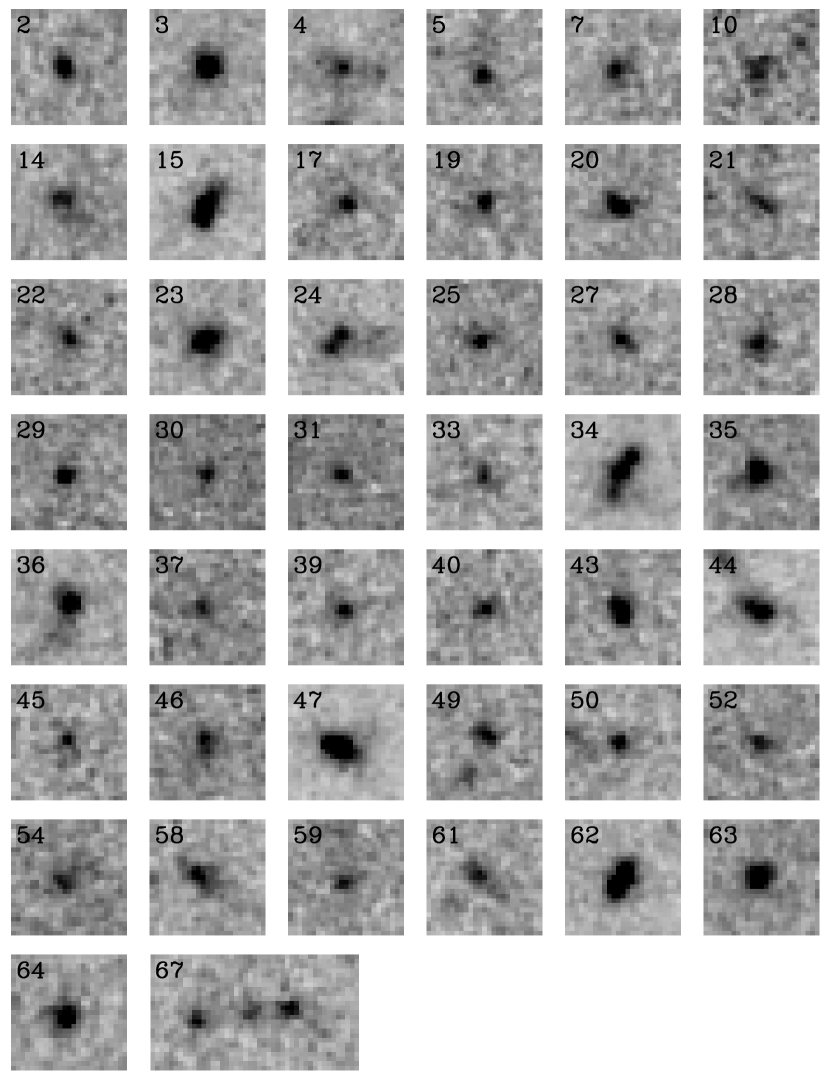
In order to calculate the above parameters, we took advantage of all our images. For each galaxy in our sample, we combined (the weighted average) its - and -band images and made a stacked image to improve the signal-to-noise (S/N) ratio. By doing this we assume that the effect of the morphological k-correction — the dependence of galaxy structure on wavelength — is negligible in the wavelength range considered. This is because the and bands cover a similar rest-frame UV wavelength range (1780 Å vs. 2200 Å) for galaxies. Our further analyses were then based on the stacked images. The and bands do not cover Ly emission for our galaxies, so the morphology in the stacked images is purely from their UV continuum emission (other nebular lines can be safely ignored in general; see also Cai et al. 2011 and Kashikawa et al. 2012). In Figure 1, we show the thumbnail images of 44 (out of 67) galaxies that have more than detections of their total fluxes in the stacked images. We will focus on these 44 galaxies in this section. Note that we excluded object no. 12, since it overlaps with a bright foreground star, as explained in Paper I.
We do not show in Figure 1 the galaxies with detections. Most of them are very faint. The others have shallower images (e.g., 1-orbit depth). We would not obtain reliable morphological information for these individual faint galaxies, so we combined their images and made a single stacked image. The individual images were scaled before stacking, so that the galaxies all have the same magnitude. The final stacked image has a much higher S/N ratio.
3.1. Size
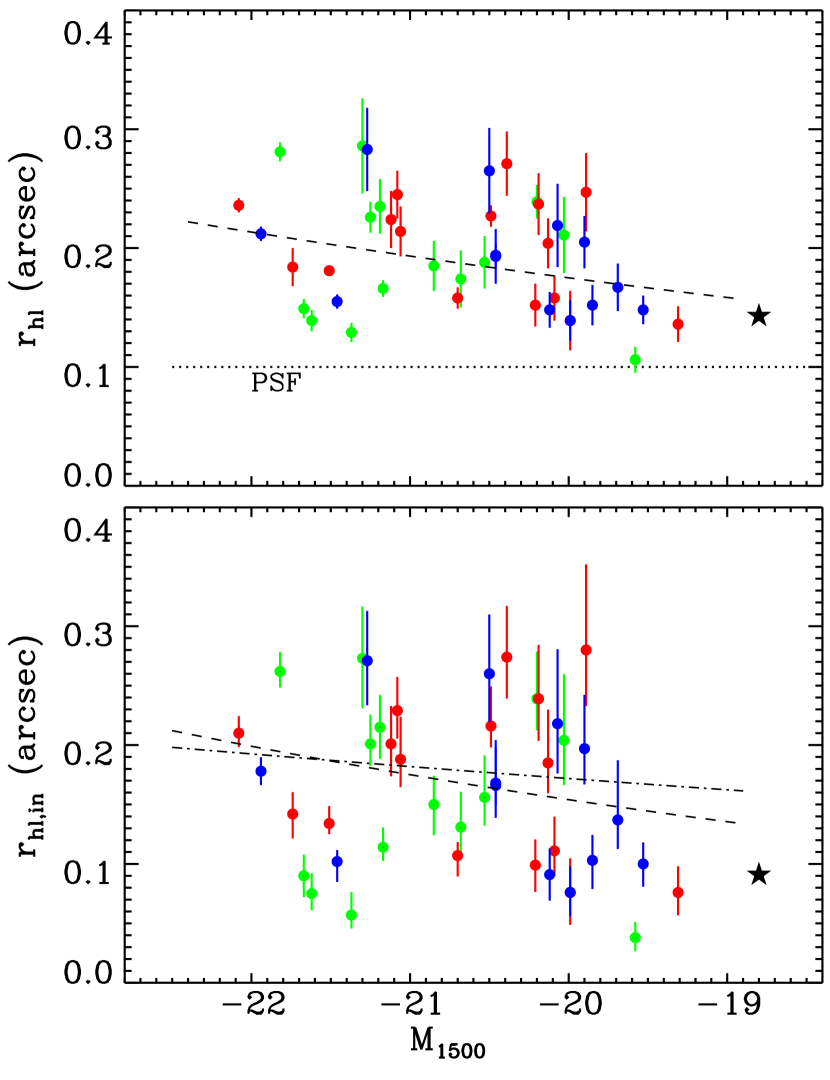
We use half-light radius to describe the size of a galaxy. The half-light radius is a radius enclosing a half of the total light. In Figure 2, the upper panel shows the measured as the function of , the absolute AB magnitude of the continuum at rest-frame 1500 Å. The measured were calculated from elliptical apertures using SExtractor (Bertin & Arnouts, 1996). Physical quantities such as were derived in Paper I. The blue and red circles in Figure 2 represent the LAEs at and 6.5 (including ), respectively, and the green circles represent the LBGs at . We do not include object no. 67, since it has three well separated components and its is likely meaningless. The black star indicates the stacked image of the faint galaxies described above. The measurement uncertainties in the upper panel were derived from the simulations described below. These galaxies roughly span a luminosity range of , and a radius range of (or 0.6–1.7 kpc) without correction for PSF broadening. The median value is ( kpc). Note that the sample in Figure 2 is dominated by the galaxies at mag. The stacked image of the faint galaxies has a relatively smaller radius ( kpc). The median value for the whole sample of 67 galaxies is ( kpc), if we assume that the faint galaxies with mag in this sample have smaller than this median value.
We estimated measurement uncertainties for from simulations. For each galaxy, we made a model galaxy using the two-dimensional fitting algorithm GALFIT (Peng et al., 2002). A single component with a Sérsic function was fitted to the galaxy. This noiseless mock galaxy was put back at random positions (one position at a time) in the blank regions of the same science image. We then measured using the same way as we did for our real galaxies. We denoted the standard deviation of the measured as the measurement uncertainty of for this galaxy. The measurement uncertainties of in our sample (shown as the error bars in the upper panel of Figure 2) have a median value of 10%.
We estimated intrinsic half-light radius and systematic uncertainties from simulations as well. Because of the PSF broadening and lower surface brightness at larger sizes, the observed (or measured) is a complex function of galaxy size, brightness, and intrinsic profile. Simulations have been widely used to investigate these systematic effects (e.g. Driver et al., 2005; Häussler et al., 2007; Cibinel et al., 2012; Grazian et al., 2012; van der Wel et al., 2012). We started with the GALFIT parameters obtained above, and considered four parameters here, including the Sérsic index , the axis ratio , brightness, and . Based on these parameters, we produced a large set of mock galaxies in a grid of , , , and . The values of were chosen to be 1, 1.5, and 2 times the measured from our galaxies, and the values of were chosen to be 1, 2/3, 1/3 times the measured from our galaxies. This is because the PSF broadening could largely decrease and increase in low-resolution images. The luminosity coverage () and coverage () that we chose are roughly consistent with the actual coverage of our galaxy sample. The mock galaxies were oversampled so that their sizes were at least 20 pixels. Then they were convolved with PSF images and rebinned to match the pixel scales of our images. Finally, each of the rebinned mock galaxies was placed at many () random positions in the blank regions of our science images. The of this mock galaxy is the median value measured at these random positions.
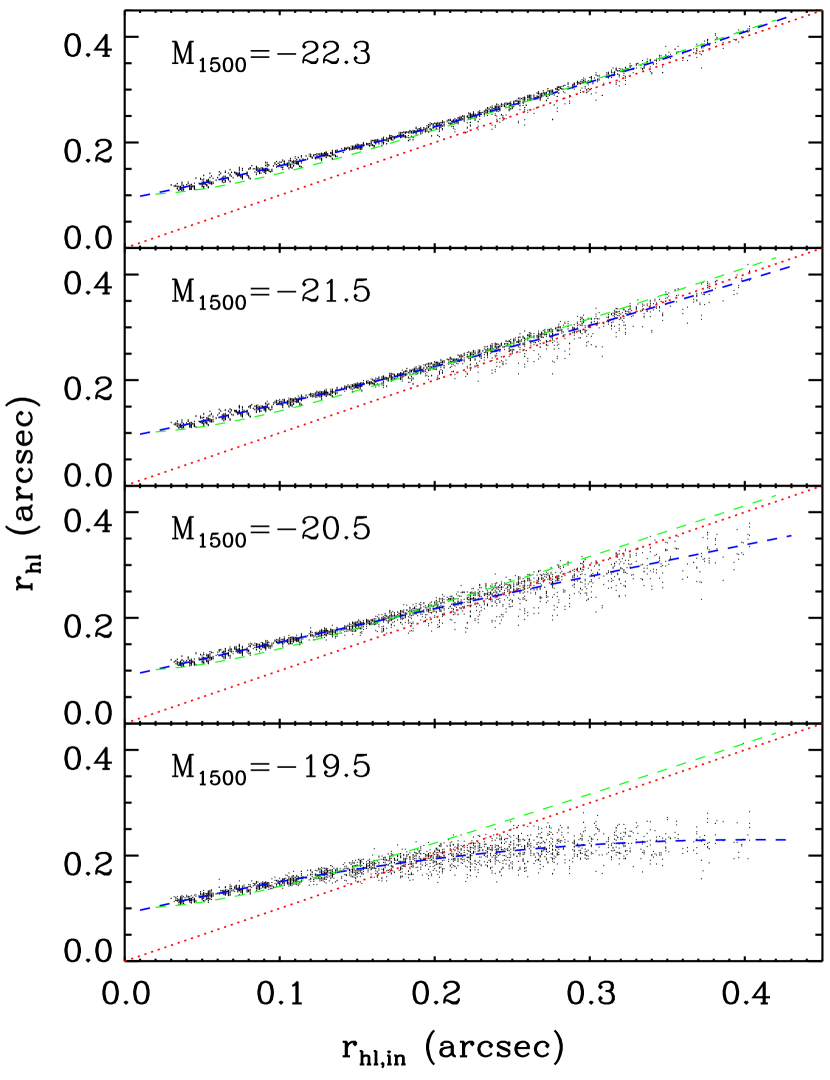
Figure 3 shows part of our simulation results. It illustrates the measured as a function of at four different magnitudes. It clearly shows that at small sizes, is significantly larger than due to the PSF broadening. At large sizes, however, starts to fall short of , because we start to loose low surface brightness pixels at large sizes by detection. This happens at smaller sizes for fainter galaxies. At the faintest magnitude mag, will never exceed in our images, regardless of . On the other hand, if faint galaxies are always small, as seen in deeper images (e.g., Windhorst et al., 2008; Oesch et al., 2010; Grazian et al., 2012), their should not be significantly smaller than (e.g. at mag in Figure 3). Note that Figure 3 is similar to Figure 4 in Grazian et al. (2012). Another simple way to correct for PSF broadening is to estimate in quadrature, i.e., , where is the PSF radius. Figure 3 shows that this equation is a good approximation at small sizes and/or high luminosities (green dashed lines), but it underestimates elsewhere.
We used the relations in Figure 3 to estimate intrinsic sizes and associated systematic uncertainties for our galaxies. The results are shown in the lower panel of Figure 2. The error bars include both measurement and systematic uncertainties, with systematic uncertainties being the dominant factors for most galaxies. With this correction, the values of for our galaxies at mag range from ( kpc) to ( kpc), with a median value of ( kpc). The for the stacked object is about . The median value for the whole sample of 67 galaxies is ( kpc), if we assume that the faint galaxies at mag in this sample have smaller than this median value.
The galaxy sizes in our sample roughly agree with those of high-redshift LAEs and LBGs with similar luminosities in the previous literature. For example, Pirzkal et al. (2007) found that the average for a sample of luminous LAEs at is . Taniguchi et al. (2009) found a median of for LAEs at . In the Hathi et al. (2008) and Conselice & Arnold (2009) LBG samples of galaxies, the ranges are , similar to the range in our sample. Previous studies have shown that the galaxy size roughly scales with redshift as , with close to 1.1–1.2 (e.g. Ferguson et al., 2004; Bouwens et al., 2006; Oesch et al., 2010; Mosleh et al., 2012), so the size of galaxies evolves slowly at high redshift. This is the reason that high-redshift galaxies have a similar size range. Malhotra et al. (2012) found, however, that LAEs have a roughly constant size in the redshift range of , and do not show a size-redshift relation. While our sample does not have a large redshift coverage, our galaxy sizes are well consistent with those in their sample.
3.1.1 Size-luminosity relation
Figure 2 shows that brighter objects appear to have larger , meaning that more luminous galaxies tend to have larger physical sizes. This size-luminosity relation has been reported for both low- and high-redshift star-forming galaxies (e.g., Taniguchi et al., 2009; Oesch et al., 2010; Grazian et al., 2012; Ono et al., 2012). For example, with a large sample photometrically-selected LBGs at in the CANDELS fields, Grazian et al. (2012) found a strong relation , with slope . In Figure 2, we illustrate the size-luminosity relation by displaying the best log-linear fits (dashed lines). The best fitting results in the two panels are and , respectively. Our slopes are much flatter than that in Grazian et al. (2012) and those in other fainter LBG samples. The reason is that our galaxy sample is much brighter. Our relation is derived from galaxies in the luminosity range of mag, while the Grazian et al. (2012) sample covers a range of mag. Their relation largely depends on the galaxies fainter than –19.5 mag, as seen in Figure 9 of their paper. In the brighter galaxies, their (or ) shows less of a trend with luminosity, as also pointed out by Grazian et al. (2012). In fact, our best fit to the galaxies with mag (dash-dotted line in Figure 2) gives a nearly flat slope of , suggesting little correlation between size and luminosity in the most luminous galaxies.
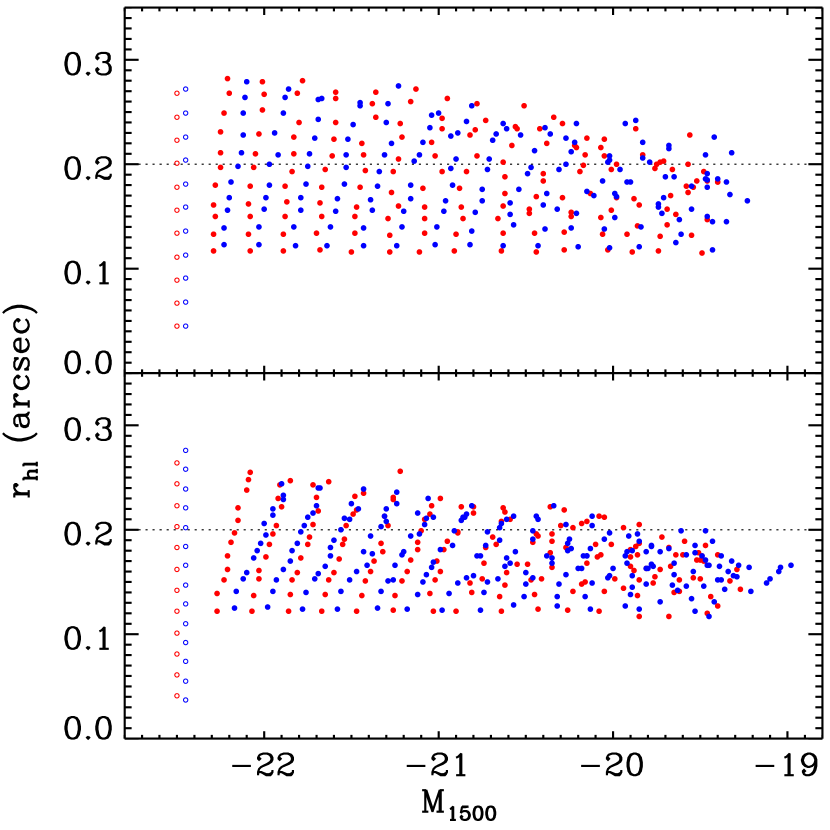
It should be pointed out that the relation between the measured size and luminosity could be affected by systematic effects shown in Figure 3. Figure 4 illustrates how such effects shape the - relation for mock galaxies from the simulations above (see also e.g., Cibinel et al., 2012). The open circles indicate the intrinsic sizes , and the filled circles are the measured sizes at different luminosities. The two colors red and blue indicate two different images that the mock galaxies are placed in. The two panels are for two sets of Sérsic index : 1 and 2 times the measured from our galaxies. Figure 4 shows that fainter galaxies (with the same intrinsic size) appear to be smaller, as already shown in Figure 3. For the same reason, larger galaxies (with the same intrinsic luminosity) appear to be slightly fainter. We have taken into account these effects in Figure 2. These effects do not have significant impact on the size-luminosity relation in Figure 2: the corrected relation does not become flatter, because this relation also depends on other factors such as the source distribution.
Finally, we point out that the size-luminosity relation in our sample is not affected by a possible selection effect, i.e., that we may have missed some faint galaxies with large sizes during galaxy candidate selection. The reason is that these galaxies were selected in optical images. They are bright and point-like sources in the optical broad bands (for LBGs) or narrow bands (for LAEs). Also note that the exclusion of faint galaxies in our sample does not introduce bias to our results. Our near-IR data have relatively uniform depth (two orbits per band per pointing), so the cut indeed puts a flux limit on in Figure 2, which does not affect our results in the bright region of mag.
3.2. Nonparametric Measurements of Morphology
In this subsection, we will characterize galaxy structure and morphology using nonparametric methods, including the (Concentration, Asymmetry, and Smoothness) system (Conselice, 2003), the Gini coefficient , and the parameters (Lotz et al., 2004). These methods have been widely used for lower-redshift galaxies. They usually provide reliable description of galaxy structure, and are able to distinguish different types of galaxies. To obtain accurate measurements of these quantities, two criteria are often required: high S/N ratios and large object sizes compared to the PSF size. For low-redshift galaxies, especially those in images, the sizes of galaxies are many times larger than PSF, so the two criteria are naturally met in deep images. At higher redshift, galaxies are fainter and smaller, so it is difficult to meet the two criteria, and these parameters become less reliable. We investigate the reliability of these measurements for our sample in detail below.
3.2.1 , Gini, and parameters
Concentration () measures how compact the galaxy light profile is. We adopted the commonly used definition (e.g., Bershady et al., 2000; Conselice, 2003), where and are the radii that contain 80% and 20% of the total galaxy flux, respectively. Asymmetry () measures how rotationally symmetric a galaxy is (Abraham et al., 1996; Conselice, 2003). It is calculated by subtracting the image rotated by 180 from the original galaxy image. Smoothness () or clumpiness measures how clumpy a galaxy is (Conselice, 2003). Conselice & Arnold (2009) found that fails to well describe clumpiness for galaxies, so we did not calculate in this paper. The parameter, or the second-order moment of the brightest 20% of the galaxy, is similar to the concentration , and measures how the galaxy light is concentrated (Lotz et al., 2004). The Gini coefficient () describes how even the galaxy light distribution is (Abraham et al., 2003; Lotz et al., 2004). We computed and as described by Lotz et al. (2004).
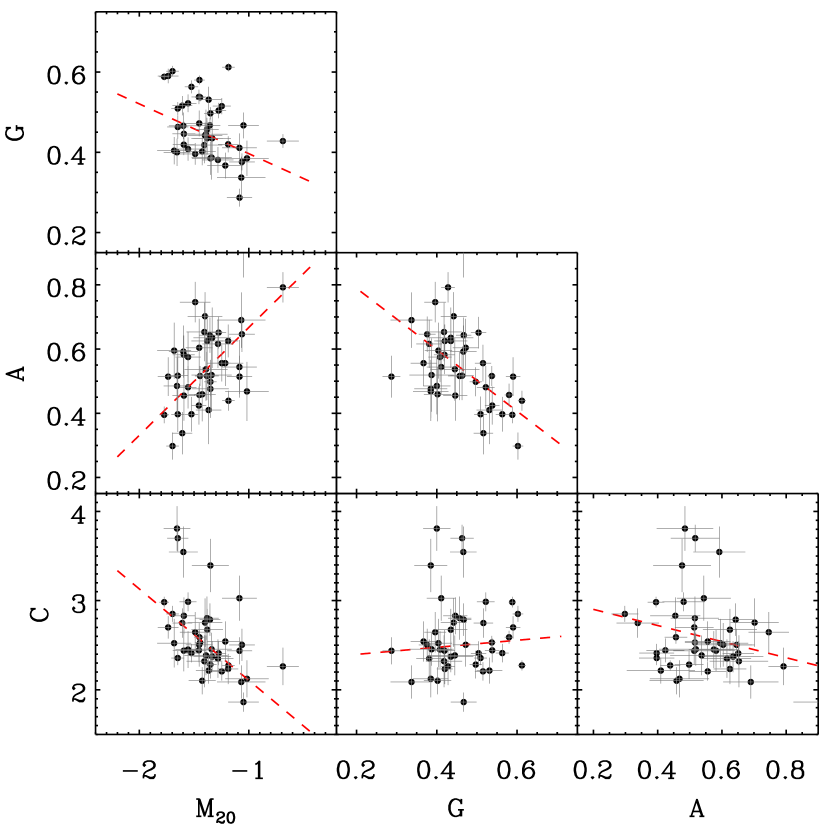
The measurements of these parameters are shown in Figure 5. The measurement uncertainties were estimated from simulations using the same method as we did for the uncertainties of . We took the model galaxies obtained in Section 3.1, and put them at many random positions in the blank regions of our images. We then measured at each position, and calculated the standard deviations of these parameters. The standard deviations, or measurement uncertainties, are shown as the error bars in Figure 5. These uncertainties include the effects of S/N in the images, but do not account for systematic uncertainties associated with sparse spatial sampling of distant small and faint sources which we investigate in Section 3.2.2.
Compared to low-redshift galaxies, our galaxies are located in a much narrower range in the parameter space (Figure 5; see also Figures 6 and 7). They appear to be less concentrated and more asymmetric, and their light distribution is more even. This is likely because the measured quantities have been substantially affected by the low resolution of our images. For example, has a narrow range between 2 and 3, and there is a lack of highly-concentrated values of . Due to the low spatial resolution, the measurements of and are not robust. In particular, for highly-concentrated galaxies, the inner radius is smaller than one pixel and is likely significantly overestimated, so is underestimated. We will discuss these systematic effects using simulations below.
3.2.2 Systematic effects from simulations
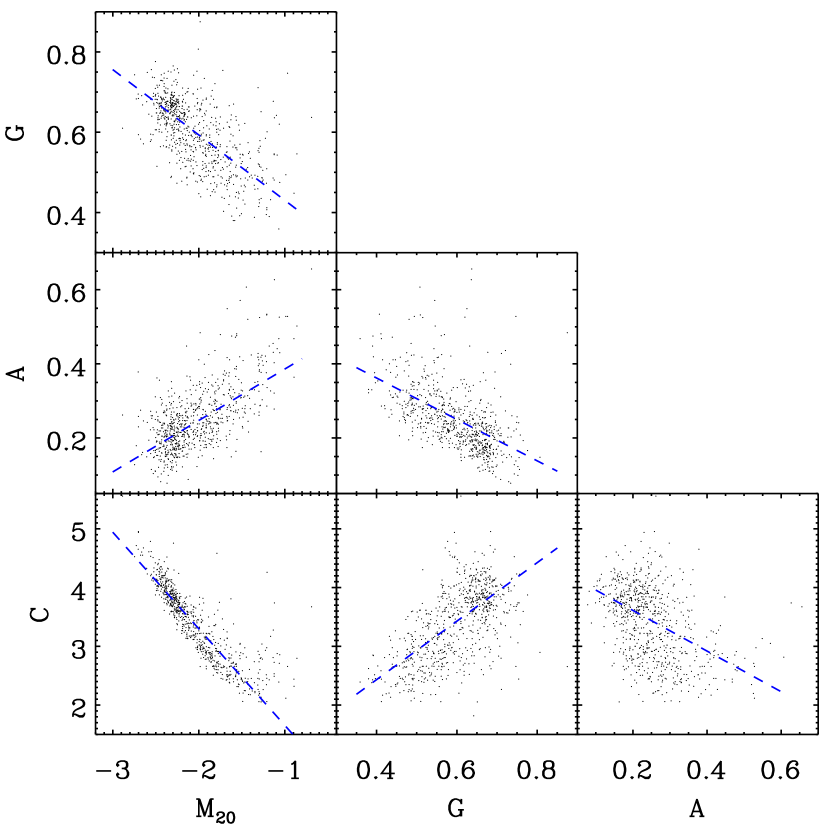
In order to address how the low spatial resolution of the images affect the measurements of the parameters , or how reliable these parameters are (for galaxies), we ran a series of slightly different simulations than we did in Section 3.1. Here we started with low-redshift real galaxies instead of model galaxies, because model galaxies are smooth, and do not cover a large range of the parameter space. For example, is zero for a noiseless single-component model galaxy. We chose to use the galaxy images in the library of galSVM (Huertas-Company et al., 2008, 2011). These low-redshift galaxies are large and bright, and their images have high S/N ratios. We randomly selected 1/10 of the galaxies from this library. We then visually inspected these galaxies and removed those with possible foreground stars. Our final sample consists of 740 galaxies. Their morphological parameters are shown in Figure 6 (the scale in this figure is very different from that in Figure 5). These galaxies cover a large range of the parameter space of .
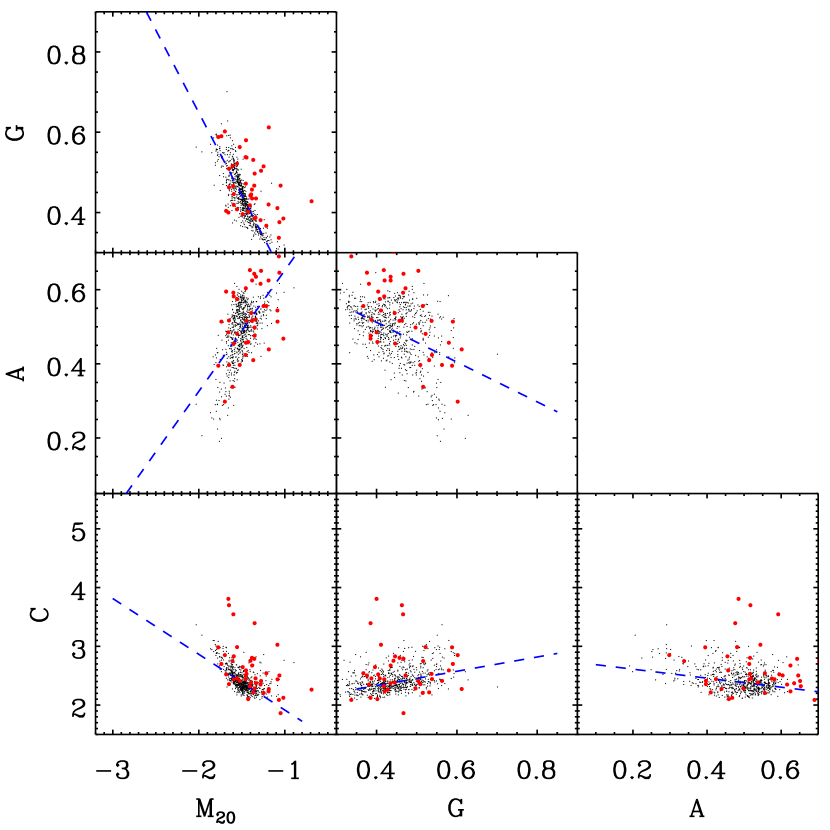
By rescaling these real galaxies in size and flux, we produced a large set of mock galaxies with high spatial resolution at , in the grid of magnitude () and size (). The mock galaxies were then convolved with the PSF images and rebinned to match the pixel scales of our images. Finally, the rebinned mock galaxies were placed at many random positions in the blank regions of the images, and their morphological parameters were measured. Figure 7 shows an example of our simulation results (black dots). In this example, we preserved the relative magnitudes and sizes of the galaxies, and scaled the sample as a whole so that the scaled sample covers a similar range of magnitude and size as our galaxies do. This is the best way to preserve the scatter of source distributions in the parameter space.
The comparison between Figure 6 and Figure 7 shows that the parameters of these mock galaxies measured in our low-resolution images are quite different from the intrinsic values: they occupy a smaller range of the parameter space. For example, the mock galaxies are significantly less concentrated in our images ( in Figure 7 in Figure 6). As we already mentioned, is significantly underestimated for highly-concentrated galaxies because is much smaller than one pixel in our images. Since also describes galaxy concentration, it is underestimated as well (less negative here). This was also noticed by Lotz et al. (2006). Due to the low spatial resolution, our images cannot resolve subtle structures, so the mock galaxies show lower coefficients, or more evenly distributed light. The limitation of has been reported (e.g. Lisker, 2008). Also because of the low resolution, the values of the mock galaxies are much larger.
In Figure 7 we also plot our galaxies (red circles). Their morphological measurements are directly taken from Figure 5. Their positions in the parameter space are quite consistent with those of the mock galaxies. This suggests that the galaxies are possibly not intrinsically less concentrated, more asymmetric, or less even in light distribution. It is simply because our images do not meet one critical requirement to use these methods, i.e., large galaxy sizes compared to the PSF size, so our measurements have been systematically biased by the low-resolution images. On the other hand, these parameters are probably still meaningful for galaxies at similar redshifts, if they are measured in the images of the same depth and pixel size, i.e., for example, intrinsically more concentrated galaxies are still more concentrated in our images as measured by . We demonstrate this using the simulations of the 740 mock galaxies shown in Figure 7. We first choose the galaxy pairs whose difference of the measured (or any of ) are larger than ( is the measurement uncertainty). Among these galaxy pairs, we further select the pairs in which the galaxy has larger intrinsic than the other one still has larger measured in the low-resolution images. The fraction of such pairs for is 93%. The fractions for are 70%, 98%, and 92%, respectively. If we increase to above, the fractions for increase to 97%, 78%, 100%, and 95%, respectively. This suggests that for the vast majority of galaxies, the low resolution of our images does not change their relative values of these morphological parameters. We emphasize that the absolute measured values of these parameters for galaxies in images are not to be compared to the absolute measured parameters of lower-redshift galaxies.
3.2.3 Relations among the morphological parameters
The morphological parameters correlate with each other. We have seen such correlations in low-redshift galaxies (e.g. Lotz et al., 2004, 2006; Conselice & Arnold, 2009). In Figure 6, the dashed lines are the best linear fits to the 740 low-redshift galaxies, and show the relations among . As expected, these parameters are correlated with each other. The moment is correlated well with , , and . Both and describe how the galaxy light is concentrated, and they are strongly correlated by definition. The relations between and & reflect that more concentrated galaxies have more rotationally symmetric profiles and more unevenly distributed light. The Gini coefficient is correlated with and , in addition to . Its relations with and indicate that galaxies with more concentrated or more rotationally symmetric profiles tend to have more unevenly distributed light. These relations still exist among the 740 mock galaxies in Figure 7, since the relative values of the parameters are preserved as we discussed above. On the other hand, some relations become weaker with larger scatter. For example, the relations between and are much flatter, mainly because the coverage of has shifted from to .
In Figure 5, the red dashed lines show the correlations of for our galaxies. These correlations are consistent with those for the mock galaxies in Figure 7. In particular, the relations between and are still fairly well preserved, and the relations between and are as weak as shown in Figure 7. We will see in the next subsection that these corrections for relatively bright galaxies in our sample are better with smaller scatter (Figure 10). Therefore, although our measured of the galaxies are systematically biased by the low-resolution images, these parameters, when interpreted carefully, are still somewhat meaningful for galaxies measured in the images of the same depth and pixel size.
3.3. Interacting Systems
One of the interesting morphological topics is to study interacting/merging systems, which traces hierarchical mass assembly in the CDM scenario. A close visual inspection of Figure 1 shows that some galaxies are clearly extended with interacting or multi-component features. At lower redshift, these systems can be identified by pair counts (e.g., Le Fèvre et al., 2000), the system (e.g., Conselice, 2003), or the and parameters (e.g., Lotz et al., 2008). Galaxies at are faint and small, so it is difficult to properly distinguish regular and interacting/merging systems. Although we have derived morphological parameters , they were biased, and their ability to identify merging systems at has never been examined. Therefore, we identify interacting/merging systems by visual inspection. Visual classification was the earliest way for galaxy classification, and in many cases is still the best way to identify merging systems at high redshift.
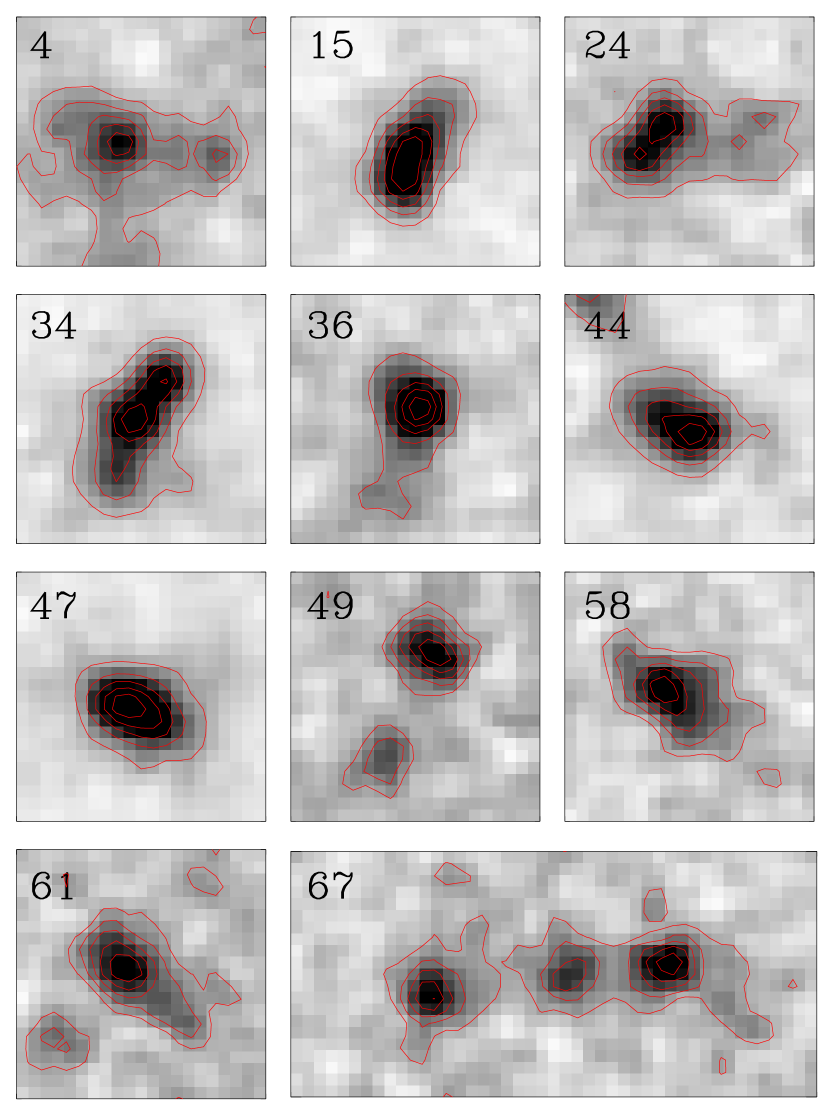
We considered the following two types of galaxies as candidate interacting/merging systems: 1) galaxies with two or more distinct cores; and 2) galaxies with extended/elongated features and/or long tails. We identified these systems in 24 relatively bright ( mag) galaxies. For fainter galaxies, our images are not deep enough to properly identify all faint components or extended features. Figures 8 and 9 show 12 galaxies that were identified as interacting systems with mag. Figure 8 shows 11 galaxies in the stacked () images, and Figure 9 shows the LAE (no. 62) in the two bands. The red profiles are the surface brightness (SB) contours of the rest-frame UV emission. Six of them clear show double or multiple clumps, including no. 4, 24, 34, 49, 62, and 67. They usually have one bright core and one or more fainter clumps. No. 62 and 67 are particularly interesting. No. 62 in Figure 9 has almost two identical components, and no. 67 has three widely-separated cores. More discussion is given in the next subsection. Another 3 galaxies, including no. 36, 58, and 61, do not clearly show multiple clumps, but have long tails like tidal tails seen in low-redshift merging galaxies. The rest of the 12 systems (no. 15, 44, and 47) do not show multiple components or tails, but they are rather extended and elongated. They could be in the end of the merging process.
We estimate the fraction of mergers among galaxies with mag. The fraction is 50%, or 38% if we exclude the three galaxies that do not show multiple components or tails. The fraction is even higher in the galaxies with mag. We have 18 galaxies in this magnitude range, and 10 of them are mergers. The fraction of mergers is 56%, or 39% if we exclude the three galaxies mentioned above. This is consistent with the fractions in the brightest galaxies at low redshift of . For example, the fraction of mergers in the mag galaxy sample of Conselice (2003) is 40%–50%. The typical fraction in the brightest galaxies in the sample of Law et al. (2012) is also %. The merger fraction in fainter galaxies is smaller, because merger systems consist of multiple components, and usually have stronger SFRs and UV emission. For the galaxies fainter than mag in our sample, our images are deep enough to identify double-core systems with comparable emission. We find that these systems are very rare at mag. Studies in deeper fields have indicated a low merger fraction in low-luminosity galaxies. For example, Oesch et al. (2010) presented the morphology of 16 LBGs in the HUDF, and only found two galaxies with extended features.
3.3.1 Notes on individual objects
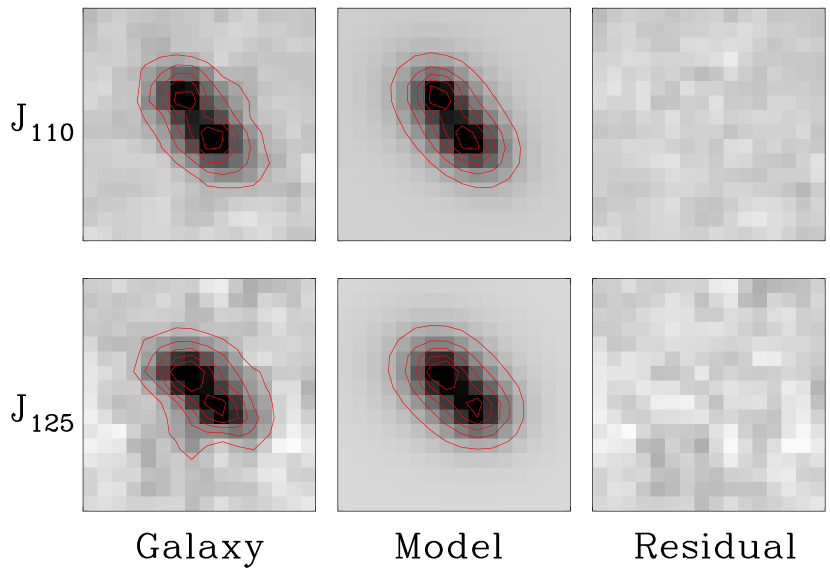
Galaxy no. 62. No. 62 is a LAE. It is the first spectroscopically-confirmed LAE at (Iye et al., 2006). Figure 9 shows that it has two similar components in the both bands. We used GALFIT to model the two components. Two Sérsic functions were fitted to the two components (two left-hand images in Figure 9) simultaneously. The middle images in Figure 9 show the best model fits, and the residuals are on the right-hand side. The two components in the both bands can be well described by the Sérsic function. The separation between the two cores is about ( kpc) (see also Cai et al., 2011).
Galaxy no. 67. No. 67 is a LAE at . It was discovered as a giant LAE by Ouchi et al. (2009). It is one of the brightest galaxies in terms of both Ly luminosity and UV continuum luminosity. The most striking feature is the three well separated cores lined up. The central core is relatively weak. This galaxy is clearly resolved in our ground-based and -band images. The separate between the two side cores reaches , or 7 kpc. This is the largest separation we have seen at . This object also has strong emission in the IRAC bands, suggesting a large stellar mass of (Ouchi et al., 2009).
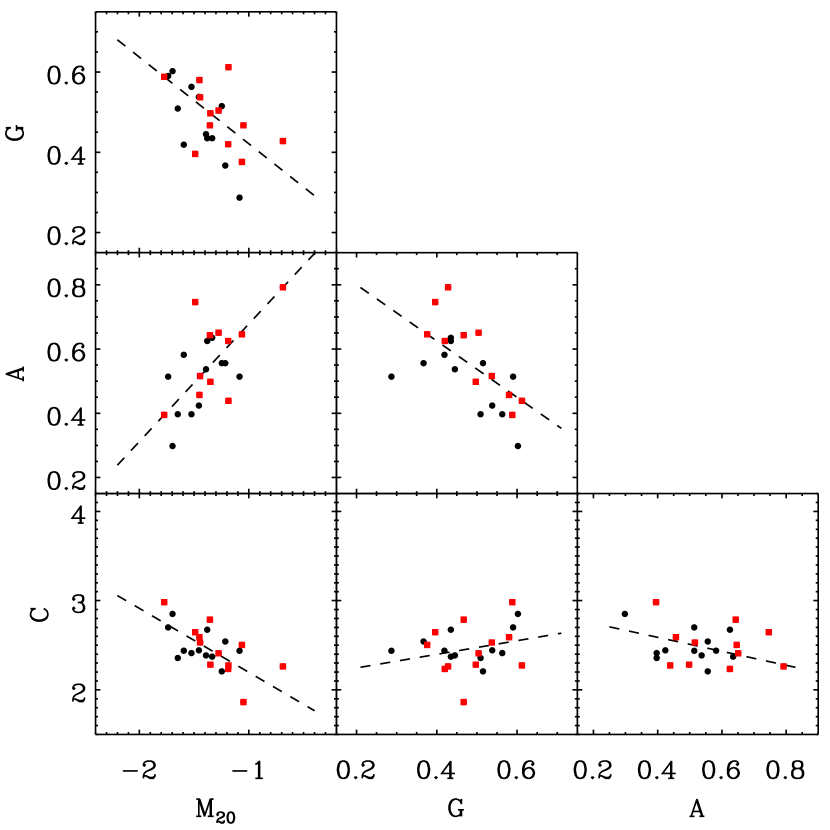
3.3.2 Morphology of interacting systems
As we mentioned, the above interacting galaxies were identified with visual inspection. Morphological parameters were not used for selection because the criteria of interacting systems at are unclear. We check our interacting systems in the parameter space in Figure 10. Figure 10 is similar to Figure 5, but only plots the galaxies with mag in our sample. The red squares represent the interacting galaxies. Figure 10 shows that the interacting galaxies are almost indistinguishable from the rest in the parameter space. Asymmetry is widely accepted as an efficient parameter to identify mergers at low redshift (e.g. Conselice, 2003; Conselice & Arnold, 2009; Lotz et al., 2006, 2008; Law et al., 2012). In Figure 10, however, is not a good indicator of mergers any more, although the galaxies with the largest in our sample are mostly interacting systems.
An interesting feature in Figure 10 is the better correlations among the morphological parameters compared to Figure 5. The scatter in the relations is smaller for these bright galaxies with mag. There are two explanations. One is that bright galaxies have higher S/N ratios and cover more pixels in the images, so their morphological measurements are more robust. The other one is that galaxies with different luminosities occupy slightly different parameter space, so a sample covering a smaller luminosity range shows a smaller scatter in Figure 10. The real reason is very likely the combination of the two. In any case, Figure 10 strengthens our earlier conclusion on the existence of strong correlations among for our galaxies.
4. Ly MORPHOLOGY
In this section we will study the Ly morphology of LAEs using our ground-based narrow-band images. We will not measure structure and morphology for individual galaxies, since they are mostly point-like objects in the ground-based images. Although these images have excellent PSF sizes of , the PSF sizes are still much larger those of the images. Therefore, we will focus on Ly halos around LAEs, which could extend many arcsec from the objects. We will also compare the positions of Ly emission with those of UV continuum emission, and find any possible positional difference between the two.
4.1. Ly Halos
Because of the resonant scattering of Ly photons by neutral hydrogen, Ly emission could form large diffuse Ly halos around high-redshift galaxies. Steidel et al. (2011) first found very extended Ly halos in a sample of luminous galaxies at . The galaxies were UV continuum-selected, but more than a half of them show net Ly emission and % have Ly EW greater than 20 Å. They were able to find large Ly emission halos ( kpc) in the stacked images of all sub-samples of their galaxies. They further claimed that all LBGs would be classified as LAEs or Ly blobs, if imaging data are deep enough to detect Ly halos. Matsuda et al. (2012) confirmed the existence of extended Ly halos around galaxies. They used more than 2000 LAEs at , and grouped them into sub-samples based on luminosity and surface overdensity. They stacked narrow-band (Ly) images for each sub-sample, and found that all stacked images show extended ( kpc) Ly emission halos. Recently Feldmeier et al. (2013) found that the existence of Ly halos around LAEs is not convincing. They also used a large sample of a few hundred LAEs at and 3.1. They paid particular attention to systematic effects from large-radius PSF and large-scale flat fielding, etc. When these effects were taken into account, they did not find strong evidence of extended Ly halos in the stacked narrow-band images at either redshift. They tried a few ways to reconcile the discrepancy between their results and the previous results, yet the reason of the discrepancy is still not clear.
Stacking of narrow-band images has not been done for galaxies. On the other hand, cosmological simulations have predicted the existence of extended Ly emission around galaxies (e.g., Zheng et al., 2011; Dijkstra & Kramer, 2012; Jeeson-Daniel et al., 2012). For example, by including the resonant scattering of Ly photons in both circumgalactic media and intergalactic medium (IGM), Zheng et al. (2011) showed that the Ly emitting halo in a high-redshift galaxy can extend up to 1 Mpc. They further pointed out that such halos could be detected by stacking 100 LAEs in 4-hr exposure narrow-band images in the SXDS. Here we combine the narrow-band (Ly) images of LAEs at and 6.5.
In order to detect diffuse Ly halos around LAEs, we made use of all the known LAEs at and 6.5 in the SDF and SXDS fields from Kashikawa et al. (2011) and Ouchi et al. (2008, 2010). The narrow-band images were taken with the Subaru telescope. The total integration time in the NB816 and NB921 bands are 10 and 15 hr for the SDF (Kashikawa et al., 2004), and 4 hr and 10 hr (depth slightly varies among five pointings) for the SXDS (Ouchi et al., 2008, 2010). The data reduction of the SDF images were presented in Section 2 of Paper I. The reduction of the SXDS images were done in the same way. These narrow-band images have great depth with excellent PSF sizes of . We rejected a small number of galaxies that are either very faint or blended with nearby bright objects. The final sample contains 43 LAEs at and 40 LAEs at .
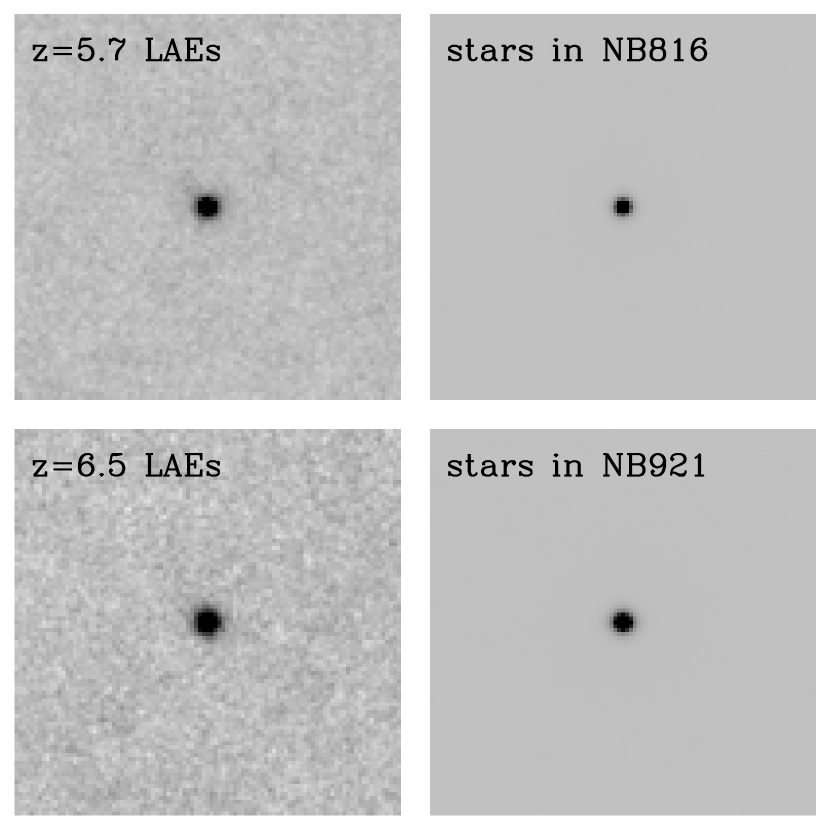
To stack these images, we first cut image stamps for all individual objects. We then re-sampled image stamps, so that the objects are in the centers of the images. After all other objects in the images were masked out, we co-added (average) the images with sigma-clipping ( rejection). Figure 11 shows the stacked narrow-band Ly images at the two redshifts. We did not subtract away continuum images. As we showed in Paper I, our LAEs have Ly EWs greater than 20 Å. The median EW value is 80 Å, so their narrow-band photometry is completely dominated by the Ly emission. Subtracting continuum images would significantly increase the background noise. In the above procedure we did not scale the objects to the same magnitude either, since we do not know how the SB of the Ly halos scales with the total Ly flux in a LAE. We performed a series of tests by stacking the images in different ways, including image stacking with median, with objects scaled to the same magnitude, and with bright objects only. The results are all very similar to the images shown in Figure 11. Our stacked images of LAEs reach a depth of roughly () in both bands (see also Figure 12). We should point out that this depth is shallower than what we predicted assuming that the noise goes down with the square root of the image number. The reason is that the input images are not purely blank images, whose noise is dominated by background Poisson noise. These images are extremely deep and crowded, so LAEs have many nearby objects. Although we were able to mask out the bright pixels of the nearby objects, we could not remove the light outside these pixels that may extend many pixels away. When we combine many images, these nearby objects contribute significant unavoidable noise to the co-added images.
Figure 11 clearly shows that the stacked Ly emission is compact at the both redshifts, and do not show extended diffuse halos. As a reference, we also show in Figure 11 the stacked images of stars (point sources). The stars are chosen to be separated, bright, but not saturated, in the same narrow-band images. They are combined in the same way as we did for LAEs. Figure 12 shows the radial profiles of the stacked LAEs (solid lines with error bars) as well as the profiles of the stars (dotted lines). The Ly profiles roughly follow the PSF profiles, and their SB reach zero at . In the upper panel, the profile FWHM of the stacked LAE and star are and , respectively. In the lower panel the two FWHM values are for the LAE and for the star. The LAE profiles are broader than the PSF sizes by %, and exhibit slightly longer tails than the PSF profiles do. This is simply because galaxies are not point sources, and indicates that the Ly emission is resolved but not very extended. In the previous sections we show that our LAEs have a range of sizes in their rest-frame UV emission. Hathi et al. (2008) stacked broad-band HUDF images for LBGs and found that the galaxy SB profiles are apparently broader than the PSF profiles. Finkelstein et al. (2011) found that two LAEs have large sizes in Ly than in UV continuum. So the slightly broader Ly SB profiles compared to the PSF are just the nature of galaxies, and are not likely caused by diffuse Ly halos predicted or found in previous studies. The profile seems to exhibit slightly more extended radius than its PSF profile. Given the limit of , its SB is still consistent with zero at . Therefore, Figure 12 does not show convincing evidence of extended Ly halos.
It is difficult to answer whether our stacked images are deep enough to detect Ly halos if they do exist at the two redshifts. Our images are certainly deep enough to detect the LBG halos at reported by Steidel et al. (2011) and the LAE halos at in Matsuda et al. (2012). The depth to detect LAE halos is observationally unknown. From cosmological simulations, Zheng et al. (2011) predicted Ly halo sizes in LAEs. They found two characteristic scales for the halos. The inner steeper one extends to , and the outer flatter one extends to a few tens of arcsec. While our images are not deep enough to detect the outer halos, they are almost deep enough to detect the inner scale halos as seen in Figure 3 of Zheng et al. (2011), where the Ly radial profiles are shown for LAEs in dark matter halos of . As pointed out by Zheng et al. (2011), the size of diffuse Ly emission also depends on the mass of dark matter halo. If the average mass of the dark matter halos in our LAEs is smaller than , our current data may not be able to detect the diffuse Ly emission.
It is also likely that the Ly halos (if they exist) have been diluted to a much lower level during the construction of the stacked images. The stacked images can properly recover Ly halos only when halos are smoothly and symmetrically distributed around galaxies. If halos are highly asymmetric and/or clumpy, the emission of halos will be significantly diluted in average stacked images, and could totally disappear in median stacked images. From the observations of quasars or cosmological simulations, we know that the distribution of IGM at is inhomogeneous (e.g. Fan et al., 2006; Mesinger, 2010). If the distribution of IGM affects the shape of Ly halos (via resonant scattering), the distribution of Ly halos is also likely asymmetric and clumpy.
Finally, it is possible that these LAEs do not have extended Ly halos, or that their halo emission is not as strong as predicted by Zheng et al. (2011), especially when dust is taken into account (e.g. Finkelstein et al., 2011). Zheng et al. (2011) did not consider dust in their simulations. We know that high-redshift LAEs are not free of dust. In particular, the brightest galaxies may exhibit significant dust extinction, as implied by their UV colors (see Paper I). When Ly photons are resonantly scattered by dusty neutral hydrogen, the Ly emission is substantially reduced (Yajima et al., 2012). The reduction is more severe at larger distance from the object, because photons at larger distance need to pass through more dust before they escape. This process would significantly reduce the visibility of possible diffuse Ly emission, and makes it much more difficult to detect it. A much larger sample of LAEs is needed to answer this question.
4.2. Ly-Continuum Misalignment
The comparison between the positions of UV continuum and Ly emission provides useful information on how Ly photons escape from a galaxy. Ly and UV continuum photons are usually come from the same star-forming regions, although Ly photons are likely more sensitive to the regions with more recent star-forming activity. As we mentioned earlier, Ly emission is complicated by resonant scattering and IGM absorption. So the observed position of Ly emission could be different from the position of UV continuum emission. For example, a large positional difference has been found in a galaxy (Rauch et al., 2011). Due to the small sizes of high-redshift galaxies, current ground-based observations are not able to detect these positional differences. We rely on , which has observed a large number of high-redshift galaxies. observations were mostly made for rest-frame UV continuum emission, and there is usually no suitable narrow-band filters for Ly emission. One example for the imaging of Ly emission is the work of Finkelstein et al. (2011), who observed the Ly emission of a small sample of LAEs with a narrow-band filter. They did not find strong evidence of positional misalignment between UV and Ly emission.
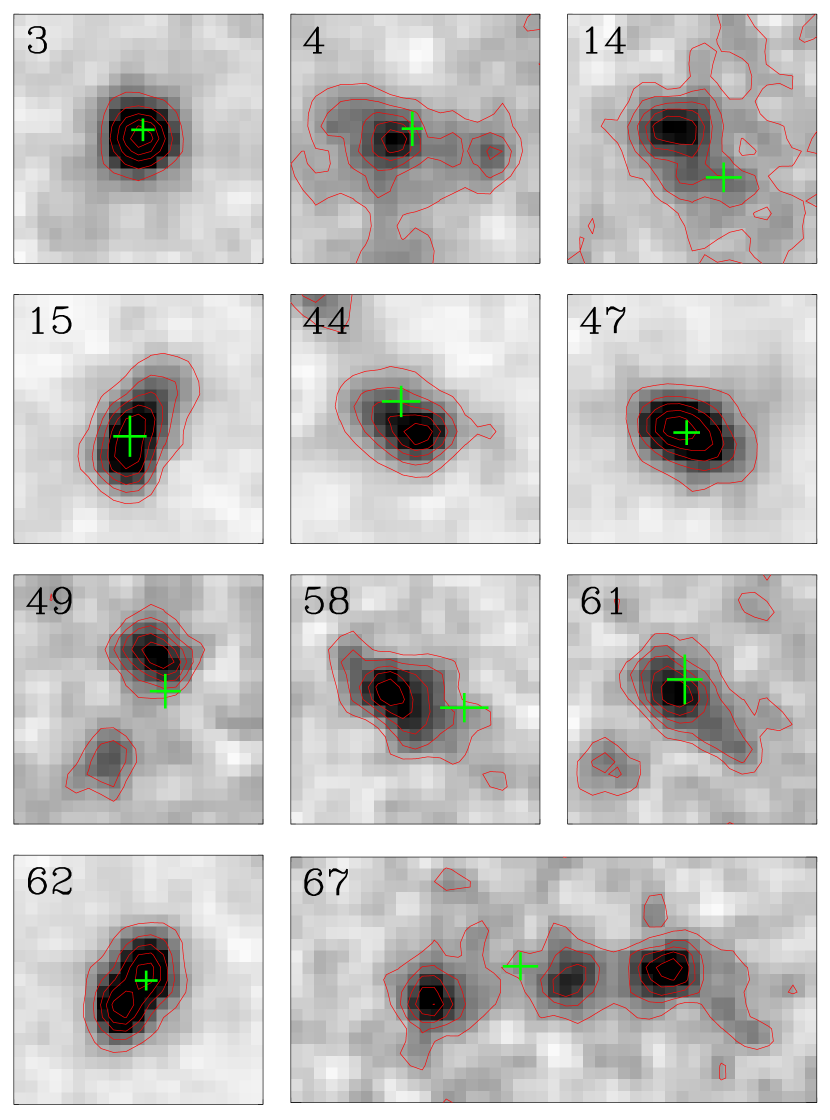
We used our large sample of LAEs to search for possible positional offsets between UV and Ly emission at and 6.5. We used our images as UV continuum images and Subaru narrow-band images as Ly images. As mentioned above, the narrow-band images have excellent PSF FWHM sizes around . During the construction of the images (Paper I), we have matched the coordinates of the images to those of the optical images. To avoid any large-scale variation, we refine the coordinates of the images. For each LAE, we found 10–20 nearby objects that are relatively bright and round. We then matched the positions of the nearby objects in the two sets of images. The typical refinement was smaller than the size of one pixel (). The uncertainty in the object positions, derived from the distribution of the nearby objects, is about the size of 1–2 pixels. We plot the Ly positions on top of the UV continuum positions. Figure 13 shows a few examples of bright galaxies. The red profiles are the contours of the UV emission SB, and the green crosses indicate the positions (and uncertainties) of the Ly emission.
For the majority of the LAEs in our sample, the positions of the UV continuum and Ly emission agree with each other. In particular, we do not find positional misalignment at a significance level of among almost all compact and round LAEs. Object no. 3 in Figure 13 is a typical example, in which the center of the Ly emission is close to the center of the continuum emission. For the merging/interacting systems, however, we see significant positional differences. Figure 13 shows the examples of these systems. They exhibit a variety of Ly positions relative to the peak positions111 For an interacting galaxy, the position of its peak emission (as seen from the SB contour) could be very different from the position of the overall galaxy emission measured by, for example, fitting Gaussian to the marginal x,y distributions (used by IRAF DAOPHOT). Here our positions refer to the positions of peak emission. of the UV continuum emission: 1) Ly positions close to the positions of the brightest components in the UV images, including galaxies no. 15, 47, and 61; 2) Ly positions close to the positions of the fainter components or merger tails in the UV images, including no. 14, 44, and 58; 3) Ly positions are somewhere between the positions of the bright and faint components, but closer to the bright components, including no. 4 and 49. No. 62 and 67 are again interesting. The Ly position of no. 62 is roughly in the middle of the two similarly bright components. No. 67 does not show three distinct Ly emission clumps, as its UV emission does. Instead, it shows a single bright Ly emission core with some extended features. The Ly center is not at any of the three UV clumps. It is between the left and central clumps, and slightly closer to the central one.
Our results suggest that in compact galaxies the observed location of Ly emission does not deviate from its original position, while in merging/interacting systems, the observed Ly location could be significantly different from its original position, without preferential positions of offsets. If the final location of Ly emission is determined by the process of resonant scattering, our results can be explained by the interstellar medium (ISM) distribution (e.g. Finkelstein et al., 2011). In a non-disturbed galaxy, the ISM distribution is relatively symmetric around the object (not necessarily uniform, it could be clumpy). The random scattering of photons does not have preferred directions, so the observed location is still close to its original location. In an interacting system, the ISM is re-distributed by merging activity. The distribution of the disturbed ISM is therefore not symmetric any more. This results in an offset of the observed Ly position.
This result could have an impact on spectroscopy of bright LBGs at (e.g. Stark et al., 2011; Curtis-Lake et al., 2012). While most of the positional offsets in our sample are smaller than , at least two are around . If one uses a slit to identify their Ly emission lines, based on the positions of continuum emission, one could miss them due to the large offsets. However, glaxies with such large offsets are very rare, so this result will not largely reduce the success rate of identifying Ly lines in LBGs.
5. DISCUSSION AND SUMMARY
The comparison in Section 3.1 shows that the sizes of our galaxies are consistent with those of bright LAEs and LBGs in previous studies. This disagrees with the claim of Dow-Hygelund et al. (2007) that LAEs are more compact than LBGs. This is likely because the Dow-Hygelund et al. (2007) sample is very small while LAEs have a large range of sizes. It is indeed difficult to make proper comparisons without a large sample, as the galaxy size depends on redshift and luminosity. Most of our galaxies are LAEs. Another large LAE sample is the LAE sample by Taniguchi et al. (2009), who observed a number of LAEs at with the ACS F814W filter. Although this filter includes Ly emission, it is so wide that its emission is dominated by UV continuum. They found that the average size of the sample is , similar to ours. Among photometrically-selected LBG samples at , a recent large sample is the sample of Grazian et al. (2012). This sample contains a number of bright (as well as faint) LBGs at in the CANDELS field. The sizes of these galaxies are well consistent with those of our galaxies at the same luminosities. Therefore, we conclude that LAEs and LBGs with similar luminosities have similar physical sizes.
In this paper (and Paper I), galaxies found by the narrow-band technique are defined as LAEs and those found by the dropout technique are defined as LBGs. As we discussed in Paper I, this classification only reflects the methodology that we apply to select galaxies. It does not mean that the two types of galaxies are intrinsically different. In Section 5.3 of Paper I, when we derived the UV continuum luminosity function of LAEs, we used another popular definition of LAEs based on the Ly EW, i.e., a galaxy is a LAE if its Ly EW is greater than 20 Å. With this definition, almost all the galaxies in our sample are LAEs. This definition is physically more meaningful, but observationally difficult, because one can easily obtain a flux-limited sample, not a EW-limited sample. We have 16 LBGs (former definition) in our sample. They are not typical LBGs. They are spectroscopically confirmed, and thus only represent those with strong Ly emission. In Paper I we found that our LAEs and LBGs are indistinguishable in many aspects of the Ly and UV continuum properties. In this paper, we further found that these LAEs and LBGs have similar physical sizes and morphological parameters. This confirms one of our conclusions in Paper I that LAEs are a subset of LBGs with strong Ly emission lines.
This paper is the second in a series presenting the physical properties of a large sample of spectroscopically-confirmed galaxies at . The sample consists of 51 LAEs and 16 LBGs, and represents the most luminous galaxies in terms of Ly luminosity (for LAEs) or UV continuum luminosity (for LBGs) in this redshift range. In Paper I we derived various properties of rest-frame UV continuum and Ly emission. In this paper we have conducted a detailed structural and morphological study of the galaxies using deep near-IR images and Subaru narrow-band images. In order to measure the morphology of rest-frame UV continuum emission, we constructed a stacked image for each object by combining its - and -band images. UV morphology was then measured for those with detections (roughly corresponding to mag) in the stacked images.
We have used half-light radius to describe the sizes of galaxies. The intrinsic sizes (at mag) in our sample, after correction for PSF broadening, are from ( kpc) to ( kpc), with a median value of (0.9 kpc). These values are consistent with those of bright, photometrically-selected LBGs at similar redshifts. Additionally, more luminous galaxies tend to have larger sizes, exhibiting a weak size-luminosity relation . The slope 0.14 is significantly flatter than those in fainter LBG samples. Our objects show a wide range of morphology in the images, including compact galaxies and double/multiple component systems. The brightest galaxies in the sample have a large fraction of merging/interacting systems. The fraction of mergers reaches % at mag.
We have tried to describe the structure and morphology of our galaxies using nonparametric methods, including the system, the Gini and parameters. Compared to low-redshift galaxies, these galaxies occupy a smaller range in the parameter space of . Our simulations show that the measurements of these parameters have been systematically biased due to the low resolution of the images. On the other hand, the relative values of these morphological parameters are likely preserved for the vast majority of galaxies. In addition, we found all expected correlations among for the galaxies. These suggest that the parameters probably still meaningful for galaxies at similar redshifts, if they are measured in the images of the same depth and pixel size.
We, for the first time, searched for Ly emission halos around galaxies in narrow-band images. We combined a large number of narrow-band images for LAEs at and 6.5, respectively. The stacked images reached a depth of (). We did not find evidence of extended diffuse Ly emission as predicted by cosmological simulations. It is possible that our images are still not deep enough to detect Ly emission halos, or that the Ly halo emission has been diluted to a much lower level during the construction of the stacked images. It is also possible that the halo emission is not as strong as predicted. A much larger LAE sample is needed to solve this question. We also investigated positional differences between the rest-frame UV continuum emission and Ly emission in LAEs, using the images and optical narrow-band images. While in compact LAEs the two positions are well consistent, in some merging galaxies show significant positional differences, with no preferred directions of offsets. It was explained by the distribution of the disturbed ISM.
References
- Abraham et al. (1996) Abraham, R. G., Tanvir, N. R., Santiago, B. X., et al. 1996, MNRAS, 279, L47
- Abraham & van den Bergh (2001) Abraham, R. G., & van den Bergh, S. 2001, Science, 293, 1273
- Abraham et al. (2003) Abraham, R. G., van den Bergh, S., & Nair, P. 2003, ApJ, 588, 218
- Bershady et al. (2000) Bershady, M. A., Jangren, A., & Conselice, C. J. 2000, AJ, 119, 2645
- Bertin & Arnouts (1996) Bertin, E., & Arnouts, S. 1996, A&AS, 117, 393
- Blanton & Moustakas (2009) Blanton, M. R., & Moustakas, J. 2009, ARA&A, 47, 159
- Bouwens et al. (2006) Bouwens, R. J., Illingworth, G. D., Blakeslee, J. P., & Franx, M. 2006, ApJ, 653, 53
- Brinchmann et al. (1998) Brinchmann, J., Abraham, R., Schade, D., et al. 1998, ApJ, 499, 112
- Cai et al. (2011) Cai, Z., Fan, X., Jiang, L., et al. 2011, ApJ, 736, L28
- Carlberg et al. (2000) Carlberg, R. G., Cohen, J. G., Patton, D. R., et al. 2000, ApJ, 532, L1
- Cassata et al. (2010) Cassata, P., Giavalisco, M., Guo, Y., et al. 2010, ApJ, 714, L79
- Cibinel et al. (2012) Cibinel, A., Carollo, C. M., Lilly, S. J., et al. 2012, arXiv:1206.6108
- Cole et al. (2000) Cole, S., Lacey, C. G., Baugh, C. M., & Frenk, C. S. 2000, MNRAS, 319, 168
- Conselice (2003) Conselice, C. J., 2003, ApJS, 147, 1
- Conselice & Arnold (2009) Conselice, C. J., & Arnold, J. 2009, MNRAS, 397, 208
- Cooke et al. (2010) Cooke, J., Berrier, J. C., Barton, E. J., Bullock, J. S., & Wolfe, A. M. 2010, MNRAS, 403, 1020
- Cowie et al. (2011) Cowie, L. L., Hu, E. M., & Songaila, A. 2011, ApJ, 735, L38
- Curtis-Lake et al. (2012) Curtis-Lake, E., McLure, R. J., Pearce, H. J., et al. 2012, MNRAS, 422, 1425
- Dijkstra & Kramer (2012) Dijkstra, M., & Kramer, R. 2012, MNRAS, 424, 1672
- Dow-Hygelund et al. (2007) Dow-Hygelund, C. C., Holden, B. P., Bouwens, R. J., et al. 2007, ApJ, 660, 47
- Driver et al. (1995) Driver, S. P., Windhorst, R. A., Ostrander, E. J., et al. 1995, ApJ, 449, L23
- Driver et al. (1998) Driver, S. P., Fernandez-Soto, A., Couch, W. J., et al. 1998, ApJ, 496, L93
- Driver et al. (2005) Driver, S. P., Liske, J., Cross, N. J. G., De Propris, R., & Allen, P. D. 2005, MNRAS, 360, 81
- Fan et al. (2006) Fan, X., Carilli, C. L., & Keating, B. 2006, ARA&A, 44, 415
- Feldmeier et al. (2013) Feldmeier, J., Hagen, A., Ciardullo, R., et al. 2013, arXiv:1301.0462
- Ferguson et al. (2004) Ferguson, H. C., Dickinson, M., Giavalisco, M., et al. 2004, ApJ, 600, L107
- Finkelstein et al. (2011) Finkelstein, S. L., Cohen, S. H., Windhorst, R. A., et al. 2011, ApJ, 735, 5
- Furusawa et al. (2008) Furusawa, H., Kosugi, G., Akiyama, M., et al. 2008, ApJS, 176, 1
- Giavalisco et al. (1996) Giavalisco, M., Steidel, C. C., & Macchetto, F. D. 1996, ApJ, 470, 189
- Giavalisco et al. (2004) Giavalisco, M., Ferguson, H. C., Koekemoer, A. M., et al. 2004, ApJ, 600, L93
- Grazian et al. (2012) Grazian, A., Castellano, M., Fontana, A., et al. 2012, A&A, 547, A51
- Grogin et al. (2011) Grogin, N. A., Kocevski, D. D., Faber, S. M., et al. 2011, ApJS, 197, 35
- Gronwall et al. (2011) Gronwall, C., Bond, N. A., Ciardullo, R., et al. ApJ, 743, 9
- Hathi et al. (2008) Hathi, N. P., Jansen, R. A., Windhorst, R. A., et al. 2008, AJ, 135, 156
- Häussler et al. (2007) Häussler, B., McIntosh, D. H., Barden, M., et al. 2007, ApJS, 172, 615
- Huertas-Company et al. (2008) Huertas-Company, M., Rouan, D., Tasca, L., Soucail, G., & Le Fèvre, O. 2008, A&A, 478, 971
- Huertas-Company et al. (2011) Huertas-Company, M., Aguerri, J. A. L., Bernardi, M., Mei, S., & Sánchez Almeida, J. 2011, A&A, 525, A157
- Iye et al. (2006) Iye, M., Ota, K., Kashikawa, N., et al. 2006, Nature, 443, 186
- Jeeson-Daniel et al. (2012) Jeeson-Daniel, A., Ciardi, B., Maio, U., et al. 2012, MNRAS, 424, 2193
- Jiang et al. (2011) Jiang, L., Egami, E., Kashikawa, N., et al. 2011, ApJ, 743, 65
- Jiang et al. (2013) Jiang, L., Egami, E., Mechtley, M., et al. 2013, ApJ, in press (arXiv:1303.0024)
- Kashikawa et al. (2004) Kashikawa, N., Shimasaku, K., Yasuda, N., et al. 2004, PASJ, 56, 1011
- Kashikawa et al. (2006) Kashikawa, N., Shimasaku, K., Malkan, M. A., et al. 2006, ApJ, 648, 7
- Kashikawa et al. (2011) Kashikawa, N., Shimasaku, K., Matsuda, Y., et al. 2011, ApJ, 734, 119
- Kashikawa et al. (2012) Kashikawa, N., Nagao, T., Toshikawa, J., et al. 2012, ApJ, 761, 85
- Koekemoer et al. (2011) Koekemoer, A. M., Faber, S. M., Ferguson, H. C., et al. 2011, ApJS, 197, 36
- Komatsu et al. (2011) Komatsu, E., Smith, K. M., Dunkley, J., et al. 2011, ApJS, 192, 18
- Law et al. (2007) Law, D. R., Steidel, C. C., Erb, D. K., et al. 2007, ApJ, 656, 1
- Law et al. (2012) Law, D. R., Steidel, C. C., Shapley, A. E., et al. 2012, ApJ, 745, 85
- Le Fèvre et al. (2000) Le Fèvre, O., Abraham, R., Lilly, S. J., et al. 2000, MNRAS, 311, 565
- Lilly et al. (1998) Lilly, S., Schade, D., Ellis, R., et al. 1998, ApJ, 500, 75
- Lisker (2008) Lisker, T. 2008, ApJS, 179, 319
- Lotz et al. (2004) Lotz, J. M., Primack, J., & Madau, P. 2004, AJ, 128, 163
- Lotz et al. (2006) Lotz, J. M., Madau, P., Giavalisco, M., Primack, J., & Ferguson, H. C. 2006, ApJ, 636, 592
- Lotz et al. (2008) Lotz, J. M., Davis, M., Faber, S. M., et al. 2008, ApJ, 672, 177
- Lowenthal et al. (1997) Lowenthal, J. D., Koo, D. C., Guzman, R., et al. 1997, ApJ, 481, 673
- Malhotra et al. (2012) Malhotra, S., Rhoads, J. E., Finkelstein, S. L., et al. 2012, ApJ, 750, L36
- Matsuda et al. (2012) Matsuda, Y., Yamada, T., Hayashino, T., et al. 2012, MNRAS, 425, 878
- Mesinger (2010) Mesinger, A. 2010, MNRAS, 407, 1328
- Mosleh et al. (2012) Mosleh, M., Williams, R. J., Franx, M., et al. 2012, ApJ, 756, L12
- Nagao et al. (2004) Nagao, T., Taniguchi, Y., Kashikawa, N., et al. 2004, ApJ, 613, L9
- Nagao et al. (2005) Nagao, T., Kashikawa, N., Malkan, M. A., et al. 2005, ApJ, 634, 142
- Nagao et al. (2007) Nagao, T., Murayama, T., Maiolino, R., et al. 2007, A&A, 468, 877
- Oesch et al. (2010) Oesch, P. A., Bouwens, R. J., Carollo, C. M., et al. 2010, ApJ, 709, L21
- Oke & Gunn (1983) Oke, J. B., & Gunn, J. E. 1983, ApJ, 266, 713
- Ono et al. (2012) Ono, Y., Ouchi, M., Curtis-Lake, E., et al. 2012, arXiv:1212.3869
- Ouchi et al. (2008) Ouchi, M., et al. 2008, ApJS, 176, 301
- Ouchi et al. (2009) Ouchi, M., Mobasher, B., Shimasaku, K., et al. 2009, ApJ, 706, 1136
- Ouchi et al. (2010) Ouchi, M., Shimasaku, K., Furusawa, H., et al. 2010, ApJ, 723, 869
- Ota et al. (2008) Ota, K., Kashikawa, N., Malkan, M. A., et al. 2008, arXiv:0804.3448
- Peng et al. (2002) Peng, C. Y., Ho, L. C., Impey, C. D., & Rix, H.-W. 2002, AJ, 124, 266
- Pirzkal et al. (2007) Pirzkal, N., Malhotra, S., Rhoads, J. E., & Xu, C. 2007, ApJ, 667, 49
- Rauch et al. (2011) Rauch, M., Becker, G. D., Haehnelt, M. G., et al. 2011, MNRAS, 418, 1115
- Ravindranath et al. (2006) Ravindranath, S., Giavalisco, M., Ferguson, H. C., et al. 2006, ApJ, 652, 963
- Schade et al. (1999) Schade, D., et al. 1999, ApJ, 525, 31
- Shi et al. (2009) Shi, Y., Rieke, G., Lotz, J., & Perez-Gonzalez, P. G. 2009, ApJ, 697, 1764
- Shimasaku et al. (2006) Shimasaku, K., Kashikawa, N., Doi, M., et al. 2006, PASJ, 58, 313
- Stanway et al. (2004) Stanway, E. R., Glazebrook, K., Bunker, A. J., et al. 2004, ApJ, 604, L13
- Stark et al. (2011) Stark, D. P., Ellis, R. S., & Ouchi, M. 2011, ApJ, 728, L2
- Steidel et al. (2011) Steidel, C. C., Bogosavljević, M., Shapley, A. E., et al. 2011, ApJ, 736, 160
- Taniguchi et al. (2005) Taniguchi, Y., Ajiki, M., Nagao, T., et al. 2005, PASJ, 57, 165
- Taniguchi et al. (2009) Taniguchi, Y., Murayama, T., Scoville, N. Z., et al. 2009, ApJ, 701, 915
- Taylor-Mager et al. (2007) Taylor-Mager, V. A., Conselice, C. J., Windhorst, R. A., & Jansen, R. A. 2007, ApJ, 659, 162
- Toshikawa et al. (2012) Toshikawa, J., Kashikawa, N., Ota, K., et al. 2012, ApJ, 750, 137
- van den Bergh et al. (2000) van den Bergh, S., Cohen, J. G., Hogg, D. W., & Blandford, R. 2000, AJ, 120, 2190
- van der Wel et al. (2012) van der Wel, A., Bell, E. F., Häussler, B., et al. 2012, ApJS, 203, 24
- Venemans et al. (2005) Venemans, B. P., Röttgering, H. J. A., Miley, G. K., et al. 2005, A&A, 431, 793
- White & Rees (1978) White, S. D. M., & Rees, M. J. 1978, MNRAS, 183, 341
- Windhorst et al. (2002) Windhorst, R. A., Taylor, V. A., Jansen, R. A., et al. 2002, ApJS, 143, 113
- Windhorst et al. (2008) Windhorst, R. A., Hathi, N. P., Cohen, S. H., et al. 2008, Advances in Space Research, 41, 1965
- Windhorst et al. (2011) Windhorst, R. A., Cohen, S. H., Hathi, N. P., et al. 2011, ApJS, 193, 27
- Yajima et al. (2012) Yajima, H., Li, Y., Zhu, Q., & Abel, T. 2012, MNRAS, 424, 884
- Zheng et al. (2011) Zheng, Z., Cen, R., Weinberg, D., Trac, H., & Miralda-Escudé, J. 2011, ApJ, 739, 62