11email: pgrosbol@eso.org 22institutetext: Instituto de Física, Univ. Federal do Rio Grande do Sul, Av. Bento Gonçalves 9500, 91501-970 Porto Alegre, RS, Brazil
22email: dottori@ufrgs.br
Mortality and dust expulsion in early phases of stellar clusters††thanks: Based on observations collected at the European Southern Observatory, Chile; program: ESO 82.B-0331
Abstract
Context. It is often argued that young stellar clusters suffer a significant infant mortality that is partly related to the expulsion of dust and gas in their early phases caused by radiation pressure from hot stars and supernovae. Near-infrared (J-K)–MK diagrams of young stellar clusters in nearby spiral galaxies show a bi-modal distribution that is consistent with a fast decline of their intrinsic extinction at an early epoch.
Aims. The distinct features in the color-magnitude diagrams (CMD) and the fast change of colors for the youngest clusters allow us to place constraints on their early evolutionary phases, including the time scale for the decreasing extinction caused for instance by gas and dust expulsion.
Methods. Monte Carlo simulations of cluster populations were performed using the power-law distribution function . Integrated colors were computed from Starburst99 models. The simulated near-infrared CMD were compared with those observed for six grand-design, spiral galaxies using statistical goodness-of-fit tests.
Results. The CMDs indicate a significant mortality of young, massive clusters with = -1.4. High initial extinction AV = 8-11m and strong nebular emission are required to reproduce the bi-modal color distributions of the clusters. An extended star formation phase of longer than 5 Myr is suggested. The reduction of the internal extinction of the clusters starts during their active star formation and lasts for a period of 5-10 Myr.
Key Words.:
Stars: formation - Galaxies: star clusters: general - Galaxies: spiral - Methods: statistical - Infrared: general1 Introduction
Based on the statistics of embedded clusters in the Galaxy, Lada & Lada (2003) concluded that a high fraction of young proto-clusters will dissolve while only a few percent are likely to become bound clusters. Several reasons for this ‘infant mortality’ have been brought forward, such as an expulsion of dust and gas by hot stars or supernovae (Tutukov 1978; Whitworth 1979; Goodwin & Bastian 2006; Bastian & Goodwin 2006) and dynamic effects (Lamers & Glieles 2006; Gieles et al. 2007; Wielen 1977). The main effect of the dust and gas expulsion is the reduction of the total cluster potential, which makes the cluster more vulnerable to perturbations and eventual disruption.
The dissolution time for clusters has been evaluated by comparing the sizes of old and young cluster populations assuming a nearly constant formation rate. This was performed for the solar neighborhood (Lamers et al. 2005; Piskunov et al. 2006), whose dissolution time was estimated to be in the range of 0.3-1.0 Gyr for a 104 M☉ cluster with a power-law dependency on mass. Several nearby galaxies were investigated (Boutloukos & Lamers 2003; Scheepmaker et al. 2009) and show a significant spread in from 40 Myr for the inner parts of M51 to 8 Gyr for the Small Magellanic Cloud. Chandar et al. (2010) used a cluster distribution function (CDF) depending on cluster mass and time to analyze the clusters in the Large Magellanic Cloud. They determined an age exponent , while Gieles & Bastian (2008) found a flat distribution with no significant age dependency.
The distributions of cluster complexes in ten nearby, grand-design spiral galaxies were studied by Grosbøl & Dottori (2012) using near-infrared (NIR) colors. They found observational evidence for a fast reduction of the extinction in young clusters because their colors were clearly separated from those of the older clusters with lower reddening.
In the current paper, we analyze the NIR color-magnitude distributions of cluster complexes in several nearby spirals to estimate parameters for the dust expulsion phase and the dissolution of young clusters. The data and models used to reproduce them are described in the two following sections. The fitting procedure and general behavior of the main model parameters are given in section 4, while results and conclusions are provided in the last section.
2 Data
We selected six of the grand-design spirals of the study by Grosbøl & Dottori (2012), for which more than 2000 cluster complexes were identified. The galaxies were observed in the NIR JHKs-bands with HAWK-I at the Very Large Telescope and are listed in Table 1 together with their assumed distances estimated from their systemic velocity relative to the 3K cosmic microwave background using a Hubble constant of 73 km s-1 Mpc-1. The average seeing on the Ks-maps was around 04, which yields a linear resolution in the range of 20-40 pc. This is not enough to distinguish individual clusters, therefore many of the sources detected are likely to be cluster complexes. The total number of sources Ns detected on the Ks-images and the limiting magnitude Kl for a 90% completeness level are provided in Table 1.
| Galaxy | D | Kl | Ns | M | Nc | |
|---|---|---|---|---|---|---|
| NGC 157 | 18.0 | 20.2 | 2254 | -11.1 | 569 | -1.62 |
| NGC 1232 | 19.8 | 20.6 | 3177 | -10.9 | 927 | -2.37 |
| NGC 1365 | 21.1 | 20.2 | 2417 | -11.5 | 827 | -1.97 |
| NGC 2997 | 19.2 | 20.1 | 5313 | -11.3 | 1757 | -2.29 |
| NGC 5247 | 22.6 | 19.8 | 2259 | -12.0 | 785 | -2.19 |
| NGC 7424 | 9.5 | 20.8 | 6137 | -9.7 | 1212 | -1.76 |
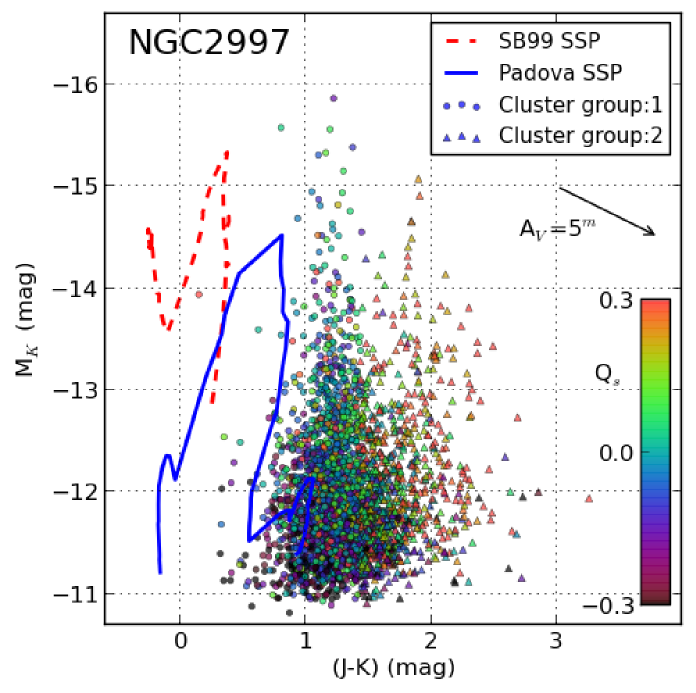
A typical distribution of clusters in a color-color diagram (CCD) is shown for NGC 2997 in Fig. 1, where cluster evolutionary tracks (CET) for single-burst stellar population (SSP) models from Padova (Marigo et al. 2008) and Starburst99 (Leitherer et al. 1999; Vázquez & Leitherer 2005, hereafter SB99) are plotted for reference. The main difference between the two sets of CETs is the inclusion of nebular emissions in the SB99 models. Reddening vectors for a visual extinction = 5m are also indicated for a standard Galactic ‘screen’ model (Indebetouw et al. 2005) and a ’dusty’ environment (Witt et al. 1992; Israel et al. 1998). Two groups can be distinguished, a densely populated group close to the old end of the CETs and one around (08, 11), which is composed of young clusters, strongly attenuated by dust. These groups can also be seen on a color-magnitude diagram (CMD) as two separate branches (see Fig. 2), which suggests that clusters suffer a fast reduction of extinction at an early evolutionary phase.
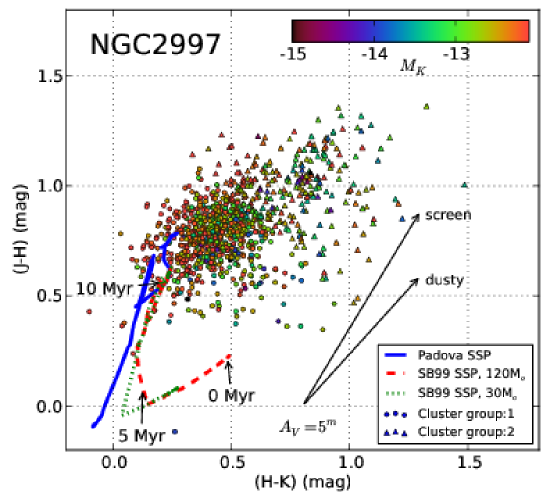
These two distinct groups of cluster complexes can be identified in all six spirals. Whereas their absolute colors will depend on the detailed parameters of the underlying stellar population (e.g., initial mass function (IMF), and metallicity), the relative positions of the two groups are more directly determined by their early history, such as amount of extinction and evolutionary time scale. The clusters were separated into two groups by applying a k-means clustering algorithm (MacQueen 1967) to ensure an objective procedure. The grouping is shown in Figs. 1 and 2 with different symbols. The older group contains 60-70% of the clusters and their color difference is (J-K) 07.
3 Models
A simple model was created to fit the NIR CMDs of stellar clusters as observed in the galaxies. The foundation of the model was a CDF with a power-law dependence on cluster final mass and age (Chandar et al. 2010). A constant formation rate was assumed for the galaxies. The actual mass of a single cluster was computed assuming that it had a star formation rate SFR = till , after which star formation terminated. The intrinsic NIR magnitudes of the clusters were obtained using their actual masses and ages to interpolate in the SSP models from SB99 (v6.0.2). The age spread within the youngest clusters was taken into account by applying appropriate weights. A Kroupa IMF (Kroupa 2001) was used for the individual clusters. The upper limits of stellar masses for the IMF was varied in the range 30-120 M☉. To estimate the importance of nebular emission for the intrinsic colors for young clusters, models with and without emission were computed.
The general distribution in the CCDs indicates that attenuation by dust is very important at early stages, while later it becomes small. This was modeled by applying an extinction up to an age after which it decreased linearly to over a time . A simple scenario, where supernovae expel gas and dust from the cluster and thereby stop star formation, suggests that . In the more general case where hot stars also erode nearby dust and molecular clouds (Whitworth 1979), and may be similar or even reversed.
The wavelength dependency of extinction was assumed to follow a power-law (Martin & Whittet 1990). A Galactic screen model for extinction (Indebetouw et al. 2005) is reproduced by , while 1.3 gives RV = 3.0 (Turner 1998). Exponents around 0.5 yield values of E(H-K)/E(J-H) typical for integrated light from a dusty, star-forming environment (Witt et al. 1992; Israel et al. 1998). Finally, Gaussian errors were added to intrinsic colors and extinction applied to simulate observational errors and spread in cluster initial conditions.
The model code was written in Python using the scipy package to generate and analyze the CDFs. The clusters were created in the age range - Myr to cover the observed CMDs. Their final masses were in the range of -M☉ except for NGC 7424, for which a ten times lower mass range was used to match its fainter clusters. The model CDF constituted the empirical probability function to which the observed CDFs were compared with a Kolmogorov-Smirnov (KS) test. A typical model contained clusters to ensure that all parts of the distributions were well populated. This number was increased, if needed, so that the number of simulated clusters brighter than the MK-limit applied was at least five times larger than the observed population to ensure a smaller statistical fluctuation in the reference distribution.
| CMD fit | CCD fit | |||||||||
|---|---|---|---|---|---|---|---|---|---|---|
| Galaxy | Mu | D̂cmd | D̂ccd | |||||||
| NGC 157 | 60 | -1.1 | 3.4 | 10.6 | 7.0 | 1.11 | 2.1 | 7.1 | 6.4 | 2.08 |
| NGC 157 | 100 | -1.2 | 3.1 | 8.6 | 6.9 | 1.09 | 1.7 | 6.7 | 6.8 | 1.66 |
| NGC 157 | 120 | -1.0 | 3.5 | 8.7 | 6.8 | 0.67 | 1.7 | 6.5 | 6.7 | 1.51 |
| NGC 1232 | 60 | -1.9 | 3.0 | 10.3 | 7.0 | 1.68 | 2.2 | 7.2 | 6.1 | 2.40 |
| NGC 1232 | 100 | -1.9 | 3.3 | 11.6 | 6.9 | 1.12 | 2.5 | 6.3 | 7.1 | 1.86 |
| NGC 1232 | 120 | -1.7 | 3.4 | 10.4 | 6.9 | 1.44 | 2.2 | 6.2 | 7.0 | 1.79 |
| NGC 1365 | 60 | -1.6 | 3.9 | 10.9 | 6.9 | 1.35 | 2.3 | 7.0 | 6.1 | 2.26 |
| NGC 1365 | 100 | -1.5 | 4.0 | 10.4 | 6.7 | 0.79 | 2.4 | 6.1 | 6.5 | 1.76 |
| NGC 1365 | 120 | -1.1 | 3.8 | 10.2 | 6.7 | 0.65 | 2.2 | 6.1 | 6.6 | 1.80 |
| NGC 2997 | 60 | -2.4 | 4.1 | 9.2 | 6.8 | 0.86 | 1.6 | 6.0 | 6.9 | 2.21 |
| NGC 2997 | 100 | -1.9 | 3.8 | 10.1 | 6.7 | 0.70 | 1.5 | 6.3 | 6.4 | 2.38 |
| NGC 2997 | 120 | -1.0 | 4.0 | 11.0 | 6.7 | 0.92 | 2.0 | 6.1 | 7.0 | 2.96 |
| NGC 5247 | 60 | -1.5 | 3.9 | 11.3 | 7.5 | 2.13 | 1.8 | 7.4 | 6.8 | 2.39 |
| NGC 5247 | 100 | -1.5 | 4.2 | 11.7 | 7.0 | 1.16 | 2.2 | 6.9 | 7.0 | 1.63 |
| NGC 5247 | 120 | -1.8 | 3.0 | 11.2 | 7.0 | 1.09 | 1.9 | 6.0 | 7.2 | 1.34 |
| NGC 7424 | 60 | -1.2 | 3.3 | 11.1 | 7.0 | 1.65 | 2.1 | 7.0 | 6.5 | 3.66 |
| NGC 7424 | 100 | -0.9 | 3.5 | 11.3 | 6.7 | 0.76 | 2.0 | 6.2 | 6.8 | 2.85 |
| NGC 7424 | 120 | -0.9 | 3.9 | 10.3 | 6.6 | 2.27 | 2.2 | 6.4 | 6.5 | 2.77 |
4 Fitting procedure and results
The JHK colors of the model clusters depend in a complex way on the eight model parameters and the adopted CET. A partial fitting procedure to minimize the KS test statistics was applied for each CET because different features of the distributions were more sensitive to some parameters than to others. First, the extinctions and were estimated by fitting the (J-K) values of the old and young branches in the CMD while their population ratio gave a preliminary value of . The magnitude distribution and the relative importance of the two branches in the CMD are mainly depending on , , , , and . Due to the limited age information available for the old clusters, and could not be separated. Thus, was fixed to the value derived for young clusters by Grosbøl & Dottori (2012) as listed in Table 1. Only clusters one magnitude brighter than M were considered for the fits to avoid any bias due to incompleteness of faint clusters. The relative colors of the two groups are sensitive to the parameters , , and , which were estimated from the CCD.
The lowest value of the KS test statistics was estimated first by following the steepest gradient using 01 and 05 bins for color indexes and magnitude, respectively. Because the test function had an uneven surface and could have several local minima, a grid of the parameter values was computed around the minimum found by the gradient search to ensure that the deepest minimum was located. Although the model with the KS minimum represents the ‘best’ fit, it depends mainly on the more populated group of older clusters and may not reproduce the colors of the young clusters accurately.
Models with or without nebular emission were also computed but had in all cases significantly higher KS values. The parameter values for the three best models are listed in Table 2 including the level of significance expressed as the population-corrected critical value D̂, where 1.22 corresponds to a 10% level.
The effects of statistical fluctuation cannot be entirely neglected even with samples of clusters because the high-luminosity tail of the distributions is significant. The statistical variation was estimated by computing five identical models with different seeds for the random number generator. These tests indicate that the parameters may fluctuate by 10% due to Monte Carlo sampling effects.
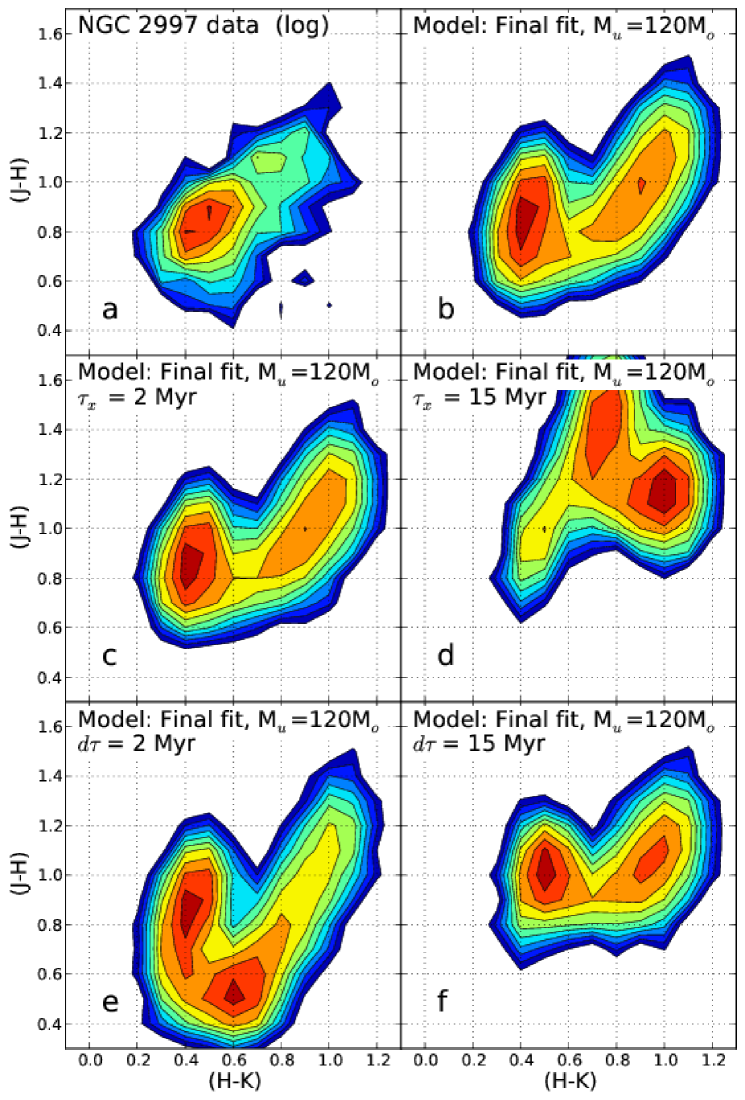
The cluster distribution in the CCD is illustrated in Fig. 3 with logarithmic contours for both the observed cluster population of NGC 2997 and the corresponding model for Mu = 120 M☉. Although the bi-modal distribution is clearly visible, a significant amount of model clusters with (H-K) 09 does not agree with the observations. A smaller amount of nebular emission (e.g., due to a clumpy interstellar medium) would move the young clusters closer to the location observed. The effects from changing to 2 and 15 Myr are displayed in Figs. 3c-d, while Figs. 3e-f give a similar variation of . High values of yield an extra peak in the color distribution with (J-H) = 14, whereas too many clusters with (J-H) 06 are observed for low values of . The observed color distribution can best be modeled by an early start of the decrease in cluster extinction. The decline is likely to last for about 10 Myr. Most models display a bridge between the young and old groups that curves toward low (J-H) values and reflects the shape of the CET. The selection of a better CET requires detailed spectroscopic information and is beyond the scope of the current paper.
5 Discussion and conclusion
The models suggest that nebular emission is significant and must be included to account for the NIR colors of young clusters. A reddening law with around 1.8 or slightly above provides better fits than lower exponents, but a smaller amount of nebular emission assumed for the CETs (e.g. due to a clumpy medium) would favor lower values of . A high mass limit Mu in the range of 100-120 M☉ is preferred in most cases. It is mainly constrained by the color of the young clusters.
The initial value of the average extinction for the cluster complexes lies in the range of 8-11m, while the final extinction is about 3-4m. The latter value is close to zero if the Padova CETs are used (see Fig. 2). These values are consistent with the sources being complexes of young, highly obscured clusters as seen by Chené et al. (2013). The linear resolution could also play a role, although no clear trend is apparent.
All fits suggest a higher mortality of the young, massive complexes with = -1.40.5 than was found by Fall & Chandar (2012) with = -0.8 for a number of different types of galaxies. This indicates that the mortality for very massive complexes is higher than for individual clusters; that is, young complexes may disintegrate into smaller clusters, which are below the limiting magnitude of the current study.
The duration of the continuous star formation phase is at least 5 Myr for all galaxies. In general, the extinction starts to decrease before the star formation ceases, indicated by . Simulations with the extreme values of 2 and 15 Myr for and favor shorter and longer .
This suggests a star formation scenario where high-mass cluster complexes (i.e., M☉) form stars during an extended period of several Myr. The reduction of the internal extinction starts before the star formation terminates. The time scales suggest that the expulsion of dust is initiated by the first supernovae of heavy stars. Owing to the large mass of the cluster complexes, the first supernovae may not be able to disrupt the giant molecular cloud (GMC) and star formation continues for some time until enough supernovae have exploded to destroy the GMC. A fragmentation of the initial GMC into individual star-forming regions with slightly different evolution time scales would also yield a simultaneous reduction of absorption and star formation in the complexes.
Acknowledgements.
We thank an anonymous referee for helpful comments. HD thanks the Brazilian Council of Research CNPq, Brazil, for support.References
- Bastian & Goodwin (2006) Bastian, N. & Goodwin, S. P. 2006, MNRAS, 369, L9
- Boutloukos & Lamers (2003) Boutloukos, S. G. & Lamers, H. J. G. L. M. 2003, MNRAS, 338, 717
- Chandar et al. (2010) Chandar, R., Whitmore, B. C., & Fall, S. M. 2010, ApJ, 713, 1343
- Chené et al. (2013) Chené, A.-N., Borissova, J., Bonatto, C., et al. 2013, A&A, 549, A98
- Fall & Chandar (2012) Fall, S. M. & Chandar, R. 2012, ApJ, 752, 96
- Gieles et al. (2007) Gieles, M., Athanassoula, E., & Portegies Zwart, S. F. 2007, MNRAS, 376, 809
- Gieles & Bastian (2008) Gieles, M. & Bastian, N. 2008, A&A, 482, 165
- Goodwin & Bastian (2006) Goodwin, S. P. & Bastian, N. 2006, MNRAS, 373, 752
- Grosbøl & Dottori (2012) Grosbøl, P. & Dottori, H. 2012, A&A, 542, A39
- Indebetouw et al. (2005) Indebetouw, R., Mathis, J. S., Babler, B. L., et al. 2005, ApJ, 619, 931
- Israel et al. (1998) Israel, F. P., van der Werf, P. P., Hawarden, T. G., & Aspin, C. 1998, A&A, 336, 433
- Kroupa (2001) Kroupa, P. 2001, MNRAS, 322, 231
- Lada & Lada (2003) Lada, C. J. & Lada, E. A. 2003, ARA&A, 41, 57
- Lamers et al. (2005) Lamers, H. J. G. L. M., Gieles, M., Bastian, N., et al. 2005, A&A, 441, 117
- Lamers & Glieles (2006) Lamers, H. J. G. L. M. & Glieles, M. 2006, A&A, 455, L17
- Leitherer et al. (1999) Leitherer, C., Schaerer, D., Goldader, J. D., et al. 1999, ApJS, 123, 3
- MacQueen (1967) MacQueen, J. 1967, in Proc. 5th Berkeley Symp. on Math. Statist. and Prob., Vol. 1 (Univ. of Calif. Press), 281–297
- Marigo et al. (2008) Marigo, P., Girardi, L., Bressan, A., et al. 2008, A&A, 482, 883
- Martin & Whittet (1990) Martin, P. G. & Whittet, D. C. B. 1990, ApJ, 357, 113
- Piskunov et al. (2006) Piskunov, A. E., Kharchenko, N. V., Röser, S., Schilbach, E., & Scholz, R.-D. 2006, A&A, 445, 545
- Scheepmaker et al. (2009) Scheepmaker, R. A., Lamers, H. J. G. L. M., Anders, P., & Larsen, S. S. 2009, A&A, 494, 81
- Turner (1998) Turner, D. G. 1998, AJ, 98, 2300
- Tutukov (1978) Tutukov, A. V. 1978, A&A, 70, 57
- Vázquez & Leitherer (2005) Vázquez, G. A. & Leitherer, C. 2005, ApJ, 621, 695
- Whitworth (1979) Whitworth, A. 1979, MNRAS, 186, 59
- Wielen (1977) Wielen, R. 1977, A&A, 60, 263
- Witt et al. (1992) Witt, A. N., Thronson, H. A., & Capuano, Jr., J. M. 1992, ApJ, 393, 611