Probing the Earliest Stage of Protostellar Evolution
— Barnard 1-bN and Barnard 1-bS
Abstract
Two submm/mm sources in the Barnard 1b (B1-b) core, B1-bN and B1-bS, have been observed with the Submillimeter Array (SMA) and the Submillimeter Telescope (SMT). The 1.1 mm continuum map obtained with the SMA reveals that the two sources contain spatially compact components, suggesting that they harbor protostars. The N2D+ and N2H+ =3–2 maps were obtained by combining the SMA and SMT data. The N2D+ map clearly shows two peaks at the continuum positions. The N2H+ map also peaks at the continuum positions, but is more dominated by the spatially extended component. The N2D+/N2H+ ratio was estimated to be 0.2 at the positions of both B1-bN and B1-bS. The derived N2D+/N2H+ ratio is comparable to those of the prestellar cores in the late evolutionary stage and the class 0 protostars in the early evolutionary stage. Although B1-bN is bright in N2H+ and N2D+, this source was barely seen in H13CO+. This implies that the depletion of carbon-bearing molecules is significant in B1-bN. The chemical property suggests that B1-bN is in the earlier evolutionary stage as compared to B1-bS with the H13CO+ counterpart. The N2H+ and N2D+ lines show that the radial velocities of the two sources are different by 0.9 km s-1. However, the velocity pattern along the line through B1-bN and B1-bS suggests that these two sources were not formed out of a single rotating cloud. It is likely that the B1-b core consists of two velocity components, each of which harbors a very young source.
Subject headings:
Stars: formation – Stars: individual: B1-bN – Stars: individual: B1-bS1. INTRODUCTION
The object formed at the beginning of the star-formation process, the first hydrostatic core, was theoretically predicted by Larson (1969). Since the first hydrostatic core is in the transient stage between starless and protostellar cores, it is a key object to understand how stars are formed in molecular clouds. In the spherical symmetric case, first hydrostatic cores are extremely short-lived, making the expected number of them only few hundredth of Class 0 protostars (Omukai, 2007; Masunaga & Inutsuka, 2000). On the other hand, recent numerical simulations have shown that the rotating first cores can survive longer (Saigo et al., 2008; Saigo & Tomisaka, 2006), providing more opportunities to observe them. Lately, some candidates for first cores have been reported (e.g., Chen et al., 2010; Enoch et al., 2010; Pineda et al., 2011; Chen et al., 2012); they have extremely low luminosity of 0.1 L☉ and are not detectable at wavelengths shorter than 24 m. However, the nature of these newly discovered sources have not been well understood yet.
The chemical properties are also useful tools to characterize the evolutionary stage of prestellar and protostellar cores. In the cold ( 10 K) and dense ( 104 cm-3) environment, carbon–bearing species such as CO and CS condense onto dust grains (Caselli et al., 2002; Tafalla et al., 2002). In contrast, nitrogen–bearing species remain in the gas phase longer (Bergin & Langer, 1997; Belloche & André, 2004). It is known that N2H+ and N2D+ lines are considered to be good tracers of cold dense gas because their abundances increase considerably if the CO is depleted. Observations of prestellar cores show that the spacial distributions of N2H+ and N2D+ well agree with that of dust continuum emission. In addition, in the cold and dense environment, the abundance of deuterium isotopologues is known to be enhanced significantly as compared to the elemental D/H ratio of 1.5 10-5 (Oliveira, 2003). The N2D+/N2H+ ratio derived in a sample of prestellar cores ranges from 0.05 to 0.4 (Crapsi et al., 2005; Gerin et al., 2001). There is a tight correlation between N2D+/N2H+ ratio and the CO depletion factor (Crapsi et al., 2005). Once a protostar is formed in the core, the protostar warms up its environment and starts evaporating CO into the gas phase. As a result, the N2D+/N2H+ ratio drops as the protostar evolves (Emprechtinger et al., 2009). These results suggest that the N2D+/N2H+ ratio can be used as an indicator of evolution in both prestellar and protostellar cores. Especially protostellar cores with high N2D+/N2H+ ratio are particularly important because they are considered to be in a stage shortly after the formation of the central source.
In this study, we present the N2H+ =3-2 and N2D+ =3-2 observations with the Submillimeter Array (SMA)111The Submillimeter Array (SMA) is a joint project between the Smithsonian Astrophysical Observatory and the Academia Sinica Institute of Astronomy and Astrophysics and is funded by the Smithsonian Institute and the Academia Sinica.
and the Submillimeter Telescope (SMT) toward two sources embedded in the Barnard 1 (B1) dark cloud (d=25050 pc; Černis
& Straižys, 2003; Hirota et al., 2008), which is part of the Perseus molecular cloud complex. These two sources, labeled as Barnard 1-bN (B1-bN) and Barnard 1-bS (B1-bS) by Hirano et al. (1999), have no counterparts in the Spitzer images taken by the ”From Molecular Cores to Planet Forming Disks” (c2d; Evans et al., 2003) survey in all four bands of IRAC, and 24 m, 70 m bands of MIPS (Jørgensen et al., 2004; Rebull et al., 2007). Both sources reveal the similar SEDs, which show extremely low dust temperatures of 20 K (Hirano & Liu, 2013). Recently, Pezzuto et al. (2012) detected the far-infrared emission from B1-bN and B1-bS using the Herschel Space Observatory. On the basis of the SEDs, they proposed that B1-bN and B1-bS are first core candidates.
2. OBSERVATIONS
2.1. Millimeter-interferometer Observations — SMA
SMA observations of the N2H+ =3-2 line were made on 2008 September 3. The array was in the subcompact configuration with seven antennas. The primary-beam of the 6 m diameter antennas at 279 GHz was measured to be 45. The phase tracking center of the N2H+ =3-2 observations was at (2000) = 333214 and (2000) = 3107353. The spectral resolution mode was set to 101.6 kHz (1024 channels per 104 MHz chunk) for the N2H+ =3-2. The corresponding velocity resolution is 0.11 km s-1. A pair of nearby quasars, 3C84 and 3C111, were used for gain calibration. Uranus was used for bandpass and absolute flux calibrations.
Observations of the N2D+ =3-2 line were carried out on 2007 September 10th and 11th. The array was in the subcompact configuration. The primary-beam size of the antenna at 230 GHz was measured to be 54. The phase tracking center was at the same position as the N2H+ observations. The frequency resolution was set to be 101.6 kHz, which corresponds to a velocity resolution of 0.13 km s-1. The N2D+ =3-2 line was observed simultaneously with the CO =2-1, 13CO =2-1, C18O =2-1, and 230 GHz continuum, which will be presented in the separate paper by Hirano & Liu (2013).
The visibility data were calibrated and edited using the MIR software package. The calibrated visibility data were Fourier–transformed and CLEANed with MIRIAD (Sault et al., 1995), using natural weighting. The synthesized beam sizes were 453 321 with a position angle (P.A.) of 44.0 for the N2H+ =3-2 and 608 317 with a P.A. of 49.2 for the N2D+ =3-2.
The 1.1 mm continuum data were obtained by averaging the line-free channels of the N2H+ =3-2 observations. The 1.1 mm continuum map had a resolution of 453 321, and the rms noise level of 0.35 mJy beam-1.
2.2. Single-dish Observations — SMT
Observations of the N2H+ =3-2 and N2D+ =3-2 lines toward B1-b region were undertaken with the Arizona Radio Observatory sub-millimeter Telescope (SMT) in 2008 November and December. In both lines, we made a 9 9 point map with a grid spacing of 10. The map covers an area of 1.5 1.5 in right ascension and declination centered at (2000) = 33356 and (2000) = 3109348. We used the 1.3 mm receiver system equipped with sideband separating mixers. The main-beam efficiency of the telescope was 0.74. The half-power beam widths (HPBW) were 27 and 33 in the N2H+ =3-2 and N2D+ =3-2 observations, respectively. For the N2H+ =3-2 observations, we used the chirp transform spectrometer (CTS), which provided a spectral resolution of 0.04 MHz. On the other hand, the N2D+ =3-2 spectra were obtained using the filter bank spectrometers, the spectral resolution of which was 0.25 MHz.
2.3. Combined Interferometric and Single-Dish Observations
We combined the SMT data with the SMA data in order to fill the short-spacing information that was not sampled by the interferometer. We followed the procedure described by Yen et al. (2011), Takakuwa et al. (2007) and Wilner & Welch (1994). The combination of the data and subsequent imaging were made using the MIRIAD software package.
The single dish image cube was Fourier transformed into the visibility data. Then the visibility data made from the single-dish image cube and those observed with the SMA were inverse Fourier transformed simultaneously into the image plane with natural weighting. The SMA+SMT combined image cube was made with a velocity interval of 0.3 km s-1. The synthesized beam sizes of the combined maps were 421 383 with a P.A of 49.81 for the N2H+ =3-2 and 640 405 with a P.A of 45.75 for the N2D+ =3-2. The rms noise level of the combined N2H+ data cube was 0.17 Jy beam-1 and that of the N2D+ data cube was 0.13 Jy beam-1.
3. RESULTS
3.1. Dust Continuum Emission
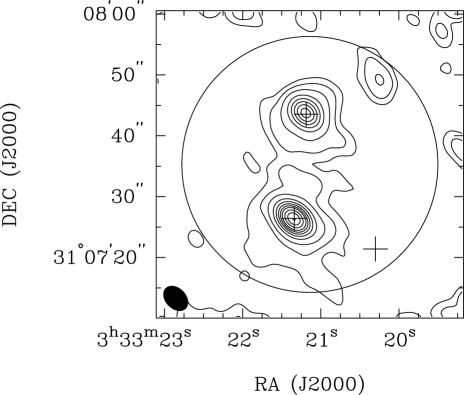
Figure 1 shows the 1.1 mm continuum image of the B1-b region after the primary beam correction. Two sources, B1-bN and B1-bS, separated by 20 are clearly seen. The peak flux densities, total integrated fluxes and peak positions of B1-bN and B1-bS were determined by two dimensional gaussian fitting. The peak flux density at B1-bN is measured to be 0.280.03 Jy beam-1 and that at B1-bS is 0.450.04 Jy beam-1. The beam deconvolved size of B1-bN is 22 20 (550 AU 500 AU), and that of B1-bS is 20 12 (500 AU 300 AU). The total fluxes of B1-bN and B1-bS are 0.37 Jy and 0.52 Jy, respectively. The positions of these compact sources are (2000) = 3h33m21.34s, (2000) = 3107264 and (2000) = 3h33m21.19s, (2000) = 3107436, respectively. The primary beam of the SMA also included the mid infrared source located at 12 west of B1-bS. Although this source was detected in all four bands of IRAC and the 24 and 70 m bands in MIPS (Jørgensen et al., 2006), there is no counterpart of this source in our 1.1 mm map. The 3 upper limit of this source is 10 mJy beam-1.
We estimated the total mass of gas and dust in B1-bN and B1-bS by assuming the continuum emission to be optically thin at 1.1 mm, and a gas-to-dust ratio to be 100. The masses are estimated as follows:
| (1) |
where is the flux density obtained from continuum emission, D is the source distance, and is the dust mass opacity derived from =(/0)β, where is calculated to be 0.01 cm2 g-1 at =231 GHz (Ossenkopf & Henning, 1994). We adopted the and from the fits of SEDs in Hirano & Liu (2013). The value of at B1-bN is 1.80.4 and that at B1-bS is 1.30.2. The values of at B1-bN and B1-bS are 15.62.2 K and 18.61.6 K, respectively. The total masses of B1-bN and B1-bS are calculated to be 0.310.20 M⊙ and 0.340.14 M⊙, respectively.
The H2 column densities at B1-bN and B1-bS were also estimated using the same assumptions of , and . The resultant (H2) at B1-bN and B1-bS are 2.670.31 1022 cm-2 and 4.840.72 1022 cm-2, respectively.
3.2. Molecular Line Maps
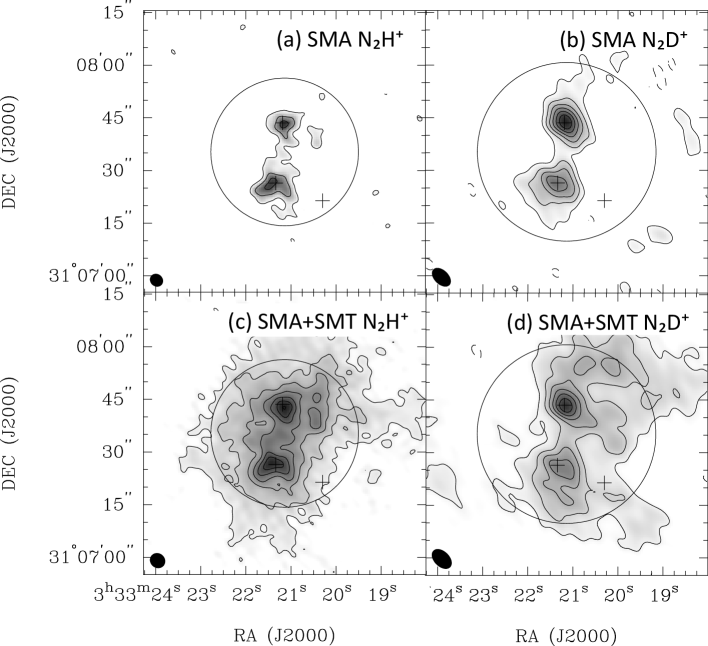
Figure 2 shows the integrated intensity maps of the N2H+ =3-2 and N2D+ =3-2 lines. The panels at the top of the figure are the maps obtained with only the SMA data, while the ones at the bottom include the contribution of the SMT data. The lines are integrated over the velocity ranges from VLSR = 5.4 – 8.7 km s-1 for the N2H+ =3-2 and from VLSR = 5.7 – 7.8 km s-1 for the N2D+ =3-2. The velocities of N2H+ =3-2 and N2D+ =3-2 are given with respect to the reference rest frequencies of 279.51169 GHz and 231.32990 GHz, respectively. The peaks of N2H+ =3-2 and N2D+ =3-2 emission agree well with those of 1.1 mm continuum emission in both SMA and SMA+SMT maps. In contrast, no significant N2H+ and N2D+ emission was detected at the position of the Spitzer source. From the comparisons between the line profiles of the SMA data and that of the combined SMA+SMT data, the missing fluxes of the SMA observations were estimated to be 80 % and 67 % for the N2H+ =3-2 and N2D+ =3-2, respectively. The larger missing flux in N2H+ implies that the N2H+ =3-2 emission is more spatially extended than the N2D+ =3-2 emission.
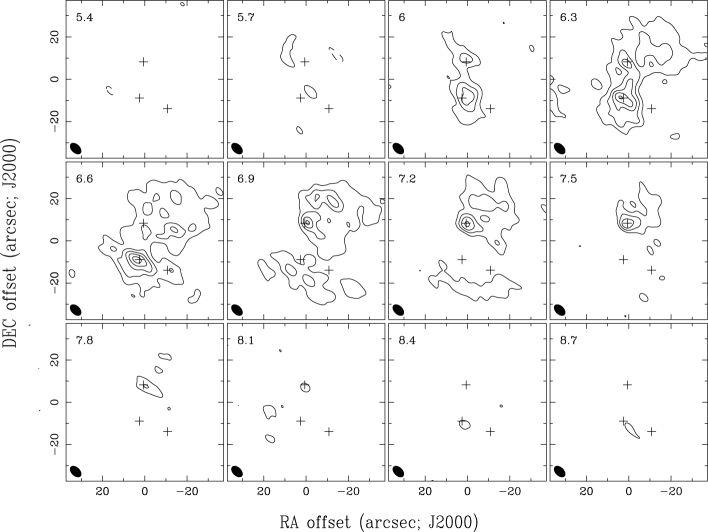
Figure 3 shows the velocity channel maps of the combined SMA+SMT N2H+ =3-2 data. In the low velocity range (VLSR = 6.0 - 6.6 km s-1), the N2H+ line emission is detected around both B1-bN and B1-bS regions. In this velocity range, the N2H+ emission reveals a centrally peaked distribution at B1-bS (especially at VLSR 6.3 km s-1), while it is more spatially extended around B1-bN. In the high velocity range (VLSR = 6.9 - 7.8 km s-1), the emission is centrally peaked at B1-bN, while it is faint and spatially extended at B1-bS.
The velocity channel maps of the combined SMA+SMT N2D+ data (Fig. 4) show the same trend as the N2H+ maps; the compact components at the positions of B1-bN and B1-bS appear in the velocity ranges of 6.9 - 7.8 km s-1 and 6.0 - 6.6 km s-1, respectively. As in the case of the N2H+, the spatially extended N2D+ emission around B1-bN is also seen in the low velocity range.

3.3. Kinematic Structure
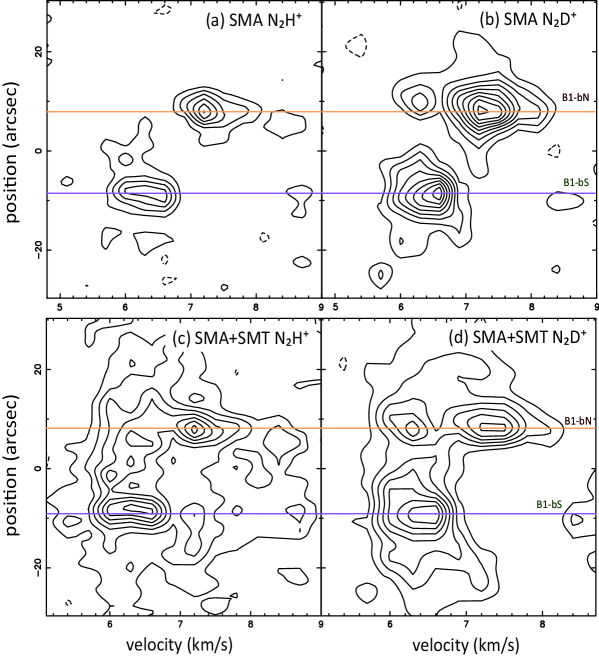
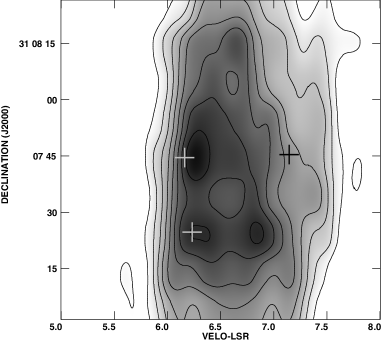
In order to examine the velocity structure of B1-b, we made the position-velocity (P–V) diagrams of the N2H+ and N2D+ along the North-South cut through B1-bN and B1-bS (Fig. 5). The upper panels of this figure are the diagrams obtained with the SMA data alone, while the ones in the lower panels include the contribution of the SMT data. The upper panels clearly show two velocity components; one is the 7.2 km s-1 component at B1-bN and the other is the 6.3 km s-1 component at B1-bS. At the position of B1-bN, the N2D+ emission has a secondary component at VLSR 6.3 km s-1. This component is connected to the 6.3 km s-1 component at B1-bS in the SMA+SMT combined map shown in the lower panels. The SMA+SMT combined map of N2H+ shows the faint 7.2 km s-1 component at the position of B1-bS, however, this component is not seen in the N2D+ map.
4. ANALYSIS
4.1. N2H+ and N2D+ Hyperfine Fitting
Since N2H+ =3-2 and N2D+ =3-2 rotational transitions contain numerous hyperfine components, line parameters such as central velocity (Vc), line width (), optical depth (), excitation temperature (Tex) need to be determined by hyperfine fitting. We assume all the hyperfine components to have the same excitation temperature and line width, with the relative velocity of each component fixed to the laboratory value. Since B1-bN has two velocity components (Fig. 5), it was difficult to determine all the parameters from fitting. Therefore, we fixed the excitation temperatures to be 7.6 K for N2H+ and 6.7 K for N2D+, which were determined by Emprechtinger et al. (2009). Since these excitation temperatures were derived from the N2H+ =1-0 and N2D+ =1-0 single-dish observations with HPBW of 27 and 32, respectively, the values are considered to be the average values of the B1-b region. We adopted the N2H+ =3-2 hyperfine components listed in Caselli et al. (2002) and those of the N2D+ =3-2 listed in Gerin et al. (2001). We used the combined SMA+SMT data to perform the fitting. The N2H+ data were convolved in order to match the beam size of the N2D+ data (640 405 with a P.A of 45.75°). The primary beam of the SMA antennas were also corrected.
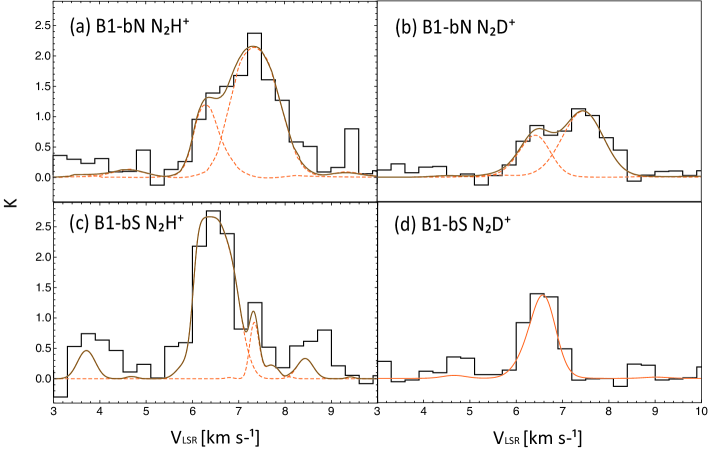
Figure 6 shows the combined SMA+SMT N2H+ =3-2 and N2D+ =3-2 line profiles and the results of hyperfine fittings at the positions of B1-bN and B1-bS. The N2D+ line profiles were fitted well using the optically thin assumption, while the N2H+ lines were obviously optically thick. The spectra at B1-bN has two velocity components; one is at V 7.2 km s-1, which is spatially compact, and the other is the spatially extended component at V 6.2 km s-1. The line profiles at B1-bS are mostly dominated by the VLSR = 6.3 km s-1 component. The determined parameters are listed in Table 1 and Table 2. In these tables, the main components refer to the dominate components at B1-bN and B1-bS, which correspond to the velocity components centered at 7.2 km s-1 and 6.3 km s-1, respectively. Since the line profile of N2H+ =3-2 at the position of B1-bS shows the secondary component at 7.2 km s-1, we included this component to the fitting.
It should be noted that the N2H+ line becomes optically thin if the higher excitation temperature is assumed; the optical depth of the primary component of B1-bN becomes less than 1.0 for the Tex 8.8 K, and that of B1-bS becomes 1 for the Tex 10.5 K. On the other hand, the optical depth of the N2H+ line becomes the largest ( 10 for B1-bN and 18 for B1-bS) if we adopt the lower limit of the excitation temperature derived from the fitting ( 6.4 K for B1-bN and 7.2 K for B1-bS).
4.2. N2H+ and N2D+ Column Density
We estimated the column densities of N2H+ and N2D+ using the method described by Caselli et al. (2002). The results including column densities of N2H+ and N2D+, and the (N2D+)/(N2H+) ratios at B1-bN and B1-bS are summarized in Table 3. The column densities of N2H+ at the positions of B1-bN and B1-bS were calculated to be 1.1 1013 cm-2 and 1.8 1013 cm-2, respectively. While column densities of N2D+ at B1-bN and B1-bS are 2.9 1012 cm-2 and 2.4 1012 cm-2, respectively. The corresponding N2D+/N2H+ ratios was 0.27 at B1-bN and 0.13 at B1-bS. These values are consistent with the N2D+/N2H+ ratio of 0.18 in the entire B1-b region obtained by Emprechtinger et al. (2009). The N2H+ column density becomes lower if we adopt higher excitation temperatures (a factor of 6 - 9 if Tex = 20 K). However, the N2D+/N2H+ ratio is almost constant at 0.3 - 0.4, because both N2H+ and N2D+ lines are optically thin at Tex 10 K. On the other hand, if we adopt the lower limit of the excitation temperature, the column density of N2H+ increases by a factor of 3 - 4. Since the N2D+ line is assumed to be optically thin, the N2D+/N2H+ ratio decreases to 0.06.
The fractional abundances of N2H+ at B1-bN and B1-bS were calculated to be 3.970.6210-10 and 3.710.6310-10, respectively, using the N2H+ column densities and H2 column densities derived from the continuum data. Jørgensen et al. (2004) derived the abundance of N2H+ in prestellar cores and Class 0 sources to be 10-8 – 10-10. The N2H+ abundance in these two sources is comparable to those of the samples studied by Jørgensen et al. (2004).
| Main Component | Second Component | ||||||
|---|---|---|---|---|---|---|---|
| Core | Vc (km s-1) | (km s-1) | Vc (km s-1) | (km s-1) | |||
| B1-bN | 2.000.03 | 7.190.02 | 0.830.05 | 0.820.02 | 6.180.02 | 0.500.05 | |
| B1-bS | 8.000.06 | 6.270.02 | 0.350.03 | aaThough the second component is not clear at B1-bS, two components were used to fit the spectrum of N2H+ =3-2 at B1-bS because it seems to be a more spatially-extended component centered at 6.2 km s-1. 0.100.08 | 7.250.01 | 0.210.02 | |
| Main Component | Second Component | ||||||
|---|---|---|---|---|---|---|---|
| Core | IaaThe brightness temperature of each hyperfine component is I (relative intensity of each component). (K) | Vc (km s-1) | (km s-1) | I (K) | Vc (km s-1) | (km s-1) | |
| B1-bN | 1.300.06 | 7.330.02 | 0.940.05 | 0.870.08 | 6.280.03 | 0.690.04 | |
| B1-bS | 1.800.03 | 6.430.03 | 0.580.05 | ||||
5. DISCUSSIONS
5.1. Deuterium Fractionation
The N2D+/N2H+ ratio of 0.13 – 0.27 derived in the previous section is 4 orders of magnitude larger than the D/H ratio of 10-5 in the interstellar space (Oliveira, 2003). It is known that the deuterium fractionation in N2H+ is related to the core temperature and CO depletion (e.g., Di Francesco et al., 2007). In the proton-deuteron exchange reaction, H+HDH2D++H2 (Millar et al., 1989), H2D+/H tends to be increased at lower temperature. In addition, at densities of 105 cm-3, the depletion of carbon-bearing molecules onto dust grains further increases the H2D+/H ratio (Roberts & Millar, 2000). Since H2D+ is the main ingredient of deuteriated molecules, the enhancement of H2D+ increases the abundance of deuteriated molecules. Therefore, the N2D+/N2H+ ratio becomes an indicator of the physical conditions and molecular depletion of dense and cold gas, and is useful to probe the chemical and dynamical evolution of cores, including starless cores and class 0 protostars.
| Core | (N2H+) (cm-2) | (N2D+) (cm-2) | (N2D+)/(N2H+) | (H2) (cm-2) | (N2H+)/(H2) | |
|---|---|---|---|---|---|---|
| B1-bN | 1.060.111013 | 2.850.091012 | 0.270.11 | 2.670.311022 | 3.970.6210-10 | |
| B1-bS | 1.800.151013 | 2.400.091012 | 0.130.09 | 4.840.721022 | 3.710.6310-10 |
Crapsi et al. (2005) observed 31 low-mass starless cores and derived the N2D+/N2H+ ratio to be 0.03 – 0.44. They found a strong correlation between the N2D+/N2H+ ratio and CO depletion, suggesting that the N2D+/N2H+ ratio increases with the density of the core. The higher N2D+/N2H+ values were seen in the cores of later evolutionary stage, i.e. those with centrally concentrated density distribution and high H2 column densities. In the case of the Class 0 protostellar cores studied by Emprechtinger et al. (2009), the N2D+/N2H+ ratio also ranges from 0.03 to 0.3. Their study showed that the N2D+/N2H+ ratio in the prestellar cores significantly decreases as a function of dust temperature, suggesting that the ratio decreases as the central star evolves and heats the surrounding gas. These results suggest that the largest N2D+/N2H+ ratio is expected to be in prestellar cores that are close to form protostars or protostellar cores in the earliest evolutionary stage. The N2D+/N2H+ ratios derived at B1-bN and B1-bS ( 0.2) are comparable to those of the evolved prestellar cores such as L1544 and the very young protostars such as L1448C, IRAS 03282 and HH211. It is notable that the column densities of N2D+ estimated here are the lower limits, because we assumed the N2D+ line to be optically thin. Therefore, the N2D+/N2H+ ratios derived here are also the lower limits.
The high D/H ratios in the B1-b region are also shown in other observations (Lis et al., 2002; Roueff et al., 2005; Marcelino et al., 2005). The high D/H ratios are consistent with the low temperatures derived from the SEDs of the continuum emission (Pezzuto et al., 2012; Hirano & Liu, 2013). Since both B1-bN and B1-bS contain compact continuum sources that are clearly detected by the interferometer, they are unlikely to be the prestellar cores. On the basis of the properties of B1-bN and B1-bS derived from the continuum SEDs such as low temperatures (T 20 K), low intrinsic luminosities (L 0.03 L⊙ for B1-bS and 0.004 L⊙ for B1-bN), and low velocity CO outflows (Hirano & Liu, 2013), these two sources are considered to be the candidates for the first hydrostatic cores.
5.2. Kinematics
As shown in Section 3.3, B1-bN appears at VLSR = 7.2 km s-1 and B1-bS reveals at VLSR = 6.3 km s-1. In other words, two sources with a projected separation of 5000 AU have a velocity difference of 0.9 km s-1. If this velocity difference attributes to the orbital motion of gravitationally-bounded objects, the mass of each source is estimated to be 0.55 M⊙. This mass agrees with the mass derived from the continuum data within a factor of two. If the two sources originate from a single rotating cloud, the P–V diagram along the line connecting two sources (i.e. in the N–S direction) is expected to show a velocity gradient. However, the velocity pattern seen in the P–V maps including the short spacing data (Fig. 5(c) and Fig. 5(d)) does not show such a velocity gradient. Instead, these P–V maps reveal a C-shaped pattern with two velocity components along the line of sight of B1-bN. The spatially extended emission connects B1-bS and the secondary component of B1-bN, which has the same velocity as B1-bS. In addition, the N2H+ map shows an additional 7.2 km s-1 component along the line of sight of B1-bS. Therefore, it is unlikely that the two sources were formed in a single rotating cloud through the fragmentation. The P–V maps including the short spacing data suggest that there are two velocity components along the line of sight of the B1-b core, and that B1-bN belongs to the 7.2 km s-1 cloud and B1-bS to the 6.3 km s-1 cloud.
5.3. Comparison with H13CO+ =1-0 Emission
Fig. 7 shows the P–V diagram of H13CO+ =1-0 emission along the N–S cut through B1-bN and B1-bS observed within the NRO 45 m telescope (Hirano & Liu, 2013). Two velocity components along the line of sight of B1-b are also seen in the H13CO+ map. It is notable that the relative intensities of these two velocity components in the H13CO+ map are considerably different from those of the N2H+ and N2D+ maps. As shown in the previous section, the dense gas around B1-bN traced by the N2H+ and N2D+ lines has a velocity of 7.2 km s-1. In addition to this 7.2 km s-1 component, there is a secondary component at 6.3 km s-1. On the other hand, the H13CO+ line peaks at 6.3 km s-1 and shows no significant enhancement at V 7.2 km s-1. At B1-bS, both N2H+ and N2D+ maps reveal the 6.3 km s-1 component. Although the N2H+ line shows a weak secondary peak at 7 km s-1, there is no counterpart of that velocity component in the N2D+ line. In the case of H13CO+ map, however, it shows double peaks at 6.3 km s-1 and 6.9 km s-1. The comparison shows that N2H+ and N2D+ emission is partially anti-correlated with the H13CO+ emission.
These results can be well explained by the different chemical properties between carbon-bearing molecules and nitrogen-bearing molecules. Since H13CO+ (HCO+) is considered to be formed from 13CO (CO) through the ion-neutron reaction in the gas phase, the abundance of H13CO+ is expected to decrease if a significant fraction of CO molecules freeze onto the dust grains. In such a cold and dense region with CO depletion, the N2H+ and N2D+ abundance tend to be enhanced, since CO is the main reactant to destroy the N2H+ and N2D+. Therefore, the chemical properties of the dense gas surrounding B1-bN with a velocity of 7.2 km s-1 can be explained by the scenario of CO depletion. In the case of B1-bS, the H13CO+ coexists with N2H+ and N2D+. This is probably because the gas in B1-bS is heated by the newly formed star. As a consequence, the CO in this region has been partially come back to the gas phase. The presence of CO outflows around this source also support this idea (Hirano & Liu, 2013). Since H13CO+ is made from the reaction N2H+ + CO H13CO+ +N2, the existence of N2H+ and CO makes H13CO+. A comparison between B1-bN and B1-bS suggests that B1-bN is chemically younger than B1-bS. The SEDs in Hirano & Liu (2013) and Pezzuto et al. (2012) also show that B1-bN has lower dust temperature. In addition, B1-bN was not detected at 70 m by Herschel (Pezzuto et al. 2012), while B1-bS was detected in the same wavelength. These results also support the idea that two sources are in slightly different evolutionary stages.
The 6.3 km s-1 component along the line of sight of B1-bN is bright in H13CO+ while faint in N2H+ and N2D+, suggesting that the CO depletion in this velocity component is not significant. On the other hand, the 6.9 km s-1 component at B1-bS is also bright in the H13CO+, but unclear in the N2H+ and N2D+. Although the LSR velocity of this component (6.9 km s-1) is slightly different from 7.2 km s-1 in the N2H+, the 6.9 km s-1 component seen in the H13CO+ is probably related to the 7.2 km s-1 component observed in the N2H+. The chemical properties suggest that the density of the 6.3 km s-1 component at B1-bN is higher than that of the 7.2 km s-1 component at B1-bS.
6. CONCLUSIONS
We have observed the two sources in the B1-b core, B1-bN and B1-bS, in 1.1 mm continuum emission with the SMA, and N2H+ =3-2 and N2D+ =3-2 line emission with the SMA and the SMT. The main conclusions are the followings:
-
1.
Two compact sources, B1-bN and B1-bS, with a projected separation of 20, are shown in the 1.1 mm continuum map observed with the SMA. Their masses were estimated to be 0.3 M⊙.
-
2.
The N2H+ and N2D+ lines show significant enhancement at the positions of B1-bN and B1-bS.
-
3.
The N2H+ abundance was estimated to be 4 10-10 at both B1-bN and B1-bS. The derived N2H+ abundance is comparable to those of prestellar cores and Class 0 protostars.
-
4.
The N2D+/N2H+ ratio was estimated to be 0.2 at both B1-bN and B1-bS. This value is 4 orders of magnitude higher than that in the interstellar medium. The N2D+/N2H+ ratio is comparable to those in the late prestellar phase or in the earliest protostellar phase. Since these two sources harbor compact components, they are more likely to be in the very early stage of protostellar formation.
-
5.
The radial velocities of B1-bN and B1-bS are VLSR=7.2 km s -1 and VLSR=6.3 km s -1, respectively. The C-shaped velocity pattern seen in the P–V diagrams of N2H+ and N2D+ does not support the idea that two sources are formed by means of fragmentation of a single rotating cloud. It is likely that there are two velocity components at VLSR=6.3 km s -1 and 7.2 km s -1 along the line of sight of B1-b, each of which harbors a young protostar.
-
6.
At the position of B1-bN, the 7.2 km s-1 component, which is bright in N2H+ and N2D+, is not clearly seen in the H13CO+ =1-0. This suggests that the carbon bearing molecules in the dense gas surrounding B1-bN are heavily depleted onto the dust.
-
7.
On the other hand, the 6.3 km s-1 component at B1-bS is observed in N2H+, N2D+ and H13CO+ lines. The difference in chemical property suggests that B1-bN is in the earlier evolutionary stage as compared to B1-bS.
We wish to thank all the SMA staff in Hawaii, Cambridge, and Taipei for their kind help during these observations. N. Hirano is supported by NSC grant 99-2112-M-001-009-MY3.
References
- Belloche & André (2004) Belloche, A., & André, P. 2004, The Dense Interstellar Medium in Galaxies, 633
- Bergin & Langer (1997) Bergin, E. A., & Langer, W. D. 1997, ApJ, 486, 316
- Caselli et al. (2002) Caselli, P., Walmsley, C. M., Zucconi, A., et al. 2002, ApJ, 565, 344
- Černis & Straižys (2003) Černis, K., & Straižys, V. 2003, Baltic Astronomy, 12, 301
- Chen et al. (2012) Chen, X., Arce, H. G., Dunham, M. M., et al. 2012, ApJ, 751, 89
- Chen et al. (2010) Chen, X., Arce, H. G., Zhang, Q., et al. 2010, ApJ, 715, 1344
- Crapsi et al. (2005) Crapsi, A., Caselli, P., Walmsley, C. M., et al. 2005, ApJ, 619, 379
- Di Francesco et al. (2007) Di Francesco, J., Evans, II, N. J., Caselli, P., et al. 2007, in Protostars & Planets V, 17
- Emprechtinger et al. (2009) Emprechtinger, M., Caselli, P., Volgenau, N. H., et al. 2009, A&A, 493, 89
- Enoch et al. (2010) Enoch, M. L., Lee, J.-E., Harvey, P., et al. 2010, ApJ, 722, L33
- Evans et al. (2003) Evans, N. J., II, Allen, L. E., Blake, G. A., et al. 2003, PASP, 115, 965
- Gerin et al. (2001) Gerin, M., Pearson, J. C., Roueff, E., et al. 2001, ApJ, 551, L193
- Hirano et al. (1999) Hirano, N., Kamazaki, T., Mikami, H., et al. 1999, Star Formation 1999, 181
- Hirano & Liu (2013) Hirano, N., & Liu, F.-C. 2012, in preparation.
- Hirota et al. (2008) Hirota, T., Bushimata, T., Choi, Y. K., et al. 2008, PASJ, 60, 37
- Jørgensen et al. (2006) Jørgensen, J. K., Harvey, P. M., Evans, N. J., II, et al. 2006, ApJ, 645, 1246
- Larson (1969) Larson, R. B. 1969, MNRAS, 145, 271
- Lis et al. (2002) Lis, D. C., Roueff, E., Gerin, M., et al. 2002, ApJ, 571, L55
- Marcelino et al. (2005) Marcelino, N., Cernicharo, J., Roueff, E., et al. 2005, ApJ, 620, 308
- Masunaga & Inutsuka (2000) Masunaga, H., & Inutsuka, S.-i. 2000, ApJ, 531, 350
- Millar et al. (1989) Millar, T. J., Bennett, A., & Herbst, E. 1989, ApJ, 340, 906
- Oliveira (2003) Oliveira, C. M. 2003, Bulletin of the American Astronomical Society, 35, 1317
- Omukai (2007) Omukai, K. 2007, PASJ, 59, 589
- Ossenkopf & Henning (1994) Ossenkopf, V., & Henning, Th. 1994, A&A, 291, 943
- Pezzuto et al. (2012) Pezzuto, S., Elia, D., Schisano, E., et al. 2012, A&A, 547, A54
- Pineda et al. (2011) Pineda, J. E., Arce, H. G., Schnee, S., et al. 2011, ApJ, 743, 201
- Saigo et al. (2008) Saigo, K., Tomisaka, K., & Matsumoto, T. 2008, ApJ, 674, 997
- Saigo & Tomisaka (2006) Saigo, K., & Tomisaka, K. 2006, ApJ, 645, 381
- Sault et al. (1995) Sault, R. J., Teuben, P. J., & Wright, M. C. H. 1995, Astronomical Data Analysis Software and Systems IV, 77, 433
- Rebull et al. (2007) Rebull, L. M., Stapelfeldt, K. R., Evans, N. J., II, et al. 2007, ApJS, 171, 447
- Roberts & Millar (2000) Roberts, H., & Millar, T. J. 2000, A&A, 361, 388
- Roueff et al. (2005) Roueff, E., Lis, D. C., van der Tak, F. F. S., et al. 2005, A&A, 438, 585
- Tafalla et al. (2002) Tafalla, M., Myers, P. C., Caselli, P., et al. 2002, ApJ, 569, 815
- Takakuwa et al. (2007) Takakuwa, S., Kamazaki, T., Saito, M., et al. 2007, PASJ, 59, 1
- Wilner & Welch (1994) Wilner, D. J., & Welch, W. J. 1994, ApJ, 427, 898
- Jørgensen et al. (2004) Jørgensen, J. K., Schöier, F. L., & van Dishoeck, E. F. 2004, A&A, 416, 603
- Yen et al. (2011) Yen, H-W., Takakuwa, S., Ohashi, N. 2011, ApJ, 742, 57