Looking for Stars and Finding the Moon:
Effects of Lunar Gamma-ray Emission on Fermi LAT Light Curves
Abstract
We are conducting a search for new gamma-ray binaries by making high signal-to-noise light curves of all cataloged Fermi LAT sources and searching for periodic variability using appropriately weighted power spectra. The light curves are created using a variant of aperture photometry where photons are weighted by the probability that they came from the source of interest. From this analysis we find that the light curves of a number of sources near the ecliptic plane are contaminated by gamma-ray emission from the Moon. This shows itself as modulation on the Moon’s sidereal period in the power spectra. We demonstrate that this contamination can be removed by excluding times when the Moon was too close to a source. We advocate that this data screening should generally be used when analyzing LAT data from a source located close to the path of the Moon.
I Introduction: Hunting for Gamma-ray Binaries
At X-ray energies, the extra-solar sky is dominated by the emission from accreting binary systems containing black holes and neutron stars. However, at higher energies (GeV to TeV) very few interacting neutron star or black hole binaries are known sources (Hill et al., 2011). The relative paucity of gamma-ray binaries can be attributed to the necessity for not only a power supply, but also non-thermal mechanisms (Dubus, 2006; Mirabel, 2006). There are, however, evolutionary reasons to expect more gamma-ray binaries to exist (Meurs & van den Heuvel, 1989), and there are many unidentified Fermi LAT sources. Gamma-ray binaries are expected to show orbitally-modulated gamma-ray emission due to changes in viewing angle and, in eccentric orbits, the degree of the binary interaction. Periodic modulation has indeed been seen in LS 5039 (3.9 day period), LS I +61 303 (26.5 days), Cygnus X-3 (4.8 hours) (Hill et al., 2011), and 1FGL J1018.6-5856 (16.65 days) (Corbet et al., 2011; Fermi LAT Team et al., 2012) and emission is orbital phase dependent for PSR B1259-63 (3.4 years) (Abdo et al., 2011). A search for periodic modulation of gamma-ray flux from Fermi LAT sources may thus yield further gamma-ray binaries, potentially revealing the predicted HMXB precursor population. The second Fermi LAT catalog of gamma-ray sources (“2FGL” (Nolan et al., 2012)) contains 1873 sources, many of which do not have confirmed counterparts at other wavelengths and thus are potentially gamma-ray binaries.
In order to search for modulation we regularly update 0.1 - 200 GeV light curves for all 2FGL sources and calculate power spectra of these. We use aperture photometry with a 3∘ radius, with photons weighted by the probability that they came from the source of interest to increase the signal-to-noise level. To avoid solar gamma-ray emission, we exclude times when the Sun was closer than 5∘ to an aperture. We then calculate power spectra of all light curves to search for periodic modulation. To account for variations in exposure, each time bin’s contribution to the power spectrum is weighted by its relative exposure (Fermi LAT Team et al., 2012).
II Complex Modulation Patterns in Two Fermi Sources
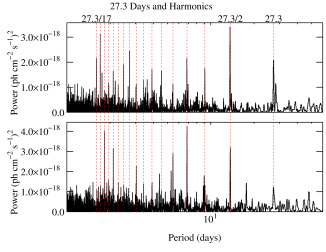
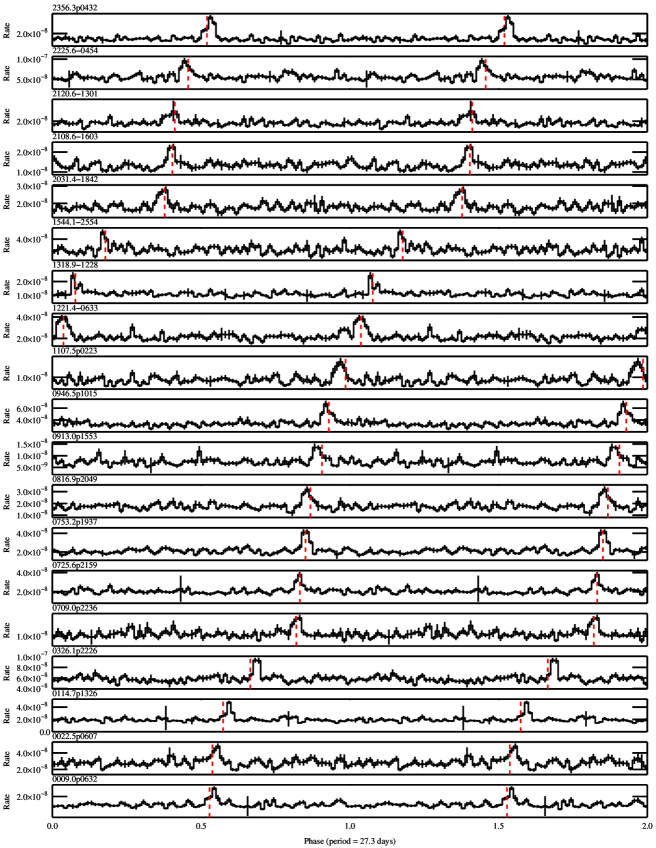
From an examination of the power spectra for all sources in the 2FGL catalog, orbital modulation is strongly detected in the known gamma-ray binaries LS 5039, LS I +61 303, and 1FGL J1018.6-5856 (= 2FGL J1019.0-5856). Artifacts near 1 day and the precession period of Fermi’s orbit at 53 days are also seen in the power spectra of a number of sources111http://fermi.gsfc.nasa.gov/ssc/data/analysis/LAT_caveats_temporal.html. In addition to these, we noted complex sets of peaks in the power spectra of 2FGL J0753.2+1937 and 2FGL J2356.3+0432. 2FGL J0753.2+1937 does not have an identified counterpart at other wavelengths, while 2FGL J2356.3+0432 is identified with the blazar MG1 J235704+0447 (Nolan et al., 2012). Although these two sources are widely separated on the sky, it was determined that the peaks in both sources were all harmonics of a 27.3 day period (Figure 1). When the light curves are folded on this period, brief flares are seen in both sources (Figure 2).

III Lunar Gamma-Rays
Interactions of cosmic rays with the Moon’s surface result in the production of gamma rays. This makes the Moon a rather bright source for the Fermi LAT with a flux above 100 MeV of 10-6 ph cm-2 s-1 (Abdo et al., 2012), and it was even detectable with EGRET (Thompson et al., 1997). We note that the Sun is also a gamma-ray source. Although the 2FGL catalog notes sources potentially affected by solar emission, no such analysis was done for the Moon (Nolan et al., 2012).
The Moon’s sidereal period is 27.321 days. The sharp recurrent flares from 2FGL J0753.2+1937 and 2FGL J2356.3+0432 can be understood as due to repeated passages of the Moon sufficiently close to these sources to affect the light curves.
IV Optimizing Lunar Detection: Summed Harmonics
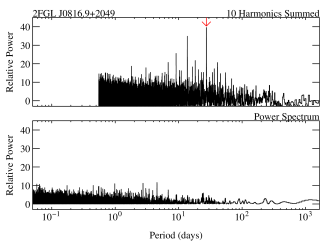
Power spectra are not ideal for detecting brief flaring activity as this strongly non-sinusoidal modulation results in the power being spread over a very large number of harmonics. We investigated other period-detection techniques such as Stellingwerf’s phase dispersion minimization (Stellingwerf, 1978) method and others. It was found that lunar modulation was best detected by creating a modified power spectrum, similar to the Z2 test (Buccheri, 1983), with each point replaced with a sum of itself and up to the 10th harmonic. This is illustrated in Figure 3 where we show the power spectrum, and summed-harmonic power spectrum of 2FGL J0816.9+2049, a source which is identified with the blazar 2FGL J0816.9+2049 (Nolan et al., 2012). From harmonic-summed power spectra of the entire 2FGL catalog we detected 38 sources that suffered from significant lunar contamination (Table 1).
| Source | R.A. (J2000) | Decl. (J2000) |
|---|---|---|
| (degrees) | (degrees) | |
| 2FGL J0009.0+0632 | 2.262 | 6.542 |
| 2FGL J0022.5+0607 | 5.643 | 6.124 |
| 2FGL J0023.5+0924 | 5.892 | 9.407 |
| 2FGL J0114.7+1326 | 18.675 | 13.441 |
| 2FGL J0257.9+2025c | 44.480 | 20.423 |
| 2FGL J0322.0+2336 | 50.516 | 23.611 |
| 2FGL J0326.1+2226 | 51.536 | 22.439 |
| 2FGL J0440.5+2554c | 70.146 | 25.903 |
| 2FGL J0709.0+2236 | 107.274 | 22.600 |
| 2FGL J0725.6+2159 | 111.400 | 21.990 |
| 2FGL J0753.2+1937 | 118.320 | 19.623 |
| 2FGL J0816.9+2049 | 124.250 | 20.823 |
| 2FGL J0839.4+1802 | 129.863 | 18.036 |
| 2FGL J0913.0+1553 | 138.251 | 15.893 |
| 2FGL J0923.5+1508 | 140.895 | 15.138 |
| 2FGL J0946.5+1015 | 146.648 | 10.259 |
| 2FGL J1007.7+0621 | 151.932 | 6.353 |
| 2FGL J1016.0+0513 | 154.014 | 5.229 |
| 2FGL J1018.6+0531 | 154.659 | 5.524 |
| 2FGL J1040.7+0614 | 160.182 | 6.246 |
| 2FGL J1058.4+0133 | 164.615 | 1.566 |
| 2FGL J1059.0+0222 | 164.767 | 2.374 |
| 2FGL J1107.5+0223 | 166.878 | 2.386 |
| 2FGL J1221.40633 | 185.358 | 6.553 |
| 2FGL J1256.51145 | 194.139 | 11.753 |
| 2FGL J1318.91228 | 199.745 | 12.476 |
| 2FGL J1424.21752 | 216.054 | 17.880 |
| 2FGL J1544.12554 | 236.042 | 25.912 |
| 2FGL J1553.22424 | 238.322 | 24.404 |
| 2FGL J2000.81751 | 300.217 | 17.857 |
| 2FGL J2006.91734 | 301.734 | 17.582 |
| 2FGL J2031.41842 | 307.868 | 18.703 |
| 2FGL J2108.61603 | 317.159 | 16.062 |
| 2FGL J2120.61301 | 320.152 | 13.030 |
| 2FGL J2124.01513 | 321.023 | 15.223 |
| 2FGL J2154.01138 | 328.503 | 11.634 |
| 2FGL J2225.60454 | 336.424 | 4.901 |
| 2FGL J2356.3+0432 | 359.091 | 4.541 |
V Removing the Moon
Fermi spacecraft files do not currently include lunar coordinates. One of us (PSR) has provided a utility (“moonpos”) that uses the JPL SPICE toolkit (Acton, 1996)222http://naif.jpl.nasa.gov/naif/toolkit.html to add lunar coordinates. This is available from the Fermi Science Support Center on the User Contributions web page333http://fermi.gsfc.nasa.gov/ssc/data/analysis/user.
The addition of lunar coordinates enables filtering to exclude data obtained when the Moon was close to a source via the standard analysis tool gtmktime. We find that excluding data within 8 degrees of a source removes almost all contamination.
VI Applications to Searches for Flaring Binaries
The technique of summing harmonics to reveal the presence of lunar contamination is also useful in the search for gamma-ray binaries. For example, the binary PSR B1259-63 is only active for a brief portion of its 3.4 yr orbit (Abdo et al., 2011). Other systems exhibiting similar repeating brief flares will be more readily detected using harmonically-summed power spectra. So far no definite non-lunar periodic flaring has been detected for any source, but the hunt continues.
VII Summary
-
•
Lunar gamma-ray emission can significantly contaminate the light curves of LAT sources near the ecliptic plane.
-
•
Lunar modulation at 27.3 days is directly detected in the power spectra of a few sources.
-
•
Adding power-spectrum harmonics (10) reveals the 27.3 day signal in 38 2FGL sources.
-
•
Software has been developed to facilitate exclusion of lunar contaminated data. This is publicly available.
We advocate:
(i) lunar proximity filtering should be done for any source close to the ecliptic.
(ii) lunar coordinates should be included in the standard Fermi spacecraft files.
The summed-harmonic technique is being used to search for gamma-ray binaries that briefly flare for only a short fraction of their orbit.
Acknowledgements.
This work was partially supported by the NASA Fermi Guest Observer Program (NNX12AH82G).References
- Abdo et al. (2011) Abdo, A. A., Ackermann, M., Ajello, M., et al. 2011, ApJ, 736, L11
- Abdo et al. (2012) Abdo, A. A., Ackermann, M., Ajello, M., et al. 2012, Astrophys. J. , 758, 140
- Acton (1996) Acton, C. H. 1996, Planet. Space Sci., 44, 65
- Buccheri (1983) Buccheri, R., Bennett, K., Bignami, G. F., et al. 1983, A&A, 128, 245
- Corbet et al. (2011) Corbet, R. H. D., Cheung, C. C., Kerr, M., et al. 2011, The Astronomer’s Telegram, 3221, 1
- Dubus (2006) Dubus, G. 2006, A&A, 456, 801
- Fermi LAT Team et al. (2012) Fermi LAT Collaboration, Ackermann, M., Ajello, M., et al. 2012, Science, 335, 189
- Hill et al. (2011) Hill, A. B., Dubois, R., Torres, D. F., & Fermi LAT Collaboration 2011, High-Energy Emission from Pulsars and their Systems, 498
- Meurs & van den Heuvel (1989) Meurs, E. J. A., & van den Heuvel, E. P. J. 1989, A&A, 226, 88
- Mirabel (2006) Mirabel, I. F. 2006, Science, 312, 1759
- Nolan et al. (2012) Nolan, P. L., Abdo, A. A., Ackermann, M., et al. 2012, ApJS, 199, 31
- Stellingwerf (1978) Stellingwerf, R. F. 1978, Astrophys. J. , 224, 953
- Thompson et al. (1997) Thompson, D. J., Bertsch, D. L., Morris, D. J., & Mukherjee, R. 1997, J. Geophys. Res., 102, 14735