Molecular gas in high redshift galaxies
Abstract
Recent observations with the IRAM instruments have allowed to explore the star formation efficiency in galaxies as a function of redshift, in detecting and mapping their molecular gas. Some galaxies stand on what is called the “main sequence”, forming stars with a rate that can be sustained over time-scales of 1 Gyr, some are starbursts, with a much shorter depletion time. Star formation was more active in the past, partly because galaxies contained a larger gas fraction, and also because the star formation efficiency was higher. The global Kennicutt-Schmidt relation was however similar until z 2.5. Magnification by gravitational lenses have been used to explore in details galaxies at higher redshift up to 6. Herschel has discovered many of these candidates, and their redshift has been determined through the CO lines. ALMA is beginning to extend considerably these redshift searches, with its broad-band receivers, for a large range of objects too obscured to be seen in the optical.
1Observatoire de Paris, LERMA, CNRS, 61 Av de l’Observatoire, 75014, Paris, France
1 Main sequence and starburst galaxies
Star formation occurs in galaxies with different speeds of interstellar gas consumption. Two main modes can be distinguished, either a quiescent mode or ”main sequence” mode, where the gas depletion time-scale is larger than 1 Gyr, and a starburst mode, for which the depletion time-scale is 100 Myr or smaller. Locally, the average gas depletion time-scale for the main sequence star-forming galaxies is 2.35 Gyr (Bigiel et al. 2011). Starbursts are thought to be a transient phase, triggered by an external dynamical event, such as a galaxy interaction, a minor or major merger, or gas accretion followed by violent gas flows towards the center.
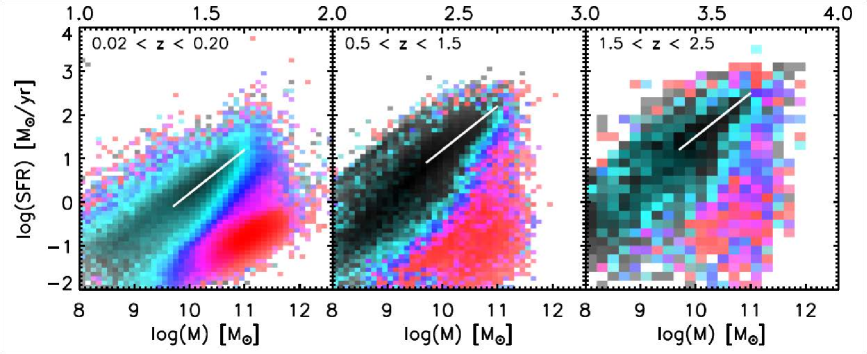
The main sequence of star formation has been identified at least up to redshift 2.5 (Noeske et al. 2007; Elbaz et al. 2007; Daddi et al. 2007), and the rate of star formation on this sequence increases steadily with redshift, like , with . On the main sequence, the star formation rate (SFR) is roughly proportional to the stellar mass M∗. Wuyts et al. (2011) have studied the statistics of hundreds of thousands of local galaxies from the SDSS, and high-z galaxies from HST imaging together with multiwavelength photometry and spectroscopy, and concluded that, at a given stellar mass, there is a large scatter in SFR, from the red sequence of quenched galaxies to the main sequence corresponding to the blue ones (cf Figure 1). The color from stellar populations is correlated to the morphology, or luminosity profile (stellar density structure) obtained through the Sersic index derivation. Star forming galaxies on the main sequence are exponential disks, while red quiescent systems have a de Vaucouleurs profile.
2 ULIRGs at intermediate redshift
To explore the main parameters causing the drop by an order of magnitude of the cosmic SFR between z=1 and z=0, we first study the most extreme objects, the ultraluminous (ULIRG), which are usually starbursting galaxies, triggered by interactions and mergers. About 70 objects were selected in the northern hemisphere through their FIR luminosity, and observed in the CO lines with IRAM-30m (Combes et al. 2011, 2013). Their redshift range is 0.2-1, to fill the gap already noticed by Greve et al. (2005).
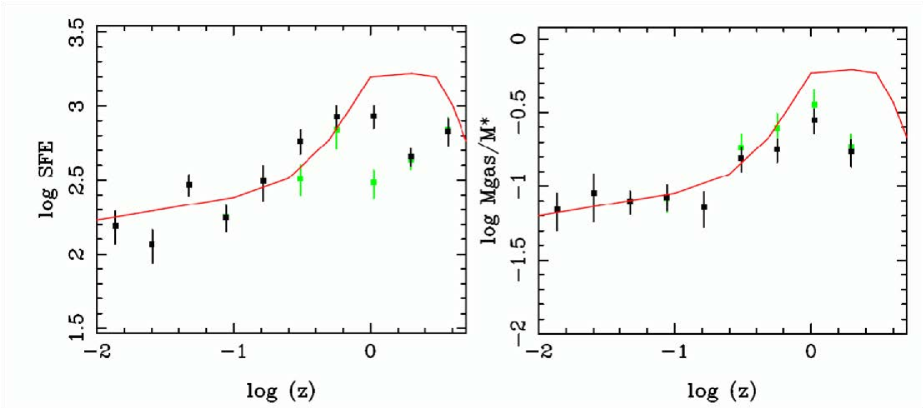
We detected 60% of the objects with 0.2 z 0.6, and 38% in the redshift range 0.6-1.0. According to the excitation of the gas, determined in a few of the objects with several high-J CO lines, and also to the dust mass derived from the far-infrared, we adopt a low CO-to-H2 conversion factor, as proposed by Solomon et al. (1997) for ULIRGs. We define the star formation efficiency (SFE) by the ratio of far infrared luminosity, a proxy for the star formation rate, to the CO line luminosity, a proxy for the molecular gas content. The SFE is found to increase with redshift, by about a factor 3, when all detected ULIRG are taken into account. The stellar mass of all the objects has been derived from modeling their SED in the optical and near infrared. It is then possible to study the evolution of the gas mass fraction with redshift. Figure 2 shows that both variations of SFE and gas-to-stellar mass ratios are comparable, they both evolve in the sense of the cosmic SFR density. Their amplitude is howeveer shallower, they both increase by a factor 3 between z=0 and 1. It can be concluded that both factors are required to explain the total SFR variation.
3 Main sequence galaxies at z=1-2
We have undertaken a survey in the CO(3-2) line with the IRAM interferometer of about 50 massive star forming galaxies, selected from their stellar mass and their star formation rate, in the AEGIS survey (Tacconi et al. 2010, 2013). Although these galaxies are forming stars at a high rate, they are still in the blue main sequence at their respective redshift of 1.2 and 2.3, given the average SFR increase with redshift.
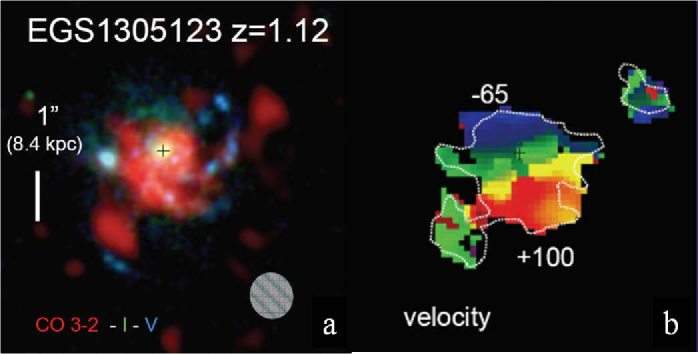
Almost all these high-mass galaxies are detected in CO, and the main result is their increased gas fraction. While local galaxies have about 5% of their baryons in gas (e.g. Saintonge et al. 2011), the average gas content is 34% and 44% at z=1.2 and 2.3 respectively (Tacconi et al. 2010). These galaxies have relatively regular morphologies, those of large spirals not experiencing mergers (or very minor ones). Their gas velocity fields show regular rotation, although with higher velocity dispersion than at z=0 (cf Figure 3). Their gas depletion time-scale is slightly below 1 Gyr, meaning that their star forming duty cycle is relatively short, or they are constantly replenished in gas, through external accretion from cosmic filaments (e.g. Keres et al. 2005, Dekel & Birnboim 2006).
Some of the objects are strong enough in the CO line that it was possible to resolve their disk with higher spatial resolution, of the order of one arcsec or below. Although it is not possible to identify the bright clumps seen in the HST images at 0.1” resolution, the spectroscopy both in [OII] and in CO allow to separate clumps with their different kinematics along a given line of sight, and to attempt the derivation of the resolved Kennicutt-Schmidt relation. The correlation has a lot of scatter, but reveals an average depletion time-scale for the clumps of 1.5 Gyr (Freundlich et al. 2013).
4 Lensed galaxies up to z=6
To be able to detect and map galaxies at even higher redshift, most studies have used the magnification of gravitational lenses. The HLS key project on Herschel (PI E. Egami) has targeted relatively nearby galaxy clusters, to find background high-z candidate galaxies. The selection is based on objects whose peak of dust emission is redshifted from 100m to 500m in the SPIRE band. Several objects were searched for CO lines, to determine their redshifts. One of the strongest galaxies has been found behind the cluster Abell 773, and many molecular lines have been detected in the redshift search, including H2O, CI, [CII], [NII]205m (Combes et al. 2012).
Follow up observations with SMA and PdBI have resolved the strong lensing images, the magnification is about 11, and the source presents two arcs, forming an incomplete ring. The velocity profile reveals at least two different components (two interacting galaxies?) and the [CII] line map indicates that the blue and red components are distributed in complementary arcs, forming an interrupted Einstein ring (Boone et al. 2013, in prep). The high signal-to-noise spectra in CI and CO(7-6) at about the same frequency have allowed to put constraints on variation of fundamental constants, in particular the proton-to-electron mass ratio (relative variations below 2 10-5, Levshakov et al. 2012).
Rawle et al. (2013, in prep) show that the [NII] to [CII] ratio is 0.043, similar to that in nearby objects. The ratio can be used as a metallicity diagnostic, as shown by Nagao et al. (2012) with ALMA. This diagnostic is precious, for dust-enshrouded objects at z3, since there are no available diagnostics in optical lines from the ground.
5 ALMA mapping at z=0
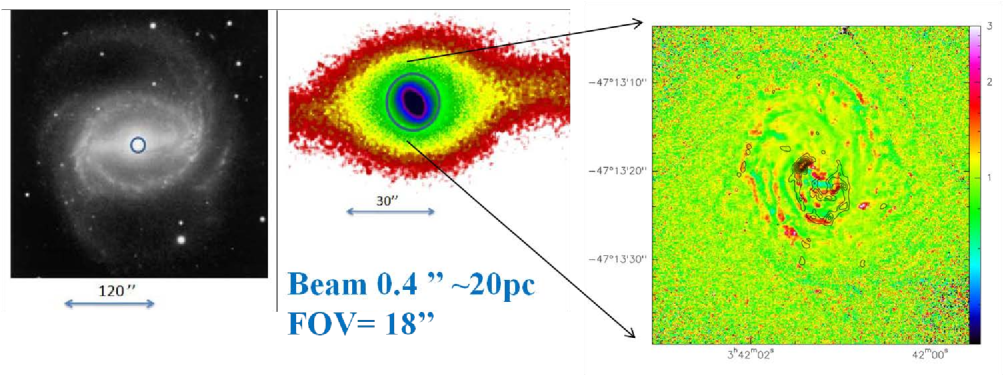
Coming back to local galaxies, we have been able to use ALMA in cycle 0 to explore two Seyfert galaxies, and their molecular gas fueling mechanisms. NGC 1433 is a Seyfert 2 called the Lord of rings (Buta & Combes 1996), since it shows clearly at least 3 rings corresponding to resonances: outer ring at OLR, inner ring at UHR near corotation, and a nuclear ring at the ILR of the bar. The field of view of the ALMA observations in band 7 is 18” only, and corresponds to the nuclear bar, inside the nuclear ring. Figure 4 reveals that the CO(3-2) emission follows quite well the spiral structure seen in dust lanes with HST, and corresponding to an inner spiral inside the nuclear bar. The spatial resolution is 0.4 arcsecond or 20pc. Neither strong HCO+ nor HCN is seen in this galaxy. On the contrary, these molecules have strong emission in the Seyfert 1 NGC 1566. The HCO+/CO ratio is surprisingly strong, as it is in M82 (Seaquist & Frayer 2000). This might indicate a predominance of PDR, or cosmic ray heating. Contrary to expectations, the Seyfert 1 has a much denser and richer molecular disk, at 20pc resolution, possibly corresponding to a molcular torus.
6 Perspectives
Both continuum dust emission and CO lines are increasingly observed at high redshifts, and ALMA coming on line will make considerable breakthroughs in this domain. It will be possible to follow the main sequence of star forming galaxies, not only at very high masses, nor high SFR. More normal galaxies, with modest SFR, and lower stellar masses could be reached, revealing an unbiased main sequence. The cosmic evolution of the gas content of galaxies will be unveiled, and the efficiency of star formation established across the Hubble time. With high spatial resolution, it will be possible to check whether the Kennicutt-Schmidt relation is still valid at high-z, an information crucial for models of galaxy formation and evolution. The mechanisms responsible for triggering SFR, or for quenching it, will be studied in detail with resolved maps, and taking into account environmental effects.
Acknowledgments
Many thanks to the organizers for the invitation to such a beautiful and exciting conference.
References
- Bigiel, F., Leroy, A. K., Walter, F. et al. 2011, ApJ 730, L13
- Buta R., Combes F.: 1996, Fundamental of Cosmics Physics 17, 95
- Combes, F., García-Burillo, S., Braine, J. et al. : 2011, A&A 528, A124
- Combes F., Rex M., Rawle T.D. et al. 2012, A&A, 538, L4
- Combes, F., García-Burillo, S., Braine, J. et al. : 2013, A&A 550, A41
- Daddi, E., Dickinson, M., Morrison, G. et al. 2007, ApJ, 670, 156
- Dekel, A., Birnboim, Y., 2006 MNRAS 368, 2
- Elbaz, D., Daddi, E., Le Borgne, D. et al. 2007, A&A, 468, 33
- Freundlich, J., Combes, F., Tacconi, L. J. et al. 2013, A&A in press
- Greve. T.R., Bertoldi, F., Smail, I. et al. : 2005, MNRAS, 359, 1165
- Hopkins, A.M., Beacom J.F.: 2006, ApJ, 651, 142
- Keres, D., Katz, N., Weinberg, D. H., Dave, R.: 2005 MNRAS 363, 2
- Levshakov, S. A., Combes, F., Boone, F. et al. 2012, A&A 540, L9
- Nagao, T., Maiolino, R., De Breuck, C. et al. 2012, A&A 542, L34
- Noeske, K. G., Weiner B.J., Faber S.M. et al. 2007, ApJ, 660, 43
- Saintonge, A., Kauffmann, G., Kramer, C. et al. 2011, MNRAS 415, 32
- Seaquist, E. R., Frayer, D. T.: 2000, ApJ 540, 765
- Solomon P., Downes D., Radford S., Barrett J.: 1997, ApJ 478, 144
- Tacconi L.J., Genzel R., Neri R. et al. : 2010, Nature 463, 781
- Tacconi L.J., Neri R., Genzel R. et al. : 2013, ApJ, in press
- Wuyts, S., Förster Schreiber, N. M., van der Wel, A. et al. 2011, ApJ 742, 96