Time Variability of Emission Lines for Four Active T Tauri Stars (I): October–December in 2010111Based on observations obtained at the Canada-France-Hawaii Telescope (CFHT) which is operated by the National Research Council of Canada, the Institut National des Sciences de l’Univers of the Centre National de la Recherche Scientifique of France, and the University of Hawaii.
Abstract
We present optical spectrophotometric monitoring of four active T Tauri stars (DG Tau, RY Tau, XZ Tau, RW Aur A) at high spectral resolution (), to investigate the correlation between time variable mass ejection seen in the jet/wind structure of the driving source and time variable mass accretion probed by optical emission lines. This may allow us to constrain the understanding of the jet/wind launching mechanism, the location of the launching region, and the physical link with magnetospheric mass accretion. In 2010, observations were made at six different epochs to investigate how daily and monthly variability might affect such a study. We perform comparisons between the line profiles we observed and those in the literature over a period of decades and confirm the presence of time variability separate from the daily and monthly variability during our observations. This is so far consistent with the idea that these line profiles have a long term variability (3-20 years) related to episodic mass ejection suggested by the structures in the extended flow components. We also investigate the correlations between equivalent widths and between luminosities for different lines. We find that these correlations are consistent with the present paradigm of steady magnetospheric mass accretion and emission line regions that are close to the star.
1 Introduction
Classical T Tauri stars (CTTSs) are low-mass pre-main sequence stars at the evolutionary stage when the surrounding accretion disks become optically visible, and firstly discovered by Joy (1945). CTTSs are distinguished by their rich permitted line emission which is produced mainly in the magnetic funnel flow originated from the inner disk edge (e.g., Muzerolle et al., 2001), and an additional optical/UV excess emission continuum (veiling) produced in ”hot spots” where the accreted material impacts the stellar surface (Calvet and Gullbring, 1998). The permitted lines often show inverse P Cygni profiles which may indicate funnel flows by the magnetospheric mass accretion (Najita et al., 2000, for review).
Moreover, many of the CTTSs host collimated jets (e.g., Hartigan et al., 1995; Eislöffel et al., 2000). Understanding their driving mechanism and their physical link with protostellar evolution are the most important issues in star formation theories. There is growing evidence that these jets are powered by disk accretion (Cabrit et al., 1990; Hartigan et al., 1995; Calvet, 1997). High-resolution observations have revealed internal flow motion consistent with rotation. This agrees with the idea that the jet removes excess angular momentum from the accreting material (Bacciotti et al., 2002; Coffey et al., 2004, 2007), but more detailed investigations are required for confirmation (see Cabrit et al., 2006; Coffey et al., 2012, for ongoing projects).
There are several theories to explain the driving mechanism of the jet and its physical link with mass accretion. The magneto-centrifugal wind models, including X-wind (Shu et al., 2000) and disk wind (Königl and Pudritz, 2000) models, are regarded as the most promising. The former proposes that the jet launches from the inner edge of the disk (within 0.1 AU of the star), while the latter proposes that the jet launching region covers a wider disk surface at a few AU scales. Furthermore, magnetic pressure and reconnection wind models are also candidates (e.g., Goodson et al., 1999), although the reconnection wind could be the non-steady state of breaking a magnetosphere which is similar to the X-wind. In this context, studies of jets are important for understanding not only star formation, but also circumstellar disks and the ongoing (or initial conditions of) planet formation. However, the limited angular resolutions of present telescopes are far from sufficient for resolving the jet launching or flow acceleration regions, which are predicted to be located within a few AU from the star.
Alternatively, simultaneous monitoring of jet structures and signatures of magnetospheric accretion would allow us to test theories of jet driving and mass accretion. Over the last decade, observations at high-angular resolutions have allowed us to reveal fine structures of jets and winds close to the star at AU, measure their proper motions and investigate their episodic mass ejection with a time scale of 3–20 years (e.g., Pyo et al., 2003; López-Martín et al., 2003; Krist et al., 2008; Agra-Amboage et al., 2011). Permitted emission lines, i.e., probable signature of mass accretion, are also known to show time variability (e.g., Petrov, 1990; Petrov et al., 1999, 2001a; Johns and Basri, 1995a; Alencar et al., 2005; Mendigutía et al., 2011). If the jet is driven by an X-wind as well as a reconnected wind, the emergence of new knots in the extended jets should be well correlated with the time variability of magnetospheric accretion because both the jet launching and material accretion occur on the inner edge of the disk. If the jet is driven by a disk-wind, such a correlation may be weak since the disk wind and the magnetospheric accretion are not directly related to each other. As such, we should be able to test theories of jets, wind and mass accretion.
We have thus started a monitoring project for four well studied active T Tauri stars: DG Tau, RY Tau, XZ Tau and RW Aur A (see Appendix for details of individual targets). These exhibit a variety of optical emission/absorption lines (see Section 3.2 for previous studies), and the extended jet or wind at a ”.1 resolution (see Appendix for a review). In this paper we present optical high-resolution spectroscopy for the first year observations of 2010. It is known that active CTTSs show short-term (daily, monthly and yearly) variabilities in line fluxes, line profiles and veiling continuum (Bouvier et al., 1993, 1995; Mendigutía et al., 2011). The daily variability for many CTTSs is due to a combination of stellar rotation (typically to 20 days, Bouvier et al., 1993; Choi and Herbst, 1996) and the non-uniform distribution of magnetospheric channel flow and the resultant hot spots on the stellar surface (Bouvier et al., 1993, 1995). Although cool spots similar to sunspots may also contribute to the variability, the effects are more prominent in weak-line T Tauri stars than in CTTSs (e.g., Herbst et al., 1994). In addition, the patterns of cool spots usually last for several periods or longer so their contribution to the daily variability may be unapparent. In contrast, active CTTSs may show such a short-term variability due to time-variable mass accretion as well as a long-term variability. An understanding of this variability for the target stars is necessary if we want to be able to detect variability related to episodic mass ejection over the other variabilities.
In Section 2 we describe the observations and data reduction. In Section 3 we show the line profiles, and investigate their time variabilities during our observations in comparison of those in the literature over decades. In Section 4 we show the equivalent widths and luminosities, the correlations, and comparisons with the continuum flux. Discussion and summary are described in Sections 5 and 6, respectively. Throughout the paper we assume a distance of 140 pc of our targets (Wichmann et al., 1998).
2 Observations and Data Reduction
We obtained high resolution spectra using the 3.6-m Canada-France-Hawaii Telescope (CFHT) with ESPaDOnS, CFHT’s Echelle spectropolarimetric device for the observation of stars, on six nights: October 21, November 17, 21, 25, 27 and December 17 in 2010. The observations were made using the ”object+sky spectroscopy mode”, for which the spectra of the object and sky are simultaneously obtained through different fibers. The spectra cover the wavelength range Å with a resolution of . This large spectral coverage of ESPaDOnS includes a number of emission lines. In this paper we present our study on the following permitted lines studied by Muzerolle et al. (1998) for 11 T Tauri stars: H 6563 Å, Pa 11 8863 Å, Ca II 8498/8542/8662 Å triplet, He I 5876/6678/7065 Å, O I 7772/8446 Å, and Na D 5890/5896 Å. We also show three forbidden lines which are formed in the jet regions for comparison: [O I] 6300 Å, [S II] 6731 Å and [Fe II] 7155 Å.
All four targets and two standard stars were observed each night consecutively and within a minutes interval. These were made with photometric conditions with the exception of December 17. The line and continuum luminosities are derived from the data, except for the December 17 observations, which were not obtained under stable sky transparency. The average signal-to-noise ratios at 8090 Å are , , , and for DG Tau, RY Tau, XZ Tau and RW Aur, respectively. Data were processed using the standard data reduction pipeline Upena provided by the CFHT, which is based on the Libre-ESpRIT package (Donati et al., 1997) , and the sky subtraction has been performed in our spectra. Furthermore, we have remove telluric absorption for the [O I] 6300 Å line in the spectra. The systemic velocity for each target star on each observation date was calibrated using photospheric absorption lines Li I 6708 Å and Ca I 6439 Å for DG Tau, RY Tau, and XZ Tau. The stellar photospheric absorption of RW Aur A was too shallow for accurate measurements of the velocity so we instead used the velocity by Folha and Emerson (2001), who tabulate the systemic velocity for a number of T Tauri stars including our four targets.
The large aperture of ESPaDOnS (1”.6 in diameter) compared with the seeing (0”.4–1”.0 during our observations) allows spectrophotometry. Two standard stars, HD 283642 and HD 42784, were also observed for each date for flux calibration. For accurate calibration at each line luminosity we have also made photometry of these two standard stars using the Tenagra 80-cm telescope in Arizona, USA, on November 17 and December 08, 2011. The measured magnitudes are listed in Table 1. The line fluxes of targets were calibrated by interpolating the photometric data to the target wavelength and comparing the derived fluxes with the photon counts in the ESPaDOnS spectra of the standard stars. The derived fluxes with two standard stars have discrepancies in the flux conversion factor up to 20, 30, at wavelengths (5500, 7100, and 9700 Å, respectively). We thus take the average of the two conversion factors obtained from two different standard stars, resulting the uncertainty of the absolute flux calibration to be up to 10, 15 and at 5500, 7100, and 9700 Å, respectively.
RW Aur A has a companion with a separation of 1”.4 (e.g., Ghez et al., 1993; Leinert et al., 1993). Our spectra obtained on October 21 and December 17 are suspected to have a contribution from the companion due to the relatively poor seeing on these dates (1”.0). Therefore, these spectra are not used in this paper. XZ Tau is also associated with a companion, and due to its small separation (0”.3) the spectra of both binary components were included in the ESPaDOnS aperture. However, the XZ Tau S component has often been brighter to much brighter than the 0”.3 separation companion at optical wavelengths and the emission line profiles are assumed to be applicable mostly to XZ Tau S. See Appendix for the details of confirmed/possible companions for individual objects.
3 Line Profiles
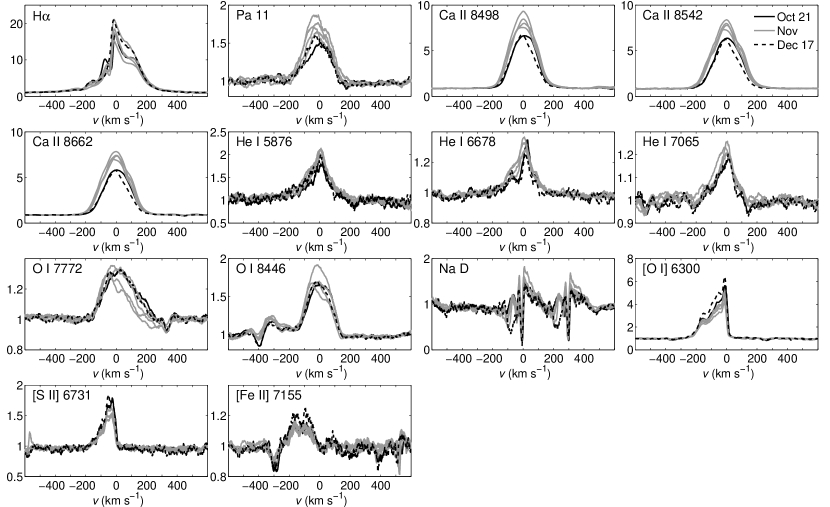
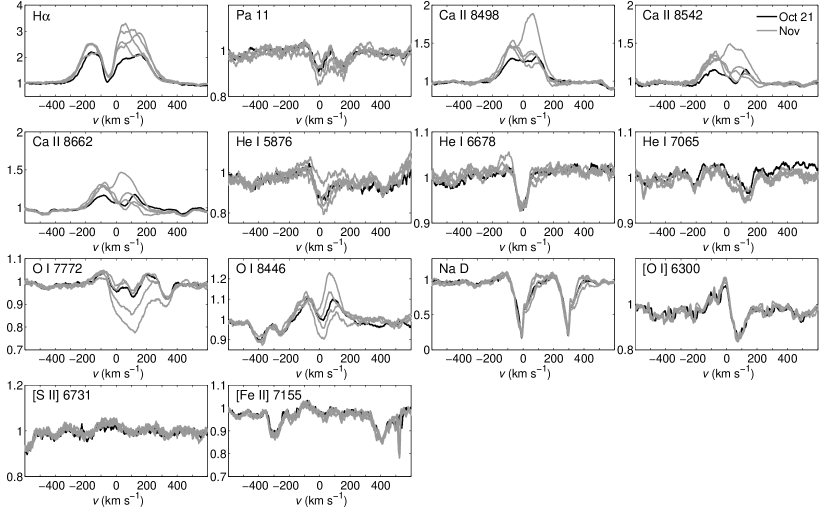
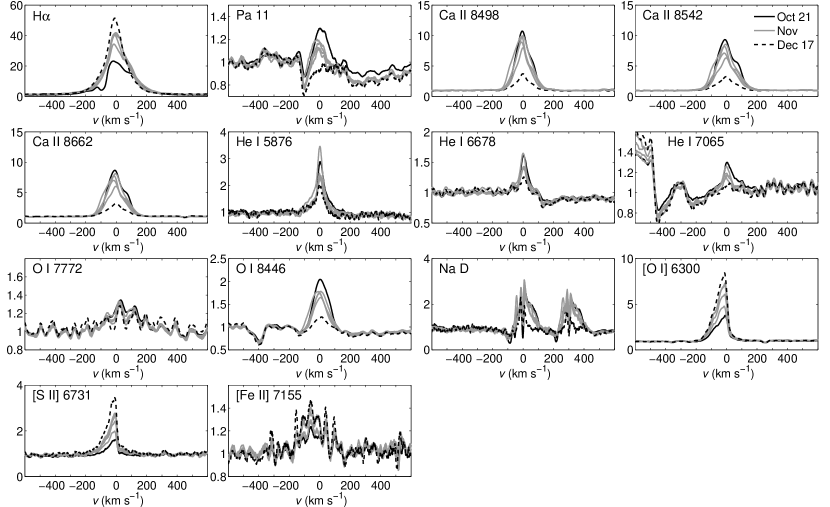
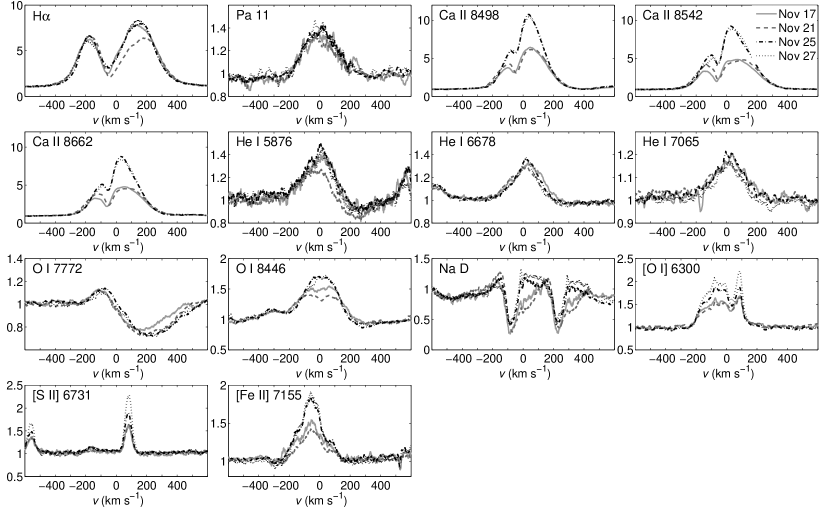
Figures 1–4 show the observed line profiles at the six epochs. The spectra have been adjusted to the continuum level and smoothed using a moving average over 15 data points of the reduced spectra for better signal-to-noise; the resolution is km s-1 after smoothing. We describe the time variation of the permitted lines during our observations in Section 3.1, and differences from those in previous publications in Section 3.2.
3.1 Variation of Permitted Line Profiles in 2010
3.1.1 DG Tau, RW Aur A
The observed line shapes do not vary much with the exception of the line-to-continuum ratio. In DG Tau, there is a weak redshifted absorption in the Ca II triplet (at km s-1) on November 21 which is not apparent in other nights.
In RW Aur A, the O I 8446 Å line profile is flatter at the peak on November 17 and 21 than the other two dates, and appears to be associated with shallow absorption at zero velocity. In the Na D profiles, the velocity range of the absorption is –150 to 0 km s-1 in November 25 and 27, while the profiles of November 17 and 21 are also associated with shallow absorption extending toward the positive velocity up to 150 km s-1.
3.1.2 RY Tau
In H, the redshifted emission components show a larger variation in the line-to-continuum ratio (by a factor of 2) than the blueshifted emission (). The profile of November 27 shows absorption at km s-1.
The Ca II emission shows slight redshifted absorption on October 21 and November 25, with slightly blueshifted absorption on November 17 (at km s-1), and absorption near the zero velocity on November 21 and 27.
For O I 7772 Å, the line shapes on October 21, November 17 and 21 show two absorption features (near the zero velocity and at km s-1) with small emission features on both sides. In contrast, the line shapes on November 25 and 27 show strong absorption ( km s-1 in FWHM) and shallow emission features on the blueshifted side only.
3.1.3 XZ Tau
The H profile on October 21 shows a blueshifted absorption at km s-1. On October 21 and November 17 the H and Ca II lines show marginal redshifted absorption at km s-1, and the He I lines show stronger central emission. The Pa 11 and He I 7065 Å emission features were absent on December 17. On the same date the blueshifted absorption in the Pa 11 line shows a larger wing-like absorption feature toward the zero velocity.
3.2 Differences from Previous Observations
The previous observations of our target lines are summarized in Table 2. While some line profiles are similar to ours, we find a number of differences which are described below for DG Tau, RY Tau, and RW Aur A. We limit our comparison to the shape of the permitted lines only.
3.2.1 DG Tau
Our H line profiles show a peak at km s-1, a dip (or an emission minimum) at km s-1 and marginal absorption at 70 km s-1. These are not seen in the profile observed in 1981 by Mundt (1984), at three epochs in 1988–1992 by Beristain et al. (2001), or in 1996 by Muzerolle et al. (1998). A blueshifted absorption line at km s-1 is observed only in our spectra, and two epochs shown in Beristain et al. (2001).
The O I 7772 Å line observed in 1996 (Muzerolle et al., 1998) shows four peaks at , 0, 150 and 350 km s-1. In contrast, our spectra show a single peak without any absorption on most of the nights observed, except for November 21, where it shows weak absorption near the zero velocity. The O I 8446 Å line observed in 1996 (Muzerolle et al., 1998) showed a double-peak feature which may has been caused by shallow absorption at zero velocity. This absorption is seen only marginally (if not absent) in the profile observed in 1987 (Hamann and Persson, 1992) and in Figure 1.
The Na D profiles observed in 1981 (Mundt, 1984) are associated with broader and shallower blueshifted absorption at to km s-1.
The H and He I 5876 Å profiles in Mundt (1984); Beristain et al. (2001) shows another emission component at km s-1, corresponding to the extended jet (see Appendix for references). This may not be due to the intrinsic variability of the emission line regions, since the observed brightness should also depends on the slit width and position (or the size and position of the aperture), and also on the seeing.
3.2.2 RY Tau
The H profiles in Figure 2 and those in most of the literature show two distinct emission components at blueshifted and redshifted velocities, with deep absorption at zero velocity. The brightness of these two components are comparable in Figure 2 and most of the profiles in the literature. However, the blueshifted emission is significantly fainter than the redshifted emission in several epochs in 1980–1998 (Mundt and Giampapa, 1982; Zajtseva et al., 1985; Petrov, 1990; Mendigutía et al., 2011). The blueshifted emission is marginal, if not absent, in one of the profiles observed in 1984 (Zajtseva et al., 1985); this profile instead shows shallow blueshifted absorption at to km s-1. Zajtseva et al. (1985) and Petrov (1990) show that such a variation occurred within 1–2 months.
Most of the H profiles show a deep absorption feature at the zero velocity in which the line-to-continuum ratio . However, the emission level at this level is close to the peak of either the blueshifted or redshifted emission in 1984 (Edwards et al., 1987). Furthermore, of all the profiles, the shallow absorption at the peak of the redshifted emission is observed only in our spectra, in 1984 (Edwards et al., 1987), and possibly two epochs in 1988 (Petrov, 1990).
The Ca II profiles observed in 1987 (Hamann and Persson, 1992) are similar to our observed features from November 17, in which the redshifted emission shows a brighter peak than the blueshifted one. In contrast, those observed in 1989–1996 (Petrov et al., 1999) are significantly different from any of the other profiles. The former consist of two emission peaks at and 150 km s-1 and absorption at the zero velocity with the bottom of the absorption 20–30% below the continuum level during their observations.
Some Na D profiles observed in 1987–1996 (Petrov, 1990; Petrov et al., 1999) appear to be associated with marginal additional blueshifted and/or redshifted absorption at the threshold of the absorption feature, making the entire absorption broader. The Na D profiles observed in January 1999 (Mendigutía et al., 2011) show a remarkable emission component on the blueshifted side.
3.2.3 RW Aur A
The peak of H profiles in the redshifted emission is brighter than that of the blueshifted emission in most of the profiles, but nearly the same for a single epoch in 1988–1992 (Beristain et al., 2001) and on November 25, 2010 (Fig. 4). The redshifted emission is slightly fainter than the blueshifted emission in 1981 (Mundt, 1984). Most of the line profiles, including those in Figure 4, show a velocity km s-1 at the bottom of the central absorption. In contrast, it is km s-1 in some profiles in 1989–1999 (Muzerolle et al., 1998; Petrov et al., 2001a; Alencar et al., 2005). Some of the Pa 11 profiles in 1998 (Petrov et al., 2001a) show a blueward asymmetry. This contrasts to the other profiles in the literature and Fig. 4, which show a symmetric profile about the stellar velocity.
The Ca II profiles in Figure 4, in particular those from November 21 and 25, are similar to most of those in 1986–1999 (Hamann and Persson, 1992; Petrov et al., 2001a; Alencar et al., 2005). Our profiles from November 17 and 27 are similar to that of 1996 (Muzerolle et al., 1998), but the peak of the redshifted emission shows an asymmetry in the latter, perhaps due to the presence of shallow absorption. Two profiles observed in 1986–1987 (Alencar et al., 2005) are remarkably different from the others. Both are nearly symmetric about the stellar velocity, and one of them is triangular while the other is flat-topped.
Beristain et al. (2001) show that the He lines in CTTSs often have a broad component (BC, FWHM km s-1) and a narrow component (NC, FWHM km s-1) which are approximately symmetric about the zero velocity. All of the He I 5876 Å lines in the literature in Table 2 clearly show both the BC and NC. In contrast, our profiles do not clearly show the presence of a NC.
Some of the O I 7772 Å profiles observed in 1995–1999 (Petrov et al., 2001a) are significantly different from the others. These are dominated by an emission feature whose peak is blueshifted at km s-1. Some of them show a redshifted absorption without blueshifted emission. The O I 8446 Å line in 1996 (Muzerolle et al., 1998) shows a redshifted absorption at km s-1.
4 Equivalent Widths and Luminosities
We measure the equivalent widths and luminosities of fourteen lines for each target. These are tabulated in Tables 3 and 4, respectively. The latter also includes the continuum luminosities at 5000 and 8000 Å, and has been extinction-corrected. The following discussion is only for permitted lines since they are formed in the near-stellar region which is the focus of this study. For each target, changes in equivalent widths are remarkably different between lines. In DG Tau, the change is 45–50% for most of the emission lines but only 12 and 21% in He I 5876 and 6678 Å, respectively; in RY Tau, it is a factor of 4 for O I 8446 Å but 1.5 in H; in XZ Tau, it is a factor of 4 for the Ca II triplet but only 7% for H; in RW Aur A, the change is in Ca II triplets but for H. Among the emission features observed, O I 8446 Å and the Ca II triplet tend to show a large variation in equivalent width. In contrast, He I and H are the most stable lines. The equivalent widths for RY Tau are usually smaller than other stars except for the O I 7772 Å line, in which RW Aur A has stronger absorption feature than RY Tau.
Table 2 shows the equivalent widths of H observations from the literature. In DG Tau, the equivalent widths during our observations (74–107 Å) are significantly larger than those measured by Muzerolle et al. (1998) in 1988–1992 (46 Å) and smaller than those measured by Mundt (1984) (110 Å) in 1981. For RY Tau and RW Aur A, i.e, targets for which optical spectroscopy has been extensively made, the equivalent widths we observed (10–15 and 65–80 Å, respectively) are within the ranges in the literature (6–25 and 50–123 Å, respectively). It is intriguing that the equivalent widths measured by Fernandez et al. (1995) varied by a factor of 2 in the four days of their observations (September 15–19, 1989), while those in our data show only variability.
The luminosity varies in H and in those lines without absorption by a factor of for each star. A larger variation is observed for XZ Tau on Dec 17, on which the line luminosities are lower than the other dates by a factor of up to 4–13 for the He I 5876Å and O I 8446 Å line and the Ca II triplet. Similar but more marginal decrease is also seen in line-to-continuum ratios in Figure 3 and equivalent widths in Table 3.
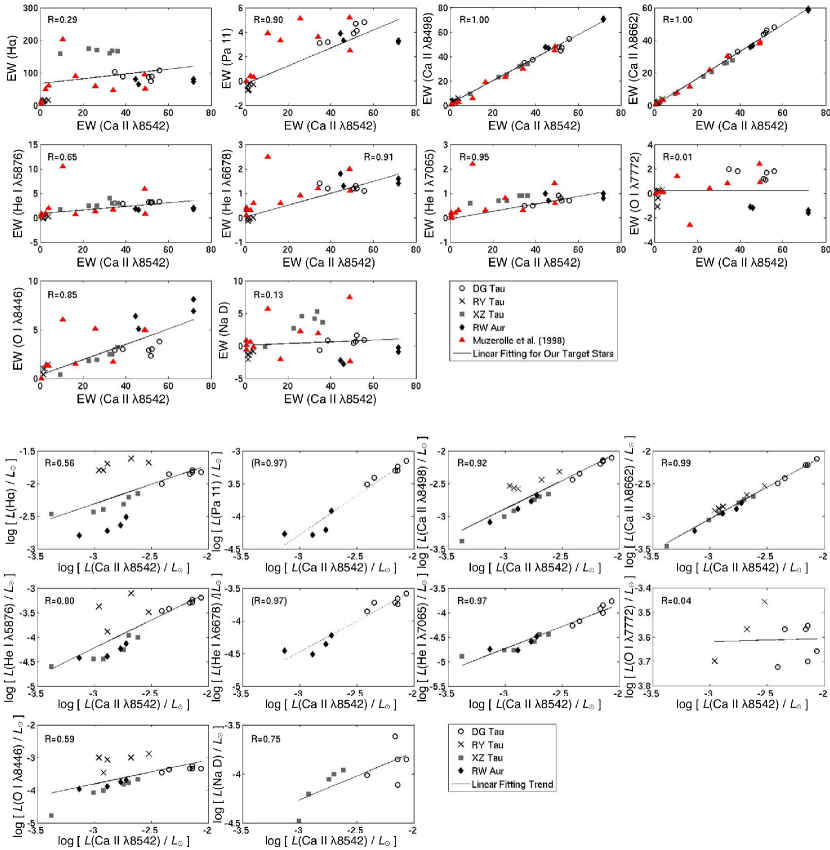
Figure 5 shows the correlation of equivalent widths and extinction-corrected line luminosities between Ca II 8542 Å and the other 10 lines. We select Ca II 8542 Å for reference since this line is known to show a good correlation with accretion luminosity (Muzerolle et al., 1998; Calvet et al., 2000). Among the 10 lines, the other two Ca II lines show an excellent correlation with Ca II 8542 Å. Three He I lines, O I 8446 Å, and Pa 11 also have a fairly strong correlations with Ca II 8542 Å. There is little to no correlation for Na D, O I 7772 Å, and H lines, which have apparent absorption features in most of the target stars. The upper panel of Figure 5 also shows the equivalent widths measurements for 11 T Tauri stars by Muzerolle et al. (1998). The measurements between Muzerolle et al. (1998) and our observation show similar correlations between Ca II 8542 Å and the other lines, except for a single object (BP Tau) in the He I lines.
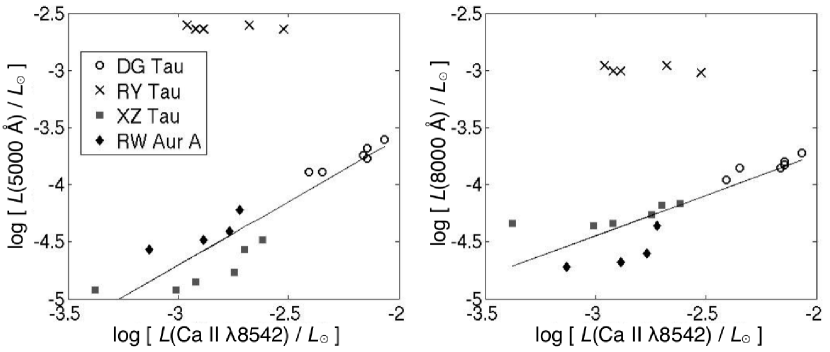
Figure 6 shows the extinction-corrected luminosity of the continuum level compared with the Ca II 8542 Å line for the four target stars. In DG Tau, XZ Tau and RW Aur A the continuum luminosity increases with the Ca II 8542 Å luminosity. These are fit well with a single regression line at 5000 and 8000 Å, respectively. The 5000 Å continuum shows a larger increase (by a factor of dex over dex for the Ca II 8542 Å luminosity) than 8000 Å ( dex). In contrast to these three objects the continuum luminosity remained constant in RY Tau both at 5000 and 8000 Å despite the presence of variation in the Ca II 8542 Å luminosity.
5 Discussion
5.1 Consistency with The Present Paradigm for Magnetospheric Mass Accretion
It is believed that, in many cases, permitted line emission associated with CTTSs primarily originates from magnetospheric accretion columns (e.g., Najita et al., 2000, for a review). Although their complicated geometry has been extensively discussed over the past decade (see Bouvier et al., 2007b, for a review), models with a simplified geometry (i.e., with stellar dipole magnetic field axisymmetric about the stellar rotation axis) have been successful in explaining many line profiles and their luminosities (e.g., Muzerolle et al., 2001). The accretion flow originates from the inner disk edge, and hits the stellar surface at a few hundred km s-1. This heats up the stellar surface and creates ”hot spots” observed as an excess in the UV continuum. The distribution of such hot spots is not usually uniform, and as a result, this causes periodic time variability corresponding with the stellar rotation. This has been extensively observed over decades to measure the rotational period of many T Tauri stars (see Herbst et al., 2007, for a review). This scenario also explains the good correlation between the accretion luminosity measured using the UV excess and luminosities of permitted line such as the Ca II triplet (Muzerolle et al., 1998; Calvet et al., 2000). The collision of the accretion flow on the stellar surface also causes accretion shock toward the accretion flow. This explains the presence of NC in addition to BC in some emission line profiles such as He I (Section 3.1).
In contrast, the contribution from the inner wind may be significant for Balmer lines in active CTTSs (e.g., Takami et al., 2001, 2003; Alencar et al., 2005; Kurosawa et al., 2006). The Na D lines in many objects and Balmer lines in some objects show blueshifted absorption. This indicates the presence of such a wind with velocity up to a few hundred km s-1, i.e., comparable to that of the emission line regions. In addition to the above lines, Beristain et al. (2001) propose that the BC in He I lines originates from an inner wind in some objects. In either case, it is likely that the permitted emission line regions are located within 0.1 AU of the star.
The above paradigm for magnetospheric mass accretion and emission line regions has been established via observations of a number of CTTSs, but without significant consideration of their time variation in most (if not all) cases. However, it is well known that emission lines and UV excess are time-variable even on a scale of several days (see Sections 3, 4, and Appendix, and references therein). Even so, the measurements of line-vs.-line and line-vs.-continuum in Section 4 agree well with the present paradigm. The upper panel of Figure 5 shows that the correlation we observed with different epochs for four CTTSs is similar to that based on single-epoch observations of 11 T Tauri stars by Muzerolle et al. (1998). In Figure 5, a good correlation between the Ca II, He I, and O I 8446 Å and Pa 11 lines is explained if these are mainly associated with magnetospheric accretion columns. The worse correlations with H, O I 7772 Å and Na D may be due to either different excitations and/or optical thicknesses, or contributions from the inner wind. The former explanation may apply in particular for O I 7772 Å, in which remarkable redshifted absorption is observed for RY Tau and RW Aur A. The latter explanation may apply in particular for (1) H, in which the contribution from the inner wind is suggested (e.g., Takami et al., 2001, 2003; Alencar et al., 2005; Kurosawa et al., 2006); and (2) Na D lines, in which blueshifted absorption is observed for XZ Tau and RW Aur A (Figs 3 and 4, respectively).
In Figure 6, the continuum luminosity at 5000 Å shows good correlation with the Ca II 8542 Å luminosity. Relatively large variations in DG Tau, XZ Tau and RW Aur A are explained if the UV excess (or “veiling continuum”) significantly contributes to the total continuum luminosity; the constancy of the continuum in RY Tau is explained if the contribution of veiling continuum to the total flux is negligible compared with the stellar flux. This may have caused difficulties in measuring the rotational period of the star using the technique of photometric monitoring (see Appendix for details).
Stellar and veiling continuum are often separated when comparing the stellar absorption features with template spectra of main sequence stars (e.g., Hartigan et al., 1995; Muzerolle et al., 1998). In this paper we do not show the calculation of veiling analysis since we find it difficult in particular for RW Aur A, whose stellar absorption was fairly shallow during our observations. Furthermore, the stellar absorption is fairly shallow compared with the noise level at the continuum for DG Tau. This results in large uncertainties when we measure the veiling. The veiling for RY Tau is very small and we can only get the upper limit ( at Å) of the veiling value. The only successful measurement is for XZ Tau, and we find that the veiling for XZ Tau is between to 1.4 at Å during the six observation dates.
5.2 Long-Term Variations in Line Profiles, Equivalent Widths and Luminosities
Observations of the extended jet/outflows associated with DG Tau, XZ Tau and RW Aur A suggest that the mass ejections from these CTTSs are episodic. DG Tau and RW Aur A show a collimated jet, and the spatial intervals of the knots and their proper motions suggest the intervals of such mass ejection of 2.5–5 years for DG Tau (Pyo et al., 2003; Agra-Amboage et al., 2011; Rodríguez et al., 2012), and 3–20 years for RW Aur A (López-Martín et al., 2003). In the case of XZ Tau, the observations of the bubble-like flows and simulations suggest the intervals of episodic mass ejection of 5–10 years (Krist et al., 2008). See Appendix for details of these jets/outflows.
Theories suggest that energetic mass ejection is powered by mass accretion (e.g., Shu et al., 2000; Königl and Pudritz, 2000), and this has been supported by observations, e.g., a good correlation between the accretion luminosity vs. forbidden line luminosity associated with the jet/wind or inferred mass ejection rate (Hartigan et al., 1995; Calvet, 1997). This is based on the assumption of steady mass ejection and accretion, but following this, it is natural to assume that the episodic mass ejection suggested by the jet/wind structures is caused by episodic mass accretion. Episodic mass accretion is observed in some young stellar objects as FUor or EXor bursts (e.g., Herbig, 1989), but the link with mass ejection has not been observationally investigated in detail. The measurements of the time lag between episodic mass ejection and accretion would be useful for exploring their physical link.
Episodic mass accretion associated with FUors and EXors is often observed via photometry at optical wavelengths. However, such optical bursts may also be observed due to sudden change in obscuration or extinction by the dusty environments associated with the circumstellar disk (UXors). Indeed, such events were reported for one of our targets, RY Tau (Zajtseva et al., 1985; Herbst and Stine, 1984; Herbst et al., 1994; Petrov et al., 1999, see also Appendix). The measurements of the change in optical emission lines, either the shape of line profiles or equivalent widths, would be able to overcome this problem.
However, the shape of line profiles and equivalent widths also show variability over a few days or months — i.e., variability not directly related to the above issue. As shown in Sections 3 and 4, daily variability in line profiles is also observed for H, Ca II, and O I lines in RY Tau, and the redshifted side of the Na D lines in RW Tau A; all the objects we observed show the daily variability in the equivalent widths and luminosities of the emission lines. Possible mechanisms for this variability are: (1) a combination of stellar rotation and non-axisymmetric accretion; and (2) the time variation of mass accretion (and also mass ejection). The former should have a period of 2–20 days, and such a periodicity in line profiles and luminosities was observed in some CTTSs including RW Aur A (Petrov et al., 2001a), AA Tau (Bouvier et al., 2007a), Sz 68 (Johns-Krull and Hatzes, 1997) and SU Aur (Giampapa et al., 1993; Johns and Basri, 1995b; Petrov et al., 1996). In contrast, photometric monitoring of active CTTSs shows irregular variability in some stars even in a single rotation period, making it difficult to determine their rotational periods (see Appendix). Among our targets, such variability is measured in RW Aur A. Furthermore, tidal interaction with a close binary companion could cause periodic time variability of the mass accretion rate, and thereby the emission line profiles, equivalent widths and luminosities (e.g., Basri et al., 1997; Petrov et al., 2001a). In this context, the variability over 2–20 days may not be always caused by a combination of stellar rotation and non-axisymmetric accretion.
As described in Section 3.2, we find clear differences in some line profiles between the literature and our observations. This is consistent with the presence of long-term (1 year), or transient variability (e.g., Oliveira et al., 2000) is detectable over the daily and monthly variabilities. Such variation may be related to the episodic mass ejection suggested by the high-resolution imaging. Continuous and simultaneous observations of both optical emission lines and extended jet/wind structure are necessary to investigate this.
6 Summary
The time variation of the permitted emission line profiles for four active CTTSs in six nights of observations in 2010 is presented in this study. The correlations of equivalent widths and of extinction-corrected luminosities between different lines are also investigated. We show similar correlations between our observation in different epochs and single-epoch observations of 11 T Tauri stars by Muzerolle et al. (1998). The good correlations between certain lines suggest these lines are mainly associated with magnetospheric mass accretion. These measurements support the paradigm for steady magnetospheric mass accretion and the emission line regions which are proximity to the star.
Moreover, comparing to samples in the literature, we confirm the presence of time variability separate from the daily and monthly variabilities during our observations. We therefore expect to detect a variability over a time scale of 1 years due to time-variable mass accretion in the planned observations. This might help explore the time correlation between mass ejection seen in the jet/wind structure and mass accretion probed by permitted emission lines, and further understand the driving mechanism of the jet/wind and the physical link with mass accretion. A long-term monitoring of magnetospheric mass accretion and the extended jets is ongoing, and the analysis of data obtained in 2011 and 2012 are in progress.
Appendix A Note for Individual Targets
A.1 DG Tau
The DG Tau jet is one of the best studied among those associated with CTTSs. An extended jet structure has been observed at various wavelengths including optical (Mundt and Fried, 1983; Mundt et al., 1987; Solf and Böhm, 1993; Kepner et al., 1993; Lavalley et al., 1997; Eislöffel and Mundt, 1998; Lavalley-Fouquet et al., 2000; Dougados et al., 2000; Bacciotti et al., 2000, 2002; Coffey et al., 2007, 2008), near-infrared (Takami et al., 2002; Pyo et al., 2003; Beck et al., 2008; Agra-Amboage et al., 2011), X-ray (Güdel et al., 2005, 2008) and centimeter wavelengths (Bieging et al., 1984; Rodríguez et al., 2012). In the above literature, the jet structure was observed at an angular resolution of 0”.1 by Kepner et al. (1993); Dougados et al. (2000); Bacciotti et al. (2000, 2002); Pyo et al. (2003); Coffey et al. (2007, 2008); Beck et al. (2008); Agra-Amboage et al. (2011); Rodríguez et al. (2012). Models and theoretical work specifically for this jet have been made by, e.g., Raga et al. (2001); Anderson et al. (2003); Pesenti et al. (2004); Cerqueira and de Gouveia Dal Pino (2004); Massaglia et al. (2005); Günther et al. (2009). Their proper motions and inferred episodic mass ejection were extensively studied in Pyo et al. (2003), followed by Agra-Amboage et al. (2011); Rodríguez et al. (2012). Agra-Amboage et al. (2011) derived intervals between knots of 2.5 years between 1995 and 2005. This is smaller by a factor of 2 than that provided by Pyo et al. (2003); Rodríguez et al. (2012) (5 years).
Neither lunar occultations nor near-infrared speckle imaging show the evidence for a binary companion in a separation range of 0”.005–10” (Leinert et al., 1991, 1993; Simon et al., 1992; Ghez et al., 1993), but near-infrared interferometry by Colavita et al. (2003) does not exclude a possibility of the presence of a close companion with a separation of 0”.1.
The rotational period of the star was measured through long-term photometric monitoring campaigns in the bands, specifically COYOTES I and II (Bouvier et al., 1993, 1995). Based on the COYOTES I data Bouvier et al. (1993) measured a period of 6.3 days with 99.9% confidence. In contrast, the COYOTES II data in the do not clearly show any significant period (Bouvier et al., 1995). However, Bouvier et al. (1995) report that the combination of the COYOTES I and II data still show a rotational period of 6.3 days with 95% confidence in the -band.
A.2 RY Tau
The extended optical jet has been observed by St-Onge and Bastien (2008); Agra-Amboage et al. (2009). The latter provided the image of the jet at an angular resolution of 0”.2. Near-infrared speckle imaging observations did not show the presence of a binary companion at 0”.1–1” (Ghez et al., 1993; Leinert et al., 1993). Bertout et al. (1999) measured the variability of the astrometric motion measured using Hipparcos and interpreted it as indicative of a binary with minimum separation of 3.3 AU. However, Agra-Amboage et al. (2009) point out that their results may be due to ”UXor-like occultation events, which enhance emission from the blueshifted jet and/or scattering cavity relative to the occulted photosphere.” Herbig (1977) suspected that RY Tau is a spectroscopic binary with an amplitude of 25 km s-1, however, more recent measurement with a higher accuracy did not confirm this (Hartmann et al., 1986; Petrov et al., 1999).
RY Tau has long been subject to extensive photometric monitoring. The COYOTE I data suggest a period of days (Bouvier et al., 1993). Bouvier et al. (1993) point out that this cannot result from a rotational model since, for a measured sin 50 km s-1 (Hartmann and Stauffer, 1989; Petrov et al., 1999), a rotational period of 24 days would imply a stellar radius of 24 or larger. Other possible periods discussed to date include 5.6 (Herbst et al. 1987, but not confirmed by Herbst & Koret 1988 and Bouvier et al. 1993) and 66 days (Herbst et al., 1987, but not for the rotation period). The above three periods are close to harmonic or sub-harmonic multiples of one another (Bouvier et al., 1993). RY Tau also shows a peculiar photometric variability with larger variations of brightness accompanied by a near constancy of color. Two abrupt brightening events were recorded in 1983/1984 and 1996/1997 reminiscent of UXor events, interpreted as variable obscuration by circumstellar dust (Zajtseva et al., 1985; Herbst and Stine, 1984; Herbst et al., 1994; Petrov et al., 1999).
A.3 XZ Tau
This object is known to host an unusual bubble-like outflow at an angular scale of 5” (Krist et al., 1997, 1999, 2008; Hioki et al., 2009). All of these observations were made at an angular resolution of 0”.1. Krist et al. (2008) have shown marked changes in the brightness distribution of the bubble through observations over a decade. Models specific for the bubble outflow have been provided by, e.g., Coffey et al. (2004); Krist et al. (2008). Based on simulations, Krist et al. (2008) attributed the observed structure to interactions between ambient material and a pulsed jet, whose intervals are 5-10 years. XZ Tau is a binary system with a separation of 0”.3 (Haas et al., 1990; Ghez et al., 1993; White and Ghez, 2001; Hartigan and Kenyon, 2003; Beck et al., 2008). The spectrum of the S component indicates that it is a typical T Tauri star, while the N component has large spectral veiling and numerous emission lines (Hartigan and Kenyon, 2003). Recent VLA observations by Carrasco-González et al. (2009) have revealed that the S component is a close binary with a separation of 0”.09.
Photometric monitoring by COYOTES II measured a periodicity of 2.6 days at a confidence level of (Bouvier et al., 1995). Bouvier et al. (1995) stated that it may imply too large equatorial velocity of the star (46.3 km s-1) compared with those of active T Tauri stars (usually 20 kms-1, e.g., Hartmann and Stauffer, 1989), but it is comparable to that measured in RY Tau ( km s-1, Petrov et al., 1999). Ground-based photometry from 1962 to 1981 (Herbst et al., 1994) has shown variations of mag in the band. All of these photometric measurements were made for the binary as a whole.
Variability of each binary component has been monitored using the Hubble Space Telescope over 10 years in -band (1995–2004, Krist et al., 2008). Coffey et al. (2004); Krist et al. (2008) reported a dramatic brightening (3 mag) of XZ Tau N in 1998–2002, suggesting that it is an EXor-type variable (Herbig, 1989). In 2001, its magnitude was larger than XZ Tau S by 0.5 mag. Krist et al. (2008) shows that XZ Tau S was far less variable ( 0.5 mag) during the period of monitoring, and it was brighter than XZ Tau N by 1–3 mag except in 2001. In addition to the optical wavelengths, variability in -band (1.65 ) was also observed over a 3–15 year period (Hioki et al., 2009).
A.4 RW Aur A
Similar to DG Tau, there are a number of observations for the extended jet associated with RW Aur A at optical (Hirth et al., 1994; Bacciotti et al., 1996; Mundt and Eislöffel, 1998; Dougados et al., 2000; Woitas et al., 2002, 2005; López-Martín et al., 2003; Coffey et al., 2004, 2012; Melnikov et al., 2009; Liu and Shang, 2012) and near-infrared wavelengths (Davis et al., 2003; Pyo et al., 2006; Beck et al., 2008; Hartigan and Hillenbrand, 2009). Among them, Dougados et al. (2000); Woitas et al. (2002); Pyo et al. (2006); Beck et al. (2008); Melnikov et al. (2009); Hartigan and Hillenbrand (2009) show the jet structure at an angular resolution of 0”.1. As many of these papers show, RW Aur A is associated with a jet on both blueshifted and redshifted sides, with the latter brighter than the former. This contrasts with many other CTTSs, in which the redshifted emission is absent close to the star due to obscuration by a circumstellar disk (see Eislöffel et al., 2000, for a review). Many of above publications also show that the kinematics of the RW Aur A jet are asymmetric, measured at and km s-1, respectively. Liu and Shang (2012) interpret such an asymmetry is a result of asymmetric launching of the wind by the underlying magnetic field that is asymmetric on the opposite side of the disk, in a way that the linear momentum is conserved. Moreover, López-Martín et al. (2003) measured a proper motion of the RW Aur A jet of 0”.17–0”.27 yr-1 and 0”.26 for the redshifted and blueshifed sides of the jet, respectively. These authors propose that the distribution of the knots close to the star is explained by time variable mass ejection with at least two modes: one irregular and asymmetric on timescale of 3–10 years, and another more regular with an -year period.
RW Aur A has a companion with a separation of 1”.4 (Ghez et al., 1993; Leinert et al., 1993; Dougados et al., 2000; White and Ghez, 2001). The jet described above is associated with RW Tau A (Dougados et al., 2000). RW Aur A is also a suspected spectroscopic binary (Petrov et al., 2001b).
RW Aur A shows a complicated variability in optical continuum, emission and absorption lines. Herbst et al. (1994) classified this star as ”irregular variability” (type II) through their monitoring observations of the optical continuum over 20 years. Gahm et al. (1999); Petrov et al. (2001a, b) observed variations in radial velocity and emission/absorption line properties over 2.77- and 5.5-day periods. These authors attributed this to a close low-mass companion or to a rotationally modulated accretion “hot spot”. In contrast, Alencar et al. (2005) observed, in bright emission lines, 2.77- and 3.9-day periods in their data in 1992, and 4.2- and 5.5-day periods in 1999. Unlike RY Tau, no abrupt brightening is identified over 20 years of photometry, combined by Herbst et al. (1994).
References
- Agra-Amboage et al. (2009) Agra-Amboage, V., Dougados, C., Cabrit, S., Garcia, P. J. V., and Ferruit, P.: 2009, A&A 493, 1029
- Agra-Amboage et al. (2011) Agra-Amboage, V., Dougados, C., Cabrit, S., and Reunanen, J.: 2011, A&A 532, A59
- Alencar et al. (2005) Alencar, S. H. P., Basri, G., Hartmann, L., and Calvet, N.: 2005, A&A 440, 595
- Anderson et al. (2003) Anderson, J. M., Li, Z.-Y., Krasnopolsky, R., and Blandford, R. D.: 2003, ApJ 590, L107
- Bacciotti et al. (1996) Bacciotti, F., Hirth, G. A., and Natta, A.: 1996, A&A 310, 309
- Bacciotti et al. (2000) Bacciotti, F., Mundt, R., Ray, T. P., Eislöffel, J., Solf, J., and Camezind, M.: 2000, ApJ 537, L49
- Bacciotti et al. (2002) Bacciotti, F., Ray, T. P., Mundt, R., Eislöffel, J., and Solf, J.: 2002, ApJ 576, 222
- Basri et al. (1997) Basri, G., Johns-Krull, C. M., and Mathieu, R. D.: 1997, AJ 114, 781
- Beck et al. (2008) Beck, T. L., McGregor, P. J., Takami, M., and Pyo, T.: 2008, ApJ 676, 472
- Beristain et al. (2001) Beristain, G., Edwards, S., and Kwan, J.: 2001, ApJ 551, 1037
- Bertout et al. (1999) Bertout, C., Robichon, N., and Arenou, F.: 1999, A&A 352, 574
- Bieging et al. (1984) Bieging, J. H., Cohen, M., and Schwartz, P. R.: 1984, ApJ 282, 699
- Bouvier et al. (2007a) Bouvier, J., Alencar, S. H. P., Boutelier, T., Dougados, C., Balog, Z., Grankin, K., Hodgkin, S. T., Ibrahimov, M. A., Kun, M., Magakian, T. Y., and Pinte, C.: 2007a, A&A 463, 1017
- Bouvier et al. (2007b) Bouvier, J., Alencar, S. H. P., Harries, T. J., Johns-Krull, C. M., and Romanova, M. M.: 2007b, Protostars and Planets V pp 479–494
- Bouvier et al. (1993) Bouvier, J., Cabrit, S., Fernandez, M., Martin, E. L., and Matthews, J. M.: 1993, A&A 272, 176
- Bouvier et al. (1995) Bouvier, J., Covino, E., Kovo, O., Martin, E. L., Matthews, J. M., Terranegra, L., and Beck, S. C.: 1995, A&A 299, 89
- Cabrit et al. (1990) Cabrit, S., Edwards, S., Strom, S. E., and Strom, K. M.: 1990, ApJ 354, 687
- Cabrit et al. (2006) Cabrit, S., Pety, J., Pesenti, N., and Dougados, C.: 2006, A&A 452, 897
- Calvet (1997) Calvet, N.: 1997, in B. Reipurth and C. Bertout (eds.), Herbig-Haro Flows and the Birth of Stars, Vol. 182 of IAU Symposium, pp 417–432
- Calvet and Gullbring (1998) Calvet, N. and Gullbring, E.: 1998, ApJ 509, 802
- Calvet et al. (2000) Calvet, N., Hartmann, L., and Strom, S. E.: 2000, Protostars and Planets IV p. 377
- Calvet et al. (2004) Calvet, N., Muzerolle, J., Briceño, C., Hernández, J., Hartmann, L., Saucedo, J. L., and Gordon, K. D.: 2004, AJ 128, 1294
- Carrasco-González et al. (2009) Carrasco-González, C., Rodríguez, L. F., Anglada, G., and Curiel, S.: 2009, ApJ 693, L86
- Cerqueira and de Gouveia Dal Pino (2004) Cerqueira, A. H. and de Gouveia Dal Pino, E. M.: 2004, A&A 426, L25
- Choi and Herbst (1996) Choi, P. I. and Herbst, W.: 1996, AJ 283, 283
- Coffey et al. (2008) Coffey, D., Bacciotti, F., and Podio, L.: 2008, ApJ 689, 1112
- Coffey et al. (2007) Coffey, D., Bacciotti, F., Ray, T. P., Eislöffel, J., and Woitas, J.: 2007, ApJ 663, 350
- Coffey et al. (2004) Coffey, D., Bacciotti, F., Woitas, J., Ray, T. P., and Eislöffel, J.: 2004, ApJ 604, 758
- Coffey et al. (2012) Coffey, D., Rigliaco, E., Bacciotti, F., Ray, T. P., and Eislöffel, J.: 2012, ApJ 749, 139
- Colavita et al. (2003) Colavita, M., Akeson, R., Wizinowich, P., Shao, M., Acton, S., Beletic, J., Bell, J., Berlin, J., Boden, A., Booth, A., Boutell, R., Chaffee, F., Chan, D., Chock, J., Cohen, R., Crawford, S., Creech-Eakman, M., Eychaner, G., Felizardo, C., Gathright, J., Hardy, G., Henderson, H., Herstein, J., Hess, M., Hovland, E., Hrynevych, M., Johnson, R., Kelley, J., Kendrick, R., Koresko, C., Kurpis, P., Le Mignant, D., Lewis, H., Ligon, E., Lupton, W., McBride, D., Mennesson, B., Millan-Gabet, R., Monnier, J., Moore, J., Nance, C., Neyman, C., Niessner, A., Palmer, D., Reder, L., Rudeen, A., Saloga, T., Sargent, A., Serabyn, E., Smythe, R., Stomski, P., Summers, K., Swain, M., Swanson, P., Thompson, R., Tsubota, K., Tumminello, A., van Belle, G., Vasisht, G., Vause, J., Walker, J., Wallace, K., and Wehmeier, U.: 2003, ApJ 592, L83
- Davis et al. (2003) Davis, C. J., Whelan, E., Ray, T. P., and Chrysostomou, A.: 2003, A&A 397, 693
- Donati et al. (1997) Donati, J.-F., Semel, M., Carter, B. D., Rees, D. E., and Collier Cameron, A.: 1997, MNRAS 291, 658
- Dougados et al. (2000) Dougados, C., Cabrit, S., Lavalley, C., and Ménard, F.: 2000, A&A 357, L61
- Edwards et al. (1987) Edwards, S., Cabrit, S., Strom, S. E., Heyer, I., Strom, K. M., and Anderson, E.: 1987, ApJ 321, 473
- Eislöffel and Mundt (1998) Eislöffel, J. and Mundt, R.: 1998, AJ 115, 1554
- Eislöffel et al. (2000) Eislöffel, J., Smith, M. D., and Davis, C. J.: 2000, A&A 359, 1147
- Fernandez et al. (1995) Fernandez, M., Ortiz, E., Eiroa, C., and Miranda, L. F.: 1995, A&AS 114, 439
- Folha and Emerson (2001) Folha, D. F. M. and Emerson, J. P.: 2001, A&A 365, 90
- Gahm et al. (1999) Gahm, G. F., Petrov, P. P., Duemmler, R., Gameiro, J. F., and Lago, M. T. V. T.: 1999, A&A 352, L95
- Ghez et al. (1993) Ghez, A. M., Neugebauer, G., and Matthews, K.: 1993, AJ 106, 2005
- Giampapa et al. (1993) Giampapa, M. S., Basri, G. S., Johns, C. M., and Imhoff, C.: 1993, ApJS 89, 321
- Goodson et al. (1999) Goodson, A. P., Böhm, K., and Winglee, R. M.: 1999, ApJ 524, 142
- Güdel et al. (2008) Güdel, M., Skinner, S. L., Audard, M., Briggs, K. R., and Cabrit, S.: 2008, A&A 478, 797
- Güdel et al. (2005) Güdel, M., Skinner, S. L., Briggs, K. R., Audard, M., Arzner, K., and Telleschi, A.: 2005, ApJ 626, L53
- Günther et al. (2009) Günther, H. M., Matt, S. P., and Li, Z.-Y.: 2009, A&A 493, 579
- Haas et al. (1990) Haas, M., Leinert, C., and Zinnecker, H.: 1990, A&A 230, L1
- Hamann and Persson (1992) Hamann, F. and Persson, S. E.: 1992, ApJS 82, 247
- Hartigan et al. (1995) Hartigan, P., Edwards, S., and Ghandour, L.: 1995, ApJ 452, 736
- Hartigan and Hillenbrand (2009) Hartigan, P. and Hillenbrand, L.: 2009, ApJ 705, 1388
- Hartigan and Kenyon (2003) Hartigan, P. and Kenyon, S. J.: 2003, ApJ 583, 334
- Hartmann et al. (1986) Hartmann, L., Hewett, R., Stahler, S., and Mathieu, R. D.: 1986, ApJ 309, 275
- Hartmann and Stauffer (1989) Hartmann, L. and Stauffer, J. R.: 1989, AJ 97, 873
- Herbig (1977) Herbig, G. H.: 1977, ApJ 214, 747
- Herbig (1989) Herbig, G. H.: 1989, in B. Reipurth (ed.), European Southern Observatory Conference and Workshop Proceedings, Vol. 33 of European Southern Observatory Conference and Workshop Proceedings, pp 233–246
- Herbst et al. (1987) Herbst, W., Booth, J. F., Koret, D. L., Zajtseva, G. V., Shakhovskaya, H. I., Vrba, F. J., Covino, E., Terranegra, L., Vittone, A., Hoff, D., Kelsey, L., Lines, R., and Barksdale, W.: 1987, AJ 94, 137
- Herbst et al. (2007) Herbst, W., Eislöffel, J., Mundt, R., and Scholz, A.: 2007, Protostars and Planets V pp 297–311
- Herbst et al. (1994) Herbst, W., Herbst, D. K., Grossman, E. J., and Weinstein, D.: 1994, AJ 108, 1906
- Herbst and Stine (1984) Herbst, W. and Stine, P. C.: 1984, AJ 89, 1716
- Hioki et al. (2009) Hioki, T., Itoh, Y., Oasa, Y., Fukagawa, M., Kudo, T., Mayama, S., Pyo, T.-S., Hayashi, M., Hayashi, S. S., Ishii, M., and Tamura, M.: 2009, PASJ 61, 1271
- Hirth et al. (1994) Hirth, G. A., Mundt, R., Solf, J., and Ray, T. P.: 1994, ApJ 427, L99
- Johns and Basri (1995a) Johns, C. M. and Basri, G.: 1995a, AJ 109, 2800
- Johns and Basri (1995b) Johns, C. M. and Basri, G.: 1995b, ApJ 449, 341
- Johns-Krull and Hatzes (1997) Johns-Krull, C. M. and Hatzes, A. P.: 1997, ApJ 487, 896
- Joy (1945) Joy, A. H.: 1945, ApJ 102, 168
- Kepner et al. (1993) Kepner, J., Hartigan, P., Yang, C., and Strom, S.: 1993, ApJ 415, L119
- Königl and Pudritz (2000) Königl, A. and Pudritz, R. E.: 2000, Protostars and Planets IV pp 759–+
- Krist et al. (1997) Krist, J. E., Burrows, C. J., Stapelfeldt, K. R., Ballester, G. E., Clarke, J. T., Crisp, D., Evans, R. W., Gallagher, III, J. S., Griffiths, R. E., Hester, J. J., Holtzman, J. A., Hoessel, J. G., Mould, J. R., Scowen, P. A., Trauger, J. T., Watson, A. M., and Westphal, J. A.: 1997, ApJ 481, 447
- Krist et al. (1999) Krist, J. E., Stapelfeldt, K. R., Burrows, C. J., Hester, J. J., Watson, A. M., Ballester, G. E., Clarke, J. T., Crisp, D., Evans, R. W., Gallagher, III, J. S., Griffiths, R. E., Hoessel, J. G., Holtzman, J. A., Mould, J. R., Scowen, P. A., and Trauger, J. T.: 1999, ApJ 515, L35
- Krist et al. (2008) Krist, J. E., Stapelfeldt, K. R., Hester, J. J., Healy, K., Dwyer, S. J., and Gardner, C. L.: 2008, AJ 136, 1980
- Kurosawa et al. (2006) Kurosawa, R., Harries, T. J., and Symington, N. H.: 2006, MNRAS 370, 580
- Lavalley et al. (1997) Lavalley, C., Cabrit, S., Dougados, C., Ferruit, P., and Bacon, R.: 1997, A&A 327, 671
- Lavalley-Fouquet et al. (2000) Lavalley-Fouquet, C., Cabrit, S., and Dougados, C.: 2000, A&A 356, L41
- Leinert et al. (1991) Leinert, C., Haas, M., Mundt, R., Richichi, A., and Zinnecker, H.: 1991, A&A 250, 407
- Leinert et al. (1993) Leinert, C., Zinnecker, H., Weitzel, N., Christou, J., Ridgway, S. T., Jameson, R., Haas, M., and Lenzen, R.: 1993, A&A 278, 129
- Liu and Shang (2012) Liu, C.-F. and Shang, H.: 2012, ApJ
- López-Martín et al. (2003) López-Martín, L., Cabrit, S., and Dougados, C.: 2003, A&A 405, L1
- Massaglia et al. (2005) Massaglia, S., Mignone, A., and Bodo, G.: 2005, A&A 442, 549
- Melnikov et al. (2009) Melnikov, S. Y., Eislöffel, J., Bacciotti, F., Woitas, J., and Ray, T. P.: 2009, A&A 506, 763
- Mendigutía et al. (2011) Mendigutía, I., Eiroa, C., Montesinos, B., Mora, A., Oudmaijer, R. D., Merín, B., and Meeus, G.: 2011, A&A 529, A34
- Mundt (1984) Mundt, R.: 1984, ApJ 280, 749
- Mundt et al. (1987) Mundt, R., Brugel, E. W., and Buehrke, T.: 1987, ApJ 319, 275
- Mundt and Eislöffel (1998) Mundt, R. and Eislöffel, J.: 1998, AJ 116, 860
- Mundt and Fried (1983) Mundt, R. and Fried, J. W.: 1983, ApJ 274, L83
- Mundt and Giampapa (1982) Mundt, R. and Giampapa, M. S.: 1982, ApJ 256, 156
- Muzerolle et al. (2001) Muzerolle, J., Calvet, N., and Hartmann, L.: 2001, ApJ 550, 944
- Muzerolle et al. (1998) Muzerolle, J., Hartmann, L., and Calvet, N.: 1998, AJ 116, 455
- Najita et al. (2000) Najita, J. R., Edwards, S., Basri, G., and Carr, J.: 2000, Protostars and Planets IV p. 457
- Oliveira et al. (2000) Oliveira, J. M., Foing, B. H., van Loon, J. T., and Unruh, Y. C.: 2000, A&A 362, 615
- Pesenti et al. (2004) Pesenti, N., Dougados, C., Cabrit, S., Ferreira, J., Casse, F., Garcia, P., and O’Brien, D.: 2004, A&A 416, L9
- Petrov (1990) Petrov, P. P.: 1990, Ap&SS 169, 61
- Petrov et al. (2001a) Petrov, P. P., Gahm, G. F., Gameiro, J. F., Duemmler, R., Ilyin, I. V., Laakkonen, T., Lago, M. T. V. T., and Tuominen, I.: 2001a, A&A 369, 993
- Petrov et al. (1996) Petrov, P. P., Gullbring, E., Ilyin, I., Gahm, G. F., Tuominen, I., Hackman, T., and Loden, K.: 1996, A&A 314, 821
- Petrov and Kozack (2007) Petrov, P. P. and Kozack, B. S.: 2007, Astronomy Reports 51, 500
- Petrov et al. (2001b) Petrov, P. P., Pelt, J., and Tuominen, I.: 2001b, A&A 375, 977
- Petrov et al. (1999) Petrov, P. P., Zajtseva, G. V., Efimov, Y. S., Duemmler, R., Ilyin, I. V., Tuominen, I., and Shcherbakov, V. A.: 1999, A&A 341, 553
- Pyo et al. (2006) Pyo, T.-S., Hayashi, M., Kobayashi, N., Tokunaga, A. T., Terada, H., Takami, H., Takato, N., Davis, C. J., Takami, M., Hayashi, S. S., Gässler, W., Oya, S., Hayano, Y., Kamata, Y., Minowa, Y., Iye, M., Usuda, T., Nishikawa, T., and Nedachi, K.: 2006, ApJ 649, 836
- Pyo et al. (2003) Pyo, T.-S., Kobayashi, N., Hayashi, M., Terada, H., Goto, M., Takami, H., Takato, N., Gaessler, W., Usuda, T., Yamashita, T., Tokunaga, A. T., Hayano, Y., Kamata, Y., Iye, M., and Minowa, Y.: 2003, ApJ 590, 340
- Raga et al. (2001) Raga, A., Cabrit, S., Dougados, C., and Lavalley, C.: 2001, A&A 367, 959
- Rodríguez et al. (2012) Rodríguez, L. F., González, R. F., Raga, A. C., Cantó, J., Riera, A., Loinard, L., Dzib, S. A., and Zapata, L. A.: 2012, A&A 537, A123
- Shu et al. (2000) Shu, F. H., Najita, J. R., Shang, H., and Li, Z.: 2000, Protostars and Planets IV pp 789–+
- Simon et al. (1992) Simon, M., Chen, W. P., Howell, R. R., Benson, J. A., and Slowik, D.: 1992, ApJ 384, 212
- Solf and Böhm (1993) Solf, J. and Böhm, K. H.: 1993, ApJ 410, L31
- St-Onge and Bastien (2008) St-Onge, G. and Bastien, P.: 2008, ApJ 674, 1032
- Takami et al. (2003) Takami, M., Bailey, J., and Chrysostomou, A.: 2003, A&A 397, 675
- Takami et al. (2001) Takami, M., Bailey, J., Gledhill, T. M., Chrysostomou, A., and Hough, J. H.: 2001, MNRAS 323, 177
- Takami et al. (2002) Takami, M., Chrysostomou, A., Bailey, J., Gledhill, T. M., Tamura, M., and Terada, H.: 2002, ApJ 568, L53
- White and Ghez (2001) White, R. J. and Ghez, A. M.: 2001, ApJ 556, 265
- Wichmann et al. (1998) Wichmann, R., Bastian, U., Krautter, J., Jankovics, I., and Rucinski, S. M.: 1998, MNRAS 301, L39
- Woitas et al. (2005) Woitas, J., Bacciotti, F., Ray, T. P., Marconi, A., Coffey, D., and Eislöffel, J.: 2005, A&A 432, 149
- Woitas et al. (2002) Woitas, J., Ray, T. P., Bacciotti, F., Davis, C. J., and Eislöffel, J.: 2002, ApJ 580, 336
- Zajtseva et al. (1985) Zajtseva, G. V., Kolotilov, E. A., Petrov, P. P., Tarasov, A. E., Shenavrin, V. I., and Shcherbakov, A. G.: 1985, Pis ma Astronomicheskii Zhurnal 11, 271
| Star | Magnitude | ||
|---|---|---|---|
| HD 283642 | 10.60 | 10.06 | 9.52 |
| HD 42784 | 6.53 | 6.60 | 6.64 |
| Object | Year of | Line(s) | Spectral resolution | Reference | Study of time | Equivalent width | Note |
|---|---|---|---|---|---|---|---|
| observations | variability | in H (Å) | |||||
| DG Tau | 1981 | H, Na D | 2.5 | Mundt (1984) | 110 | ||
| 1987 | Ca II 8498/8542 Å, O I 7772/8446 Å | 1.4 | Hamann and Persson (1992) | ||||
| 1988–1992 | H, He I 5876/6678 Å | 2.5 | Beristain et al. (2001) | Y | a | ||
| 1996 | H, Pa 11, Ca II 8542 Å, He I 5876 Å, O I 7772/8446 Å, Na D | 3.5 | Muzerolle et al. (1998) | 46.2 | |||
| RY Tau | 1980 | H | 0.2–0.3 | Mundt and Giampapa (1982) | |||
| 1984 | H | 0.2–0.3 | Zajtseva et al. (1985) | Y | 8.5–20 | b | |
| 1984 | H | 2.5 | Edwards et al. (1987) | ||||
| 1987 | Ca II 8498/8542 Å, O I 7772/8446 Å | 1.4 | Hamann and Persson (1992) | ||||
| 1987–1988 | H, He I 5876 Å, Na D | 1.6 | Petrov (1990) | Y | c | ||
| 1989–1996 | H, Ca II triplet, Na D | 2.5/4.0 | Petrov et al. (1999) | Y | 5.9–24.9 | d | |
| 1992 | H | 4.8 | Johns and Basri (1995a) | Y | e | ||
| 1998–1999 | H, He I 5876 Å, Na D | 0.55 | Mendigutía et al. (2011) | Y | 15.30.2 | f | |
| XZ Tau | 1983, 1987 | H, Ca II 8498/8542 Å, O I 7772/8446 Å | 0.35/1.4 | Hamann and Persson (1992) | g | ||
| RW Aur A | 1980 | H, Na D | 2.5 | Mundt (1984) | 85 | h | |
| 1987 | Ca II 8498/8542 Å, O I 7772/8446 Å | 1.4 | Hamann and Persson (1992) | ||||
| 1988–1992 | H, He I 5876/6678 Å | 2.5 | Beristain et al. (2001) | ||||
| 1989–1990 | H | Fernandez et al. (1995) | Y | 71.3, 122.7, 94.7, 52.8 | i | ||
| 1989-1993, 1999 | H, Ca II 8498 Å, He I 5876 Å, Na D | 4.8 | Alencar et al. (2005) | Y | j | ||
| 1995–1999 | H, Pa 11, Ca II 8498 Å, He I 5876 Å, O I 7772 Å. Na D | 2.6 | Petrov et al. (2001a) | Y | k | ||
| 1996 | H, Pa 11, Ca II 8542 Å, He I 5876 Å, O I 7772/8446 Å, Na D | 3.5 | Muzerolle et al. (1998) | 50.3 |
| Object | He I | Na D | H | He I | He I | O I | O I | Ca II | Ca II | Ca II | Pa 11 | [O I] | [S II] | [Fe II] |
|---|---|---|---|---|---|---|---|---|---|---|---|---|---|---|
| UT Date | 5876 | 6563 | 6678 | 7065 | 7772 | 8446 | 8498 | 8542 | 8662 | 8862 | 6300 | 6731 | 7155 | |
| DG Tau | ||||||||||||||
| 2010 Oct 21 | 2.9 | 0.8 | 87.7 | 1.2 | 0.5 | 1.8 | 3.0 | 37.3 | 38.7 | 33.1 | 3.2 | 12.4 | 1.7 | 0.5 |
| 2010 Nov 17 | 3.2 | 1.6 | 88.4 | 1.2 | 0.7 | 1.7 | 3.0 | 47.2 | 52.3 | 46.1 | 4.1 | 10.2 | 1.5 | 0.4 |
| 2010 Nov 21 | 3.1 | 0.7 | 74.2 | 1.3 | 0.8 | 1.1 | 2.3 | 45.0 | 51.8 | 44.5 | 4.7 | 8.4 | 1.2 | 0.4 |
| 2010 Nov 25 | 3.2 | 0.4 | 87.1 | 1.2 | 0.9 | 1.2 | 2.9 | 47.6 | 50.9 | 43.7 | 3.9 | 9.4 | 1.3 | 0.4 |
| 2010 Nov 27 | 3.3 | 0.9 | 106.9 | 1.1 | 0.7 | 1.8 | 3.8 | 54.4 | 55.9 | 48.0 | 4.8 | 10.6 | 1.4 | 0.4 |
| 2010 Dec 17 | 3.0 | -0.7 | 102.2 | 1.4 | 0.5 | 2.0 | 2.9 | 35.0 | 34.8 | 30.3 | 3.1 | 14.8 | 2.1 | 0.8 |
| RY Tau | ||||||||||||||
| 2010 Oct 21 | 0.2 | -1.4 | 10.3 | -0.03 | …22These is no clearly detected emission or absorption feature. | 0.2 | 1.0 | 2.9 | 1.1 | 1.3 | -0.4 | 0.0 | …22These is no clearly detected emission or absorption feature. | …22These is no clearly detected emission or absorption feature. |
| 2010 Nov 17 | 0.2 | -0.9 | 14.9 | -0.01 | … | 0.3 | 1.4 | 5.6 | 3.7 | 3.6 | -0.3 | 0.1 | … | … |
| 2010 Nov 21 | 0.4 | -1.0 | 15.5 | -0.02 | … | 0.2 | 1.0 | 3.6 | 2.1 | 2.2 | -0.3 | 0.1 | … | … |
| 2010 Nov 25 | 0.0 | -1.4 | 14.3 | -0.07 | … | -0.4 | 0.9 | 3.1 | 1.6 | 1.7 | -0.7 | 0.0 | … | … |
| 2010 Nov 27 | -0.2 | -2.1 | 11.8 | -0.14 | … | -1.1 | 0.4 | 3.1 | 1.4 | 1.5 | -0.8 | 0.0 | … | … |
| XZ Tau | ||||||||||||||
| 2010 Oct 21 | 3.0 | 3.6 | 166.8 | …33Although we clearly detect the emission feature (Fig. 3), accurate measurements of the equivalent widths were not possible due to ambiguity of the adjacent continuum. | 0.9 | …44These are excluded from the measurement of equivalent widths as the line profiles are covered with features whose origin is presumably different. | 3.2 | 34.1 | 36.4 | 27.8 | …33Although we clearly detect the emission feature (Fig. 3), accurate measurements of the equivalent widths were not possible due to ambiguity of the adjacent continuum. | 6.3 | 1.6 | 0.7 |
| 2010 Nov 17 | 4.0 | 4.2 | 160.2 | … | 0.9 | … | 2.5 | 31.9 | 32.6 | 25.7 | … | 7.9 | 2.1 | 0.8 |
| 2010 Nov 21 | 3.0 | 5.3 | 167.4 | … | 0.9 | … | 2.5 | 32.8 | 33.6 | 26.1 | … | 10.7 | 3.0 | 0.9 |
| 2010 Nov 25 | 2.5 | 2.7 | 173.5 | … | 0.7 | … | 1.8 | 23.2 | 22.8 | 17.7 | … | 13.8 | 4.0 | 1.2 |
| 2010 Nov 27 | 2.4 | 4.6 | 170.0 | … | 0.7 | … | 1.9 | 25.4 | 26.6 | 20.5 | … | 13.2 | 4.0 | 1.1 |
| 2010 Dec 17 | 1.7 | -0.1 | 158.2 | … | 0.6 | … | 0.4 | 9.5 | 9.5 | 7.0 | … | 16.1 | 5.2 | 1.5 |
| RW Aur A | ||||||||||||||
| 2010 Nov 17 | 1.8 | -2.2 | 80.4 | 1.8 | 1.0 | -1.1 | 6.4 | 47.6 | 44.7 | 35.8 | 3.9 | 2.5 | 0.7 | 1.1 |
| 2010 Nov 21 | 1.6 | -2.8 | 65.6 | 1.3 | 0.7 | -1.2 | 5.1 | 46.8 | 46.0 | 36.6 | 3.3 | 2.8 | 0.7 | 0.7 |
| 2010 Nov 25 | 2.0 | -0.9 | 79.7 | 1.6 | 1.0 | -1.4 | 8.1 | 70.4 | 71.9 | 59.1 | 3.2 | 4.1 | 1.0 | 1.8 |
| 2010 Nov 27 | 1.7 | -0.3 | 72.9 | 1.4 | 0.8 | -1.6 | 6.9 | 70.9 | 71.7 | 58.2 | 3.3 | 6.2 | 1.6 | 2.5 |
| Object | He I | Na D | H | He I | He I | O I | O I | Ca II | Ca II | Ca II | Pa 11 | [O I] | [S II] | [Fe II] | continuum | continuum | |
|---|---|---|---|---|---|---|---|---|---|---|---|---|---|---|---|---|---|
| UT Date | 5876 | 6563 | 6678 | 7065 | 7772 | 8446 | 8498 | 8542 | 8662 | 8862 | 6300 | 6731 | 7155 | 5000 | 8000 | ||
| DG Tau | 2.222From Calvet and Gullbring (1998). | ||||||||||||||||
| 2010 Oct 21 | 3.4E-04 | 9.7E-05 | 1.0E-02 | 1.4E-04 | 5.4E-05 | 1.9E-04 | 3.4E-04 | 3.6E-03 | 3.9E-03 | 3.2E-03 | 3.1E-04 | 1.4E-03 | 1.9E-04 | 5.8E-05 | 1.3E-04 | 1.1E-04 | |
| 2010 Nov 17 | 5.0E-04 | 2.4E-04 | 1.4E-02 | 1.9E-04 | 1.2E-04 | 2.7E-04 | 4.6E-04 | 6.3E-03 | 6.9E-03 | 6.1E-03 | 5.0E-04 | 1.7E-03 | 2.3E-04 | 7.6E-05 | 1.8E-04 | 1.4E-04 | |
| 2010 Nov 21 | 6.4E-04 | 1.4E-04 | 1.5E-02 | 2.6E-04 | 1.7E-04 | 2.2E-04 | 4.6E-04 | 7.8E-03 | 8.6E-03 | 7.5E-03 | 7.0E-04 | 1.7E-03 | 2.5E-04 | 8.5E-05 | 2.5E-04 | 1.9E-04 | |
| 2010 Nov 25 | 5.8E-04 | 7.7E-05 | 1.5E-02 | 2.2E-04 | 1.4E-04 | 2.0E-04 | 4.6E-04 | 6.9E-03 | 7.2E-03 | 6.1E-03 | 5.0E-04 | 1.7E-03 | 2.3E-04 | 6.7E-05 | 2.1E-04 | 1.6E-04 | |
| 2010 Nov 27 | 5.2E-04 | 1.4E-04 | 1.6E-02 | 1.8E-04 | 1.0E-04 | 2.8E-04 | 5.5E-04 | 7.2E-03 | 7.2E-03 | 6.1E-03 | 5.8E-04 | 1.7E-03 | 2.3E-04 | 7.6E-05 | 1.7E-04 | 1.5E-04 | |
| 2010 Dec 17 | 3.8E-04 | … | 1.4E-02 | 1.9E-04 | 6.7E-05 | 2.7E-04 | 4.3E-04 | 4.5E-03 | 4.5E-03 | 3.8E-03 | 3.9E-04 | 2.0E-03 | 2.8E-04 | 1.1E-04 | 1.3E-04 | 1.4E-04 | |
| RY Tau | 2.233From Calvet et al. (2004) | ||||||||||||||||
| 2010 Oct 21 | 4.2E-04 | … | 1.6E-02 | … | … | 2.0E-04 | 1.0E-03 | 2.9E-03 | 1.1E-03 | 1.2E-03 | … | 5.3E-05 | … | … | 2.5E-03 | 1.1E-03 | |
| 2010 Nov 17 | 3.2E-04 | … | 2.1E-02 | … | … | 3.5E-04 | 1.3E-03 | 4.8E-03 | 3.0E-03 | 2.9E-03 | … | 8.4E-05 | … | … | 2.3E-03 | 9.6E-04 | |
| 2010 Nov 21 | 7.8E-04 | … | 2.4E-02 | … | … | 2.7E-04 | 1.0E-03 | 3.6E-03 | 2.1E-03 | 2.1E-03 | … | 8.9E-05 | … | … | 2.5E-03 | 1.1E-03 | |
| 2010 Nov 25 | 1.3E-04 | … | 2.0E-02 | … | … | … | 8.5E-04 | 2.6E-03 | 1.3E-03 | 1.4E-03 | … | 4.1E-05 | … | … | 2.3E-03 | 9.9E-04 | |
| 2010 Nov 27 | … | … | 1.6E-02 | … | … | … | 3.4E-04 | 2.7E-03 | 1.2E-03 | 1.3E-03 | … | … | … | … | 2.3E-03 | 9.9E-04 | |
| XZ Tau | 1.4044From Hartigan and Kenyon (2003) | ||||||||||||||||
| 2010 Oct 21 | 1.0E-04 | 1.1E-04 | 7.1E-03 | … | 3.6E-05 | … | 2.2E-04 | 2.2E-03 | 2.4E-03 | 2.0E-03 | … | 3.0E-04 | 8.5E-05 | 2.6E-05 | 3.3E-05 | 6.8E-05 | |
| 2010 Nov 17 | 1.1E-04 | 1.0E-04 | 6.2E-03 | … | 3.6E-05 | … | 1.7E-04 | 2.0E-03 | 2.0E-03 | 1.8E-03 | … | 3.4E-04 | 1.1E-04 | 2.6E-05 | 2.7E-05 | 6.6E-05 | |
| 2010 Nov 21 | 5.6E-05 | 8.8E-05 | 4.8E-03 | … | 2.6E-05 | … | 1.5E-04 | 1.8E-03 | 1.8E-03 | 1.6E-03 | … | 3.4E-04 | 1.1E-04 | 2.5E-05 | 1.7E-05 | 5.5E-05 | |
| 2010 Nov 25 | 3.6E-05 | 3.3E-05 | 3.7E-03 | … | 1.7E-05 | … | 8.5E-05 | 1.0E-03 | 9.8E-04 | 8.7E-04 | … | 3.1E-04 | 1.1E-04 | 2.4E-05 | 1.2E-05 | 4.4E-05 | |
| 2010 Nov 27 | 3.6E-05 | 6.2E-05 | 4.0E-03 | … | 1.7E-05 | … | 9.8E-05 | 1.2E-03 | 1.2E-03 | 1.1E-03 | … | 3.3E-04 | 1.2E-04 | 2.6E-05 | 1.4E-05 | 4.6E-05 | |
| 2010 Dec 17 | 2.5E-05 | … | 3.4E-03 | … | 1.3E-05 | … | 1.7E-05 | 4.2E-04 | 4.2E-04 | 3.5E-04 | … | 3.6E-04 | 1.4E-04 | 2.6E-05 | 1.2E-05 | 4.6E-05 | |
| RW Aur A | 0.3955From White and Ghez (2001) | ||||||||||||||||
| 2010 Nov 17 | 3.8E-05 | … | 1.6E-03 | 3.5E-05 | 1.8E-05 | … | 1.1E-04 | 8.1E-04 | 7.4E-04 | 6.0E-04 | 5.4E-05 | 6.1E-05 | 1.6E-05 | 2.2E-05 | 2.7E-05 | 1.9E-05 | |
| 2010 Nov 21 | 7.4E-05 | … | 3.1E-03 | 6.0E-05 | 3.3E-05 | … | 2.1E-04 | 2.1E-03 | 1.9E-03 | 1.6E-03 | 1.2E-04 | 1.5E-04 | 3.4E-05 | 3.0E-05 | 6.0E-05 | 4.4E-05 | |
| 2010 Nov 25 | 5.9E-05 | … | 2.3E-03 | 4.4E-05 | 2.6E-05 | … | 1.8E-04 | 1.7E-03 | 1.7E-03 | 1.3E-03 | 6.2E-05 | 1.4E-04 | 2.8E-05 | 5.1E-05 | 3.9E-05 | 2.5E-05 | |
| 2010 Nov 27 | 4.0E-05 | … | 1.9E-03 | 3.1E-05 | 1.7E-05 | … | 1.3E-04 | 1.3E-03 | 1.3E-03 | 1.1E-03 | 5.2E-05 | 1.6E-04 | 3.9E-05 | 5.7E-05 | 3.3E-05 | 2.1E-05 |