Current address: ]Department of Physics and Astronomy, Stony Brook University, Stony Brook, NY USA
Current address: ]Department of Physics, University of California, Santa Barbara, CA 93106 USA
Current address: ]Department of Physics, University of Illinois Urbana-Champaign, Urbana, IL 61801 USA
Nodal Gap Structure and Order Parameter Symmetry of the Unconventional Superconductor UPt3
Abstract
Spanning a broad range of physical systems, complex symmetry breaking is widely recognized as a hallmark of competing interactions. This is exemplified in superfluid 3He which has multiple thermodynamic phases with spin and orbital quantum numbers and , that emerge on cooling from a nearly ferromagnetic Fermi liquid. The heavy fermion compound UPt3 exhibits similar behavior clearly manifest in its multiple superconducting phases. However, consensus as to its order parameter symmetry has remained elusive. Our small angle neutron scattering measurements indicate a linear temperature dependence of the London penetration depth characteristic of nodal structure of the order parameter. Our theoretical analysis is consistent with assignment of its symmetry to an odd parity state for which one of the three thermodynamic phases in non-zero magnetic field is chiral.
1. Introduction
Recent interest in topological superconductors has focused attention on materials that exhibit chiral symmetry, or have been proposed to exhibit chiral symmetry, including Sr2RuO4, 3He, and UPt3 Sauls_NJP_2009 . In particular, the heavy fermion compound UPt3 Stewart_PRL_1984 ; Joynt_RevModPhys_2002 has attracted theoretical attention Graf_PRB_2000 ; Norman_chapter_2013 ; Tsutsumi_JPSJ_2012 in part as a consequence of conflicting experimental reports on the nature of its unconventional superconducting state. For example, the observation of Pauli limiting in the upper critical field Shivaram_PRL_1986 appears to be incompatible with temperature independence of the Knight shift Tou_PRL_1996 ; Tou_PRL_1998 . Josephson tunneling interference measurements Strand_PRL_2009 and measurements of the polar Kerr effect Schemm_Science_2014 provide evidence for an order parameter that is chiral in the B-phase. However, recent directional thermal conductivity experiments are interpreted otherwise Tsutsumi_JPSJ_2012 . Here we use small angle neutron scattering (SANS) from the vortex lattice (VL) to provide a bulk probe of the temperature dependence of the penetration depth, obtaining evidence for the nodal structure of the order parameter in the B-phase supporting its identification as an odd parity, chiral state, with E2u symmetry consistent with theory Sauls_AdvPhys_1994 .
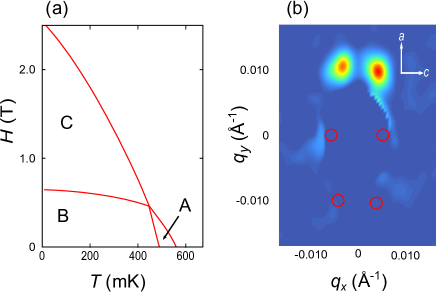
One of the most striking properties of UPt3 is the fact that the superconducting phase diagram has three distinct superconducting vortex phases shown in Fig. 1a, conventionally labeled A, B, and C. Experiments and theory demonstrate that this phase diagram can only be explained by an unconventional superconducting order parameter Joynt_RevModPhys_2002 , a close parallel to superfluid 3He. However, a complete theoretical description of the superconducting state of UPt3 has not been settled, and there are several candidate models that can account for the material’s unusual physical properties. The order parameter structure that is consistent with a number of experiments is an odd-parity, -wave (L=3) orbital state of E2u symmetry Sauls_AdvPhys_1994 ; Graf_PRB_2000 . However, with some success, comparisons with experiment have also been made for an even-parity, -wave (L=2) orbital state of E1g symmetry Park_PRB_1996 . Both of these order parameters are chiral and break time reversal symmetry in the low temperature B-phase in contrast to a recent proposal Tsutsumi_JPSJ_2012 for an odd-parity, -wave (L=3) model with E1u orbital symmetry which is non-chiral and time reversal symmetric in the B-phase.
All of these order parameters have nodes in the superconducting energy gap, each with different nodal structure in the three vortex phases. Consequently, it is of particular importance to explore physical properties that are directly linked to this nodal structure and that are sensitive to the gap dispersion at the nodes. Using SANS from the VL, we have measured the temperature dependence of the components of the London penetration depth, i(T), that probe the gap nodal structure along the principal directions of the crystal Prozorov_SST_2006 ; Furukawa_PRB_2011 finding linear behavior in the low temperature limit.
Our calculations using the quasiclassical
Green’s function approach and an ellipsoidal Fermi surface are consistent with the i(T) data over a wide range of temperature for an order parameter with E2u symmetry. We compare our results for i(T) with those from other experimental methods including ac-susceptibility GrossAlltag_ZPB_1991 ; Signore_PRB_1995 and muon spin rotation (SR) Broholm_PRL_1990 ; Yaouanc_JPCM_1998 .
2. Experimental Methods
Our sample consists of a high-quality, 15 g single crystal (RRR ), cut into two pieces, and is described by Gannon et al. Gannon_PRB_2012 . The UPt3 crystals were co-aligned, fixed with silver epoxy to a copper cold finger, and mounted to the mixing chamber of a dilution refrigerator with the crystal -axis vertical and the and -axes in the horizontal plane. Rotation of the dilution insert allowed easy reorientation of the or -axes to be parallel to the magnetic field and neutron beam inside a horizontal superconducting magnet on the SANS-I and SANS-II beamlines at the Paul Scherrer Institut in Villigen, Switzerland. For measurements on SANS-I, the neutron wavelength was 6 Å with 11 m of collimation and detector to sample distance between 16 and 20 m. For measurements on SANS-II, 9 Å neutrons were used with 6 m of collimation and the detector to sample distance was 6 m.
3. Results
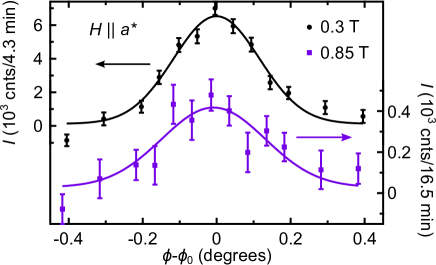
A typical result of a SANS diffraction pattern from UPt3, is shown in Fig. 1b with magnetic field T parallel to the -axis. In the present work we have made measurements of many similar patterns as a function of temperature and magnetic field, Fig. 2. Only the first order Bragg reflections were observed as in Fig. 1b, since UPt3 has relatively long penetration depths. The diffraction patterns were constructed from a superposition of scattering images measured at different rocking angles about the horizontal, Fig. 3, where the Bragg condition was satisfied above the beam center. For all data discussed here background scattering measured in zero applied field was subtracted. The diffraction pattern shown in Fig. 1b is that of a distorted hexagonal vortex lattice (VL), similar to, but more anisotropic than, previous SANS measurements in this orientation Kleiman_PRL_1992 ; Yaron_PRL_1997 . By symmetry, there are four additional peaks indicated by red circles that were not imaged in the hexagonal domain in Fig. 1b, but they were directly observed at higher fields. The symmetry of the diffraction pattern is the same as that of the real space VL, rotated by 90 degrees with a rescaling of the axes. The distortion of the VL from a perfect hexagon is a result of penetration depth anisotropy in the plane perpendicular to When a 0.2 T field is applied parallel to the -axis, a perfect hexagonal VL is seen within our resolution, in agreement with previous measurements for that orientation at a similar field Huxley_Nature_2000 .
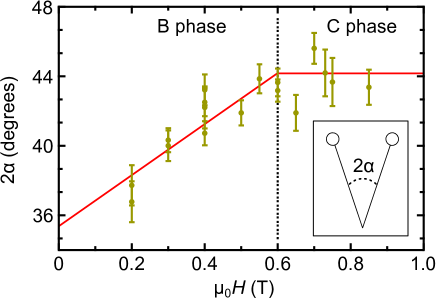
Fig. 2 shows the opening angle 2 of the VL, defined in the inset, as a function of applied magnetic field for . For the data shown here the VL was prepared by reducing the magnetic field at constant temperature mK from above the upper critical field, . Then, a damped oscillation with initial magnitude 0.02 T was performed around the final measurement field. The motivation for preparing the VL with this field history was to produce the superconducting state with an equilibrium order parameter orientation and to ensure that the VL was in the ground state Huxley_Nature_2000 ; Das_PRL_2012 .
Our data can be best described as having a linear field dependence in the B-phase that becomes field independent in the C-phase, where the B to C-transition occurs between T in this field orientation, inferred from the phase diagram of Adenwalla et al. Adenwalla_PRL_1990 . The field dependence to the opening angle indicates that non-local corrections to the London theory are signifyicant Sauls_AdvPhys_1994 ; White_PRB_2011 ; Sauls_comm_2013 . A change in the field dependence of the opening angle at the B to C-transition was also reported by Yaron et al. Yaron_PRL_1997 .
The intensity in a diffraction peak is related to the Fourier transform of the local field variations from the real space VL. Systematic measurements as a function of rocking angle were made to produce rocking curves such as displayed in Fig. 3. We measured the first order Fourier component of the diffraction, called the form factor , expressed as,
| (1) |
The form factor is calculated from the reflectivity, , equal to the integrated intensity of a rocking curve multiplied by cos (the Lorentz factor), divided by the incident neutron flux. In Eq. 1, xTÅ2 is the magnetic flux quantum; is the magnitude of the scattering vector of the reflection being measured; the gyromagnetic ratio of the neutron is ; is the incident neutron wavelength; and is the effective sample thickness which we have taken to be 3.9 mm – the equivalent thickness of a uniform sample with the same width, height, and volume as our sample. The field dependence of our measurements of rocking curve widths do not show the sudden broadening at the B-C phase transition reported by Yaron et al. Yaron_PRL_1997 . All of our rocking curves are only % broader than the resolution limit for our experiments. We also do not see a change in slope of the field dependence of at the B-C transition as reported earlier Yaron_PRL_1997 . It is likely that absence of these effects can be attributed to the higher quality of our crystal and the oscillatory field procedure which we have used to overcome flux pinning.
In the London theory the form factor is related to the material properties through the magnetic penetration depth . The form factor for an isotropic superconductor is given by,
| (2) |
where is the superconducting coherence length and c is a constant, typically taken to be . The fractional part of Eq. 2 comes directly from the London equations Kogan_PLA_1981 . The exponential factor is a correction to the London theory to account for the non-zero extent of the vortex cores Yaouanc_PRB_1997 ; Densmore_PRB_2009 . This simple gaussian model for the core correction with the constant has been found to be more accurate than more sophisticated models Densmore_PRB_2009 . Nonetheless, the temperature dependence of the penetration depth is not sensitive to the choice of this correction and its exact value is immaterial to the conclusions in the present work. For an anisotropic superconductor the form factor can be expressed in terms of the principal values of the penetration depth i corresponding to currents flowing along each of the principal directions of the crystal, with for currents along the -axis. Measuring the form factor therefore provides a direction-specific probe of the low lying excitations in the superconducting state sensitive to gap nodes Prozorov_SST_2006 .
For uniaxial anisotropy, as for UPt3, and the form factor for fields along the or -axis becomes Kogan_PLA_1981 ,
| (3) |
where the i are related to the corresponding diagonal components of the quasi-particle mass tensor mi, and the opening angle , through the relation,
| (4) |
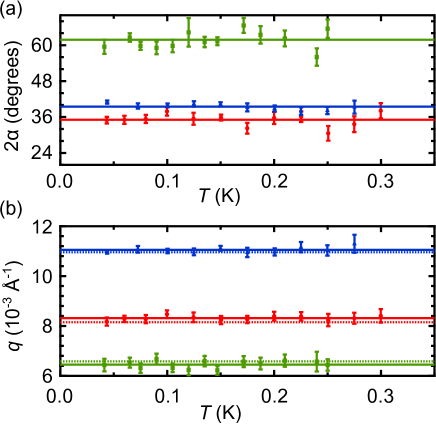
If there is no variation in the VL geometry as a function of temperature, as demonstrated in Fig. 5, then the temperature dependence of the form factor given by Eq. 3 reflects the temperature dependence of 3 where the denominator of Eq. 3 simplifies to .
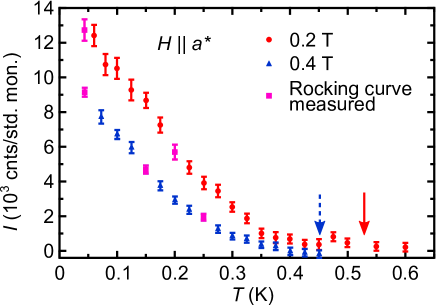
We have made measurements of the temperature dependence of the VL scattering for magnetic fields along both the crystal and -axes with the field reduced from above , followed by damped field oscillations before measurement at each temperature. Rocking curves were obtained for each orientation at base temperature and at intermediate temperatures to determine that there was no broadening as temperature was varied. The magnet and sample were rotated to the center of the rocking curve and the scattered intensity was measured “rocked-on” () as a function of temperature, Fig. 4.
The opening angle and the scattering vector, taken directly from the diffraction pattern, are both temperature independent as shown in Fig. 5a,b. The penetration depth anisotropy at low temperatures obtained directly from the opening angle is, at T, giving a quasiparticle mass anisotropy of . Using the average values of and , we calculated from Eq. 1 at T for each temperature and field orientation. We determined , shown in Fig. 6 from the simplified version of Eq. 3 using our values for , the average values of and for this field orientation, and =110 Å Shivaram_PRL_1986 . Since the penetration depth is isotropic in the plane perpendicular to the -axis, we used Eq. 2 and our results for with to find .
4. Penetration Depth at Low Temperature
The nodal structure of the order parameter is evident from the VL scattering cross-section in its low temperature limiting behavior where the quasiparticle thermal excitation energies are much less than . From earlier work, notably thermal conductivity and sound attenuation Joynt_RevModPhys_2002 together with the theory Sauls_AdvPhys_1994 ; Graf_PRB_2000 , this limiting low temperature region is which we conservatively take to be . We have compared linear and quadratic fits to the temperature dependence of over this temperature range shown in detail in Fig. 6b. Our data is consistent with a linear temperature dependence which provides a significantly better description than quadratic behavior as indicated by our chi-squared analyses for the fits shown in this figure.
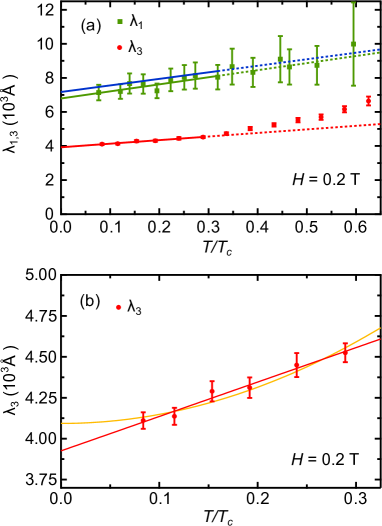
For , , the accuracy of the data is less than for since the corresponding penetration depth is larger and the spatial variations of the local magnetic field from which the neutrons are scattered are much smaller. However, we have independent information from the diffraction pattern resident in our measurement of the opening angle . Within the context of the London theory we can determine from Eq. 4.
We plot this determination of in Fig. 6a as a blue line, which is also linear in temperature just as is . Our extrapolations to zero temperature with linear fits to the data give:
Å and Å.
5. Theoretical Analysis
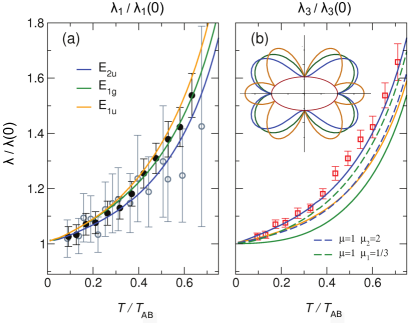
To interpret our data in terms of the pairing symmetry of UPt3, we provide a brief discussion of the nodal structures of the superconducting gap. Gap profiles in the B-phase for various candidate models for the symmetry of the order parameter are shown on an ellipsoidal Fermi surface in the inset to Fig. 7b. In the low field and low temperature B-phase, where all of the data shown in Fig. 6 were measured, the three predominate pairing models discussed earlier have three different nodal structures. For the E2u model Sauls_AdvPhys_1994 , there are point nodes at the poles of the Fermi surface which open with quadratic wave-vector dispersion, and a line node around the equator of the Fermi surface that opens with linear dispersion. The E1g model Park_PRB_1996 also has point nodes at the poles, however these nodes open linearly. Similar to E2u, the E1g model also has a line node around the equator that opens linearly. The E1u model Tsutsumi_JPSJ_2012 has a somewhat more complicated gap structure in the B-phase, with point nodes at the poles that have linear dispersion and two line nodes in planes parallel to the equator where there is an antinode. Our measurements of test the nodal structure on parts of the Fermi surface having a significant basal plane component of the Fermi velocity, while measurements of are sensitive to the nodes where the Fermi velocity has a large -axis component.
For a polar point node with quadratic dispersion, a linear temperature dependence of is expected in the low temperature limit, while for a point node with linear dispersion, there would be a temperature dependence. Extending analysis to a wider range of temperature and interpretation of our results in terms of order parameter symmetry requires a theoretical calculation including the effects of thermal excitations of quasiparticles averaged over the whole Fermi surface.
We performed calculations of the penetration depth within the framework of the quasiclassical theory SR ; xu95 , and compared three models for the symmetry of the order parameter E2u, E1g, and E1u in Fig. 7a,b. The calculations of superfluid density and penetration depth were performed for an ellipsoidal Fermi surface , with mass anisotropy to account for the observed anisotropy of the penetration depth , and the normal state transport, Lussier_PRL_1994 . The choice for the form of the order parameter is less obvious, and there are several approaches to model the gap structure using standard functions, such as spherical functions, or Allen Fermi surface harmonics NormanHirschfeld . We made the more natural choice of ellipsoidal harmonics since they are orthogonal on an ellipsoidal Fermi surface, and transform into spherical harmonics with proper rescaling of the Fermi surface. Substituting we write the gap profiles for the three models,
| (5) |
displayed in the inset to Fig. 7b. We used a single-component model for the order parameter, valid deep inside the B-phase and followed the approach from previous work NormanHirschfeld , normalizing the temperature to the lower critical temperature .
For this choice of gap functions, and treating as the only adjustable quantity, the theory with order parameter symmetry closely replicates the observed over a wide range of temperature. The best fit is shown in Fig. 7b by a solid blue line, whereas the and models with ellipsoidal harmonics provide considerably worse fits. The model is also consistent with the data for (solid circles) in Fig. 7a.
It was pointed out that ‘pure’ ellipsoidal or spherical harmonics might not necessarily reflect the correct low-energy structure of the excitations, and do not replicate the observed anisotropy of the heat transport, Graf_JLTP_1996 . A set of gap functions was suggested that are parametrized near line and point nodes with variable slope coefficients for angles with respect to the -axis.
| (6) |
Eq. 5 corresponds to the opening nodal parameters: . However these authors Graf_JLTP_1996 only found a good fit for the thermal conductivity data and sound attenuation with , , Graf_JLTP_1996 ; Graf_PRB_2000 .
The latter parameter set results in dashed lines in Fig. 7b. With this ansatz the model cannot fit the data over the entire temperature range, while follows the observed data fairly well within error bars but with significantly higher value at lower temperatures, as discussed in Fig. 6b. This model is also a less likely candidate based on previous analysis of sound attenuation Graf_PRB_2000 . In summary, it is compelling that symmetry with a simple parameter set and elliptical harmonics is in excellent agreement with our measured penetration depths over a wide temperature range.
6. Discussion and Summary
Signore et al. Signore_PRB_1995 , reported a linear temperature behavior which could not be associated with any specific component of the penetration depth. Interpretation of their ac-susceptibility measurements requires an analysis of the real and imaginary parts of the electromagnetic response from which extraction of the penetration depth is not trivial and is necessarily sensitive to surface quality GrossAlltag_ZPB_1991 ; Signore_PRB_1995 . An early SR investigation by Broholm et al. Broholm_PRL_1990 found a penetration depth anisotropy much too small to be consistent with other observations of the superconducting state Kleiman_PRL_1992 ; Yaron_PRL_1997 ; Joynt_RevModPhys_2002 . In a later SR study, Yaouanc et al. Yaouanc_JPCM_1998 obtained Å and Å with 0.018 T, qualitatively consistent with what we report here.
Evidence for gap nodes has been sought from the low temperature behavior of the thermal conductivity and attenuation of sound Lussier_PRL_1994 ; Lussier_PRB_1996 ; Suderow_JLTP_1997 ; Ellman_PRB_1996 ; NormanHirschfeld ; Graf_JLTP_1996 ; Graf_PRB_2000 . The earliest reports Lussier_PRL_1994 , provided evidence for both a polar gap node along the -axis and a line node in the basal plane. However, a conclusion in terms of a specific order parameter symmetry from nodal gap quasiparticle excitations was not possible Graf_JLTP_1996 ; NormanHirschfeld . At high temperatures in the A-phase, measurements of transverse sound attenuation Ellman_PRB_1996 , vortex lattice structure Huxley_Nature_2000 , and directional tunneling Strand_Science_2010 are consistent with E2u symmetry. In contrast, a recent report of the directional dependence of the thermal conductivity in the B-phase was argued to support a E1u state Tsutsumi_JPSJ_2012 . This theory requires weak spin-orbit coupling in order to maintain consistency with spin susceptibility measurements from the Knight shift. The latter is in conflict with observations of Pauli limiting anisotropy evidenced in the upper critical field Shivaram_PRL_1986 and it is in conflict with most other theoretical work Graf_PRB_2000 ; Joynt_RevModPhys_2002 . Our approach has been to use SANS to measure the vortex structure from which we have determined the penetration depth. These measurements are not compromised by imperfections at the sample surface since they are an average over the whole superconducting crystal and they provide absolute values for the penetration depth. The interpretation of transport measurements makes an assumption for the existence of a single order parameter domain that is not required for our measurements of the penetration depth from which we infer that superconductivity in UPt3 is an odd parity state with E2u symmetry and that consequently, the B-phase is chiral.
Acknowledgments
Research support was provided by the U.S. Department of Energy, Office of Basic Energy Sciences, Division of Materials Sciences and Engineering under Awards DE-FG02- 10ER46783 (University of Notre Dame and Northwestern University; neutron scattering) and DE-FG02-05ER46248 (Northwestern University; crystal growth and characterization). KJS acknowledges support from the Notre Dame Glynn Family Honors program, and JH from the Notre Dame physics REU program. ABV acknowledges support by the National Science Foundation through grant DMR-0954342. This work is based on experiments performed at the Swiss spallation neutron source SINQ, Paul Scherrer Institute, Villigen, Switzerland. We thank Jim Sauls for his continuing advice and theoretical support throughout the course of the project and Chris Steiner for his contributions. We are grateful to PSI for their hospitality and support during this work and we thank M. Zolliker, C. A. Collett, A. Zimmerman, J. I. A. Li and J. Pollanen for their assistance.
References
References
- (1) Sauls J A and Eschrig M 2009 New Journal of Physics 11 075008
- (2) Stewart G R, Fisk Z, Willis J O and Smith J L 1984 Physical Review Letters 52 679
- (3) Joynt R and Taillefer L 2002 Reviews of Modern Physics 74 235
- (4) Graf M J, Yip S K and Sauls J A 2000 Physical Review B 62 14393
- (5) Norman M R 2013 Unconventional superconductivity Novel Superfluids, Volume 2 International Series of Monographs on Physics ed Bennemann K H and Ketterson J B (Oxford, United Kingdom: Oxford University Press) chap 12
- (6) Tsutsumi Y, Machida K, Ohmi T and Ozaki M 2012 Journal of the Physical Society of Japan 81 074717
- (7) Shivaram B S, Rosenbaum T F and Hinks D G 1986 Physical Review Letters 57 1259
- (8) Tou H, Kitaoka Y, Asayama K, Kimura N, Onuki Y, Yamamoto E and Maezawa K 1996 Physical Review Letters 77 1374
- (9) Tou H, Kitaoka Y, Ishida K, Asayama K, Kimura N, Onuki Y, Yamamoto E, Haga Y and Maezawa K 1998 Physical Review Letters 80 3129
- (10) Strand J D, Harlingen D J V, Kycia J B and Halperin W P 2009 Physical Review Letters 103 197002
- (11) Schemm E R, Gannon W J, Wishne C M, Halperin W P and Kapitulnik A 2014 Science 345 190
- (12) Sauls J A 1994 Advances in Physics 43 113
- (13) Park K A and Joynt R 1996 Physical Review B 53 12346
- (14) Prozorov R and Giannetta R W 2006 Superconductor Science Technology 19 R41
- (15) Kawano-Furukawa H, Bowell C J, White J S, Heslop R W, Cameron A S, Forgan E M, Kihou K, Lee C H, Iyo A, Eisaki H, Saito T, Fukazawa H, Kohori Y, Cubitt R, Dewhurst C D, Gavilano J L and Zolliker M 2011 Physical Review B 84 024507
- (16) Gross-Alltag F, Chandrasekhar B S, Einzel D, Hirschfeld P J and Andres K 1991 Zeitschrift für Physik B Condensed Matter 52 243
- (17) Signore P J C, Andraka B, Meisel M W, Brown S E, Fisk Z, Giorgi A L, Smith J L, Gross-Alltag F, Schuberth E A and Menovsky A A 1995 Physical Review B 52 4446
- (18) Broholm C, Aeppli G, Kleiman R N, Harshman D R, Bishop D J, Bucher E, Williams D L, Ansaldo E J and Heffner R H 1990 Physical Review Letters 65 2062
- (19) Yaouanc A, de Réotier P D, Huxley A, Flouquet J, Bonville P, Gubbens P C M and Mulders A M 1998 Journal of Physics: Condensed Matter 10 9791
- (20) Gannon W J, Halperin W P, Rastovski C, Eskildsen M R, Dai P and Stunault A 2012 Physical Review B 86 104510
- (21) Kleiman R N, Broholm C, Aeppli G, Bucher E, Stücheli N, , Bishop D J, Clausen K N, Mortensen K, Pedersen J S and Howard B 1992 Physical Review Letters 69 3120
- (22) Yaron U, Gammel P L, Boebinger G S, Aeppli G, Schiffer P, Bucher E, Bishop D J, Broholm C and Mortensen K 1997 Physical Review Letters 78 3185
- (23) Huxley A, Rodière P, Paul D, vanDijk N, Cubitt R and Flouquet J 2000 Nature 406 160
- (24) Das P, Rastovski C, O’Brien T R, Schlesinger K J, Dewhurst C D, DeBeer-Schmitt L, Zhigadlo N D, Karpinski J and Eskildsen M R 2012 Physical Review Letters 108 167001
- (25) Adenwalla S, Lin S W, Ran Q Z, Zhao Z, Ketterson J B, Sauls J A, Taillefer L, Hinks D G, Levy M and Sarma B K 1990 Physical Review Letters 65 2298
- (26) White J S, Heslop R W, Holmes A T, Forgan E M, Hinkov V, Egetenmeyer N, Gavilano J L, Laver M, Dewhurst C D, Cubitt R and Erb A 2011 Physical Review B 84 104519
- (27) Sauls J A 2013 Private communication
- (28) Kogan V G 1981 Physics Letters A 85 298
- (29) Yaouanc A, de Réotier P D and Brandt E H 1997 Physical Review B 55 11107
- (30) Densmore J M, Das P, Rovira K, Blasius T D, DeBeer-Schmitt L, Jenkins N, Paul D M, Dewhurst C D, Bud’ko S L, Canfield P C and Eskildsen M R 2009 Physical Review B 79 174522
- (31) Serene J W and Rainer D 1983 Physics Reports 101 221
- (32) Xu D, Yip S K and Sauls J A 1995 Physical Review B 51 16233–16253
- (33) Lussier B, Ellman B and Taillefer L 1994 Physical Review Letters 73 3294–3297
- (34) Norman M and Hirschfeld P 1996 Physical Review B 53 5706
- (35) Graf M, Yip S K and Sauls J 1996 J Low Temp Phys 102 367–379
- (36) Lussier B, Ellman B and Taillefer L 1996 Physical Review B 53 5145
- (37) Suderow H, Brison J P, Huxley A and Flouquet J 1997 Journal of Low Temperature Physics 108 11
- (38) Ellman B, Taillefer L and Poirier M 1996 Physical Review B 54 9043
- (39) Strand J D, Bahr D J, Harlingen D J V, Davis J P, Gannon W J and Halperin W P 2010 Science 328 1368