High-Velocity Line Forming Regions in the Type Ia Supernova 2009ig
Abstract
We report measurements and analysis of high-velocity ( 20,000 km s-1) and photospheric absorption features in a series of spectra of the Type Ia supernova (SN) 2009ig obtained between d and d with respect to the time of maximum -band luminosity (-max). We identify lines of Si II, Si III, S II, Ca II, and Fe II that produce both high-velocity (HVF) and photospheric-velocity (PVF) absorption features. SN 2009ig is unusual for the large number of lines with detectable HVF in the spectra, but the light-curve parameters correspond to a slightly overluminous but unexceptional SN Ia ( mag and mag). Similarly, the Si II 6355 velocity at the time of -max is greater than “normal” for a SN Ia, but it is not extreme (13,400 km s-1). The d and d spectra clearly resolve HVF from Si II 6355 as separate absorptions from a detached line forming region. At these very early phases, detached HVF are prevalent in all lines. From d to d, HVF and PVF are detected simultaneously, and the two line forming regions maintain a constant separation of about 8,000 km s-1. After d all absorption features are PVF. The observations of SN 2009ig provide a complete picture of the transition from HVF to PVF. Most SN Ia show evidence for HVF from multiple lines in spectra obtained before d, and we compare the spectra of SN 2009ig to observations of other SN. We show that each of the unusual line profiles for Si II 6355 found in early-time spectra of SN Ia correlate to a specific phase in a common development sequence from HVF to PVF.
Subject headings:
supernovae: general — supernovae: individual (SN 2009ig (catalog )) — line: formation — line: identification1. Introduction
Research on Type Ia supernovae (SN Ia) has been guided for many years by the general agreement that the progenitors are carbon-oxygen (C/O) white dwarf stars (WD) as first predicted by Hoyle & Fowler (1960). This hypothesis is based on observational and theoretical evidence that thermonuclear burning of a C/O WD can produce light curves and spectra that are very similar to those observed for SN Ia. Beyond that general statement, we lack many of the details concerning the composition of the progenitors and the physics of the explosions. In order to increase the effectiveness of SN Ia as distance indicators we must improve our ability to predict the intrinsic brightness of individual events. Observations that provide new information about the chemical structure deepen our understanding of the explosion physics and may contribute constraints to theoretical models.
Here we identify, measure, and compare high-velocity ( 20,000 km s-1) and photospheric-velocity (PVF) absorption features from lines of Si II, Si III, S II, Ca II, and Fe II in a sequence of optical spectra of SN Ia 2009ig. The spectra of SN 2009ig at phases earlier than d were previously published by Foley et al. (2012). The phase of each observation is expressed in days with respect to the time of -band maximum light, -max (Sep 6.0 UT = JD 2,455,080.5; see §2.1).
High-velocity (HVF) absorption features from Ca II lines are frequently identified in spectra of SN Ia obtained a week or more before -max, but reliable identifications of HVF from other elements are rare. The presence of HVF from other lines is inferred from unusual PVF line profiles in very early-time spectra. HVF components of blended Si II 6355 features are reported by Mattila et al. (2005), Quimby et al. (2006), Stanishev et al. (2007), Garavini et al. (2007), Tanaka et al. (2008), and Wang et al. (2009a). Evidence for HVF in Fe II features is discussed by Branch et al. (2003), Branch et al. (2005), Branch et al. (2007), Hatano et al. (1999), and Mazzali, Benetti, & Altavilla (2005a).
The two earliest spectra of SN 2009ig ( d, d) clearly resolve high-velocity Si II 6355 as a separate absorption feature produced in a detached line forming region. All features identified in the earliest spectra of SN 2009ig are HVF. The first unambiguous detection of PVF occurs at d, and we measure both HVF and PVF velocities from d until HVF are no longer detectable at about d. All absorption features in spectra obtained after d are PVF. The early start and dense coverage of our sample allows us to map a complete transition from HVF to PVF in SN 2009ig.
The strongest absorption features in early-time spectra of SN Ia are the Ca II H&K lines and the Ca II near-infrared triplet (IR3). Most of the pre-maximum spectra in our SN 2009ig sample include both of these lines, presenting an opportunity to study the development of HVF and PVF in Ca II. Wang et al. (2006) and Patat et al. (2009) also reported simultaneous observations of HVF and PVF from both Ca II lines.
HVF from Ca II are usually observed as very broad features that extend 15,000–25,000 km s-1 beyond typical photospheric velocities. They are most often detected in spectra obtained earlier than d, but it is not unusual for Ca II HVF to persist as late as maximum light. Detections of high-velocity Ca II in early spectra of SN Ia are reported and discussed by Fisher et al. (1997), Hatano et al. (1999), Wang et al. (2003), Gerardy et al. (2004), Thomas et al. (2004), Branch et al. (2008), Tanaka et al. (2008), Branch, Dang, & Baron (2009), Marion et al. (2009), and others. Childress et al. (2013b) compare and discuss Ca II HVF in SN Ia observed near -max. Mazzali, Benetti, & Altavilla (2005a) assert that all spectra of SN Ia observed more than one week before maximum will exhibit high-velocity Ca II.
Foley et al. (2012) use the same pre-maximum data of SN 2009ig as we do to identify and discuss differences in line profiles of Ca II H&K, Ca II IR3, and Si II 6355. They reveal the two-component nature of early Si II 6355 features and propose that HVF may be ubiquitous in SN Ia. Here we focus on the location and composition of HVF line forming regions. In particular, we examine the characteristics of HVF from lines that are not Ca II. We directly compare the development of Si II 6355 features in the spectra of SN 2009ig to sequences of early-time spectra of five other SN Ia.
Velocity measurements show that the HVF and PVF line forming regions remain separated by about 8,000 km s-1 in SN 2009ig. The expansion of SN Ia is assumed to be homologous, so that measured velocities are proportional to distances from the center of the SN. Consequently, a line forming region that produces high-velocity absorption features is physically outside of a region that produces lower velocity features. Homologous expansion ensures that they will remain in the same relative positions.
The formation of detached HVF requires a region with a localized enhancement of abundance or density. The HVF layer must also be farther from the center of the SN than the photospheric layer. We are a long way from a consensus for how HVF line forming regions come into existence. A few of the proposed explanations for HVF are uneven density profiles in the ejecta (Mazzali, Benetti, & Altavilla, 2005a), a clumpy structure or a thick torus (Tanaka et al., 2006), and interaction between the SN ejecta and surrounding material (Gerardy et al., 2004). Evidence for polarization of the HVF in spectra of SN Ia was first presented by Wang et al. (2003) and discussed by Kasen et al. (2003). If the HVF regions are not spherically symmetric, then viewing angles will influence the observed velocities.
In §2 we describe the observations of SN 2009ig and the reduction of the data. A discussion of the methods used for identification and measurement of absorption features is presented in §3. The characteristics of HVF from specific lines are presented in §4. A discussion of PVF and their measurements appears in §5. Analysis of the composition and location of HVF line forming regions is found in §6. In §7 we compare the results for SN 2009ig to early-time spectra of other SN Ia. Possible clues to the origins of HVF regions in SN Ia are discussed in §8. Section 9 presents a summary and conclusions.
2. Observations
SN 2009ig in NGC 1015 (redshift ; NED) was discovered (Kleiser et al., 2009) by the Lick Observatory Supernova Search (LOSS; Filippenko, 2001) with the 0.76 m Katzman Automatic Imaging Telescope (KAIT) at a magnitude of 17.5 on 2009 Aug. 20.5 (UT dates are used throughout this paper). The last known nondetection was also by LOSS/KAIT on Aug. 16 to a limiting magnitude of 18.7. On Aug. 21.1 the first spectrum was obtained with the Asiago 1.82 m telescope by Navasardyan, Cappellaro, & Benetti (2009). It revealed characteristics of a SN Ia very soon after the explosion with a high expansion velocity for Si II 6355 (24,500 km s-1) and no detection of Si II 5971 or S II 5641. Because SN 2009ig was nearby and the detection was very early, we were presented with a unique opportunity to conduct extensive observations of a young SN Ia.
2.1. Photometry
Photometric data were obtained in the bands with the 0.8 m Tsinghua-NAOC Telescope (TNT), located at Xinglong Station of the National Astronomical Observatory of China, 180 km from Beijing. Details of the TNT, detectors, and observing conditions are described by Wang et al. (2008). All photometric data were reduced using standard IRAF packages.
The light curves were fit to MLCS2k2 templates (Jha, Riess, & Kirshner, 2007). The light curves and the best-fit templates are displayed in Figure 1. We adopted mag for the Milky Way extinction (Schlafly & Finkbeiner, 2007) and a time of maximum -band brightness of MJD (2009 Sep. 6.0). MLCS2k2 finds for the best-fit light-curve parameter, mag for the distance modulus (assuming H km s-1 Mpc-1), and mag for the host-galaxy extinction.
From the MLCS2k2 results we find and mag on 2009 Sep. 6.0. The parameter corresponds to a decline-rate value of mag. These values suggest that SN 2009ig is slightly more luminous and has a slower decline rate than a “normal” SN Ia, but the and values are not exceptional.
These parameters are consistent with those of Foley et al. (2012), who used KAIT and Swift photometry of SN 2009ig to derive values of mag and mag. Small differences in the photometric parameters have no effect on the spectroscopic results presented in this paper.


2.2. Spectroscopy
Our complete sample includes 32 optical spectra of SN 2009ig obtained from d to +12.5 d with respect to the time of -max. Spectra obtained before Sep. 9 (+3 d) were previously published by Foley et al. (2012). In most cases where the phase is discussed in the text, we round the value to whole days for simplicity. The Swift -grism spectra are included in this list of “optical” spectra since we only display and analyze the portion of these spectra in the range 3200–4400 Å.
Figure 2 displays spectra obtained on 25 of the 28 nights between d and +13 d. The maximum wavelength range of 3200–9000 Å reaches both the Ca II H&K lines (3945) and the Ca II IR3 (8579). Full wavelength coverage is achieved on every night from d to d.
For some of the dates, observations of SN 2009ig that cover slightly different wavelengths occurred at two different telescopes within a few hours of each other. We combine these data to create a single continuous spectrum by trimming the data from one source at a specific wavelength and continuing from that wavelength with data from the other source without overlap. The transition points are selected to optimize the signal-to-noise ratio for the combined spectrum. Spectral features in SN Ia change rapidly at early times, but a daily cadence is sufficient to trace the development of individual features. The use of a single spectrum per day makes it easier to measure and display the data. A complete list of the observational details can be found in Table 1, including the wavelengths at which the spectra were joined.
For the ground-based spectroscopy, the slit was generally oriented along the parallactic angle to minimize differential slit losses caused by atmospheric dispersion (Filippenko, 1982). SN 2009ig was observed using the Shane 3 m telescope at Lick Observatory with the Kast spectrograph (Miller & Stone, 1993) on Aug. 22, 24, 25, 27, and 28. An additional spectrum was obtained on Aug. 22 at the 10 m Keck I telescope with the Low Resolution Imaging Spectrometer (LRIS; Oke et al., 1995) equipped with an atmospheric dispersion corrector. The Lick/Kast spectra used a 600/4310 grism on the blue side and a 300/7500 grating on the red side with a wide slit. The Keck/LRIS spectrum was obtained with a 400/3400 grism on the blue side and a 600/7500 grating on the red side using a wide slit.
The 9.2 m Hobby-Eberly Telescope (HET; Ramsey et al., 1998) with the Marcario Low-Resolution Spectrograph (LRS; Hill et al., 1998) was used to observe SN 2009ig on Aug. 23 ( d). Additional HET observations were made on Aug. 29, 30, and 31, as well as on Sep. 2, 3, 4, 5, 9, 10, and 14. The HET/LRS spectra have an effective wavelength range of 4400–9200 Å. Reduction of the HET/LRS data was also conducted with standard IRAF procedures.
Low-dispersion spectra of SN 2009ig were obtained on Aug. 26, 27, 28, 29, and 30 using the 6.5 m MMT with the Blue Channel spectrograph (Schmidt, Weymann, & Foltz, 1989), covering the wavelength range 3200–8200 Å. CCD processing and spectrum extraction for these observations were completed with IRAF and the data were extracted with the optimal algorithm of Horne (1986). After the wavelength calibration was derived from low-order polynomial fits to calibration-lamp spectra, additional small adjustments were applied by cross-correlating a template sky spectrum to the night-sky lines that were extracted along with the SN. IDL routines were used to flux calibrate the data and to remove telluric lines (Wade & Horne, 1988; Matheson et al., 2000; Foley et al., 2003).
The Swift satellite observed SN 2009ig with the UV grism mode of the Ultraviolet/Optical Telescope (UVOT; Roming et al., 2005) onboard the spacecraft (Gehrels et al., 2004). Swift data were obtained on Aug. 23, 25, and 27, and on Sep. 1, 3, and 6. We do not use all of the Swift data for our analysis, but the complete sequence of Swift spectra and photometric measurements was published by Foley et al. (2012). Swift data were extracted and reduced using the “uvotimgrism” package of FTOOLS. The effective wavelength coverage is 1700–4900 Å, but in this analysis we use only a small portion of the Swift spectra covering the wavelength region 3200–4400 Å that contains the Ca II H&K feature.
3. Line Identifications and Velocity Measurements
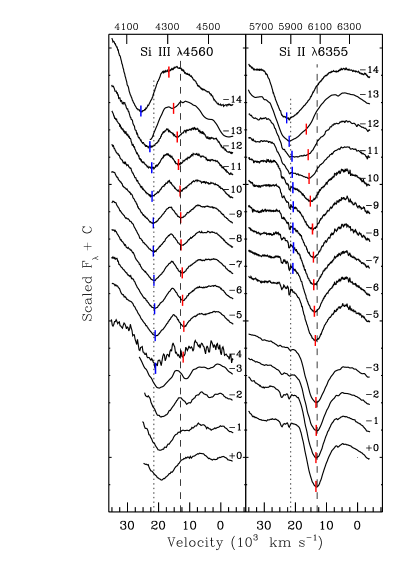
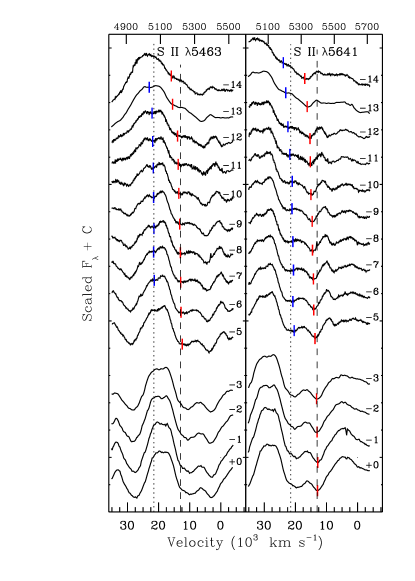
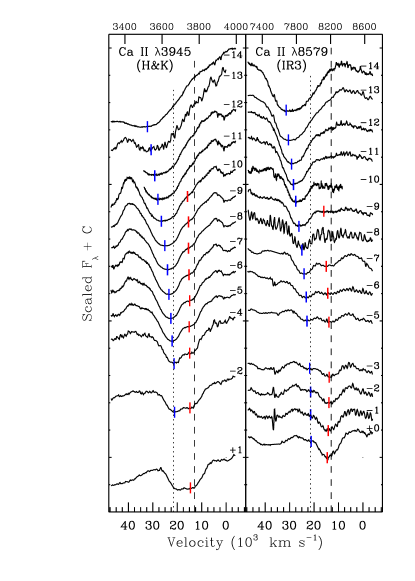
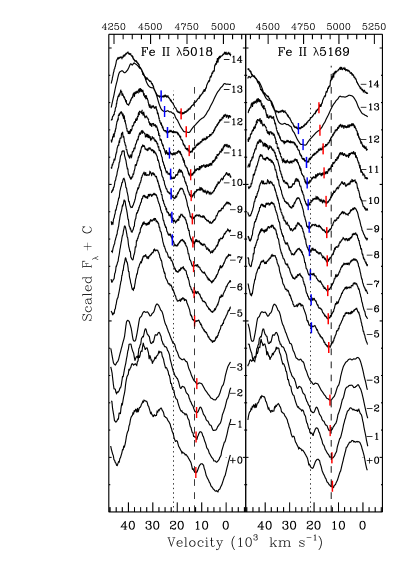
Eight lines have been identified that produce both HVF and PVF absorptions in spectra of SN 2009ig. The features associated with these lines are displayed by phase and velocity space in four figures: Si III 4560 and Si II 6355 (Figure 3), S II 5453, 5641 (Figure 4), Ca II H&K 3945 and Ca II IR3 8579 (Figure 5), and Fe II 5018, 5169 (Figure 6). The velocity measurements at each phase are indicated by a blue hashmark for HVF and a red hashmark for PVF. To facilitate comparison of the components between features, all of the figures also have a dotted line plotted at 21,500 km s-1 and a dashed line at 13,000 km s-1. These velocities were selected to be representative of the HVF at d and the PVF near -max. A detailed discussion of individual features is found in §4 (HVF) and §5 (PVF).
The HVF and PVF of Si II 6355 are easily identified and relatively free from blending. These characteristics make them useful templates that guide efforts to identify absorption features associated with other lines. We compare the velocities, the phases of initial and final detections for HVF and PVF, the relative strengths of the HVF and PVF components at a given phase, and the velocity separation between the HVF and PVF. The presence of simultaneous HVF and PVF from several lines increases the number of blended features in the early-time spectra of SN 2009ig. Velocities and line profiles of individual features are measured directly from the flux-calibrated spectra rather than a flattened continuum because the shapes and slopes of the local continua vary widely in different regions of each spectrum.
In the velocity figures, the flux is scaled to make it easier to see details of the absorption features. A representative flux ratio is maintained between the two panels in each figure in order to compare the relative strengths of features from similar lines, but it is not possible to maintain a consistent scale between the figures. The velocity range for the Ca II and Fe II plots 48,000 to 8,000 km s-1. For Si II and S II velocity plots the range is 36,000 to 8,000 km s-1. Throughout this paper we reference blueshifted velocities using positive values.
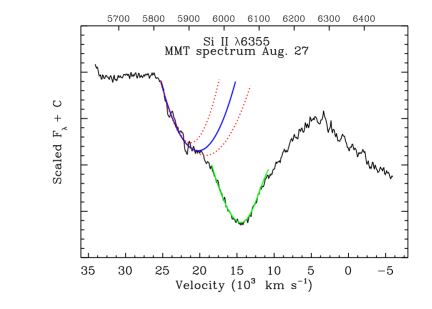
At many phases one of the components may lack a distinct minimum but still makes an obvious contribution to the overall line profile. For example, the right panel of Figure 3 shows that the PVF component from Si II 6355 at d produces only a small indentation on the red side of the larger absorption feature dominated by HV. As time passes the strength of the HVF signal diminishes and the PVF component becomes stronger. At d the PVF absorption is dominant and the HVF component forms a small but distinct indentation on the blue side of the PVF absorption feature. We use this spectrum to illustrate a method for measuring velocities from absorption components that form incomplete features.
Figure 7 shows the Si II 6355 feature from the August 27 spectrum ( d). The photospheric component is simply fit by a Gaussian (solid green line) having a minimum at 14,400 km s-1. The data in the region of the indentation created by the HVF component are fit with a Gaussian profile having a minimum at 20,700 km s-1 (solid blue line). The dotted red lines show alternative Gaussians with minima that have been shifted by 1,000 km s-1 from the minimum of the blue line. Neither of the line profiles plotted in red fit the data as well as the blue line. The optimal position for the Gaussian is determined by changing the minimum in steps of 100 km s-1 and inspecting the results by eye. It is nearly always easy to determine when the Gaussian profile deviates from the actual data by more than a few hundred km s-1. Uncertainties due to this measurement technique are 100–1,000 km s-1 depending on the quality of the data and how well the minima are defined. The measurements in Tables 2 (HVF) and 3 (PVF) were obtained by this method. Figure 3 illustrates that for Si II 6355, uncertainties will be higher for HVF measured after d and for PVF measured before d.
The SYNOW code (Branch et al., 2003) is another tool for line identification. SYNOW creates model spectra that can compare relative line strengths and positions by wavelength. SYNOW makes it possible to explore the contributions of individual ions to a complete spectrum, and it is particularly helpful for distinguishing between the relative contributions of different lines in a blended feature.
4. High-Velocity Absorption Features
( 20,000 km s-1)
In most SN Ia, Ca II produces the only detectable HVF. In SN 2009ig, eight lines from five ions produce distinct HVF in the early spectra: Si III 4560 and Si II 6355 (Figure 3), S II 5453, 5641 (Figure 4), and Fe II 5018, 5169 (Figure 6). There are also strong suggestions of HVF from several other lines that are associated with blended absorption features for which we are unable to confirm the contributions of individual lines.
HVF are clearly identified from all lines in the d spectrum of SN 2009ig, and HVF remain strong through d. The strength of the HVF absorptions weaken with time, and in most lines HVF are no longer detectable after d. Beginning at about d, many of the HVF are affected by blends with PVF that are increasing in strength.
The highest velocities for features from each line are measured in the earliest spectrum at d. For Ca II, 32,600 km s-1, followed by Fe II at 26,600 km s-1, Si III at 25,700 km s-1, S II at 23,900 km s-1, and Si II at 22,800 km s-1. This range of velocities for the HVF is apparently caused by differences in the effective opacities of the lines at that phase. By d, the HVF velocities for all lines except Ca II are grouped closely together with a mean of 22,600 km s-1. HVF velocities for all lines converge near 21,500 km s-1 by d.
4.1. HVF from Si II, Si III, and S II
The HVF of Si II 6355 provides a useful guide for the behavior of HVF in general because it is essentially unblended. The HVF component dominates the Si II profile from d to d at velocities that are about 1,000 km s-1 lower than S II and about 2,000 km s-1 lower than Fe II. Both HVF and PVF contribute to the Si II 6355 line profile between d and d, and HVF are no longer detected from Si II after d. Narrow Na I D features are visible in the spectra at about 23,500 km s-1, which is zero velocity for Na D, and at 24,200 km s-1, which is the velocity of the host galaxy, NGC 1015.
Si II has many other lines that often produce detectable features in spectra of SN Ia. Possible evidence exists for HVF components from Si II 3858, 4130, 5051, and 5972, but the features are compromised by blending.
The data do not include sufficiently short wavelengths to cover the HVF of Si III 4560 at d, but this feature is strong at d and d. Contributions from PVF Mg II 4481 and PVF Fe III 4407 begin to affect HVF Si III 4560 by d. We measure HVF Si III until d, when the absorption minimum shifts abruptly to the red, indicating that the HVF contribution has ended. SYNOW models suggest that the PVF Fe III component is stronger than PVF Mg II from d until about d.
Absorption features in the spectra can possibly be associated with several other doubly ionized lines. Possible HVF are found for Si III 5740, S III 4264, and Fe III 4407, 5129, but as for many other tentative associations, blending prevents definitive identifications.
Figure 4 shows that HVF for both S II 5453 and S II 5641 are stronger at d than they are at d. HVF velocities for S II are between the velocities of HVF Fe II and HVF Si II. The figure also shows that the S II 5641 HVF and the S II 5453 PVF form a blended feature. We identify the red component of this blend as HVF S II 5641. The HVF is strongest from d to d, contributions from both HVF and PVF are evident from d to d, and weak absorptions remain near the locations of both S II HVF as late as d. We stop measuring HVF S II 5453 after d and HVF S II 5641 after d. There is possible evidence in the spectra for HVF from S II 5032 and 5429.
HVF are not detected from carbon, oxygen, or magnesium, so there is no evidence for unburned fuel or carbon burning products in the HVF region of SN 2009ig. If the Mg II 4481 line produced a HVF at d, it would have a velocity of about 24,000 km s-1, and it would appear at about 29,000 km s-1 in the velocity space of Si III 4560 (left panel of Figure 3). At d, the Mg II HVF velocity would be about 21,500 km s-1, corresponding to 26,500 km s-1 in the figure. The spectra are steeply sloped toward the red in this region, which makes it more difficult to discern small absorptions, but careful inspection reveals no evidence of absorption features that can be associated with HVF from Mg II.
4.2. HVF from Ca II and Fe II
The velocity plots and tables show that HVF of Ca II and Fe II are wider and deeper, with absorption minima at higher velocities than the HVF of other lines. Foley et al. (2012) observed that HVF of both Ca II lines are stronger and have higher velocities than HVF of any other lines in the spectra of SN 2009ig.
The Fe II 5169 HVF produces a very strong absorption from d to d that is nearly as broad and deep as the Ca II HVF. The feature is subsequently affected by PVF Fe II 5018, PVF Si II 5051, and PVF S II 5032 beginning about d. We stop measuring HVF Fe II 5169 after the PVF blend becomes dominant at d.
HVF Fe II 5018 is the strongest part of a blend with the HVF components of S II 5032 and Si II 5051 from d to about d. This identification is confirmed by the close agreement of the measured velocities of HVF Fe II 5169 and HVF Fe II 5018. This feature loses a distinct minimum after d and we stop measuring HVF Fe II 5018 at that point. Possible evidence exists for HVF components from Fe II 4924, 5129.
Figure 5 displays the Ca II H&K blend 3935 (left) and the Ca II IR3 8579 (right). At d, the absorption minima for both Ca II blends are near 32,000 km s-1 and the features have blue wings that extend beyond 40,000 km s-1. Simultaneous observations of Ca II H&K and IR3 are of particular interest as they provide a rare opportunity to compare the evolution of these features. As shown in Figure 5 and Table 2, the measured velocities and rates of change are very similar for HVF from both of the strong Ca II blends. Although Ca II HVF velocities are about 7,000 km s-1 higher than Fe II HVF and nearly 10,000 km s-1 higher than Si II HVF at d, they have a significantly faster decline rate, and the HVF velocities for all lines converge near 21,500 km s-1 at d.
HVF from the Ca II IR3 are unblended, and they are weak but detectable until -max. That is about 5 days after the last HVF detection from other lines. The HVF component of Ca II H&K 3945 is blended with PVF Si II 3858. Side by side comparison of the Ca II H&K and IR3 line profiles suggests that the HVF from Ca II H&K are broadened by Si II PVF beginning about d and the PVF influence gets stronger with time. We find that d is the final phase at which the absorption minimum of the Ca/Si blend is consistent with the HVF of Ca II IR3, so we stop measuring Ca II H&K HVF after that phase.
Foley et al. (2013) demonstrated that there are conditions under which the absorption feature attributed to HVF Ca II H&K can be produced by a combination of Si II and a particular density profile for Ca II. Wang et al. (2006) used polarization data in a d spectrum from SN 2004dt to suggest that Si II provides the dominant contribution to this blend at d.
Childress et al. (2013b) compare the average strength of the Ca II HVF component in spectra from SN Ia at -max. They find that slowly declining SN Ia produce either high photospheric velocities or strong HVF Ca II close to -max, but not both. SN 2009ig fits this pattern with 13,400 km s-1, while the Ca II IR3 series in Figure 5 shows that HVF Ca II is very weak at -max.
5. Photospheric-Velocity Absorption Features
We use velocity offsets from PVF and their relative strengths by phase to confirm the identifications of HVF in spectra of SN 2009ig. PVF are identified for each of the same lines that produce HVF detections: Si III 4560 and Si II 6355 (Figure 3), S II 5453, 5641 (Figure 4), and Fe II 5018, 5169 (Figure 6). PVF velocity measurements are in Table 3.
There are weak suggestions of PVF for some lines in the d spectrum of SN 2009ig, but the first unambiguous detections of PVF are at d. Foley et al. (2012) note that d is the phase at which the rate of change slows down for colors. PVF become progressively stronger with time, and the PVF of most lines are stronger than the HVF by about d. At d the PVF components dominate all blended absorption features with little or no influence from the HVF.
PVF velocities in SN 2009ig decline steeply at first and then more gradually. They become essentially constant after d. This behavior is consistent with the typical pattern for PVF velocities in SN Ia (Foley, Sanders, & Kirshner, 2011; Silverman, Kong, & Filippenko, 2013). The PVF velocities of SN 2009ig are about 2,000 km s-1 greater than velocities in a “normal” SN Ia, but they are not exceptional. We measure 13,400 km s-1, which places SN 2009ig in the HV group defined by Wang et al. (2009b). Foley et al. (2012) show that 13,500 km s-1 for % of SN Ia having mag. The change in Si II 6355 velocity between +0 d and +10 d is km s-1 per day. That puts SN 2009ig in the Low Velocity Gradient group defined by Benetti et al. (2005).
5.1. Individual PVF
PVF Si II 3858 is blended with HVF Ca II H&K. The Si II contribution is significant as early as d, but it is not clear when the Si II PVF become strong enough to define the minimum in this feature. We do not take velocity measurements from this line. PVF Si II 4130 is the probable source of the absorption visible as a small notch near 4,000 Å in the P Cygni emission peak from Ca II H&K. HVF S III 4264 is a likely contributor to this feature. PVF of Si II 5051, 5972 are possibly identified.
Most of the Fe II PVF are strongly affected by blending with other PVF. PVF Fe II 5018 (left panel Figure 6) is blended with PVF Si II 5051 and PVF S II 5032. The Si II and S II lines may pull the observed minimum of this feature to the red since the PVF velocities for Fe II 5018 before -max are 1,000–1,500 km s-1 lower than PVF Fe II 5169.
The strong absorption feature near 4950 Å is formed by PVF Fe II 5169 with contributions from PVF Fe II 5266 and PVF Fe III 5129. The blend of PVF Fe II 5018, Si II 5051, and S II 5032 is observed near 4800 Å, and this feature continues to grow stronger after -max. The P Cygni emission component of this feature pushes the minimum for PVF Fe II 5169 to velocities that are about 1,000 km s-1 lower than PVF Fe II 5018 and other PVF lines after -max.
PVF S II 5453 is blended with HVF S II 5641 from d to d. We stop measuring PVF S II 5453 after d when the velocity abruptly drops from 12,400 km s-1 at d to 10,400 km s-1 at d. That is not consistent with the other PVF lines at this phase including the other S II line at 5641. The displacement of the PVF 5453 feature suggests that it is also moved to the red by P Cygni emission from the strong blend of Fe-group lines observed at 4950 Å.
PVF from lines of doubly ionized ions are weak at d and d, become significantly stronger at d, and disappear at about d. Figure 3 shows this pattern for PVF Si III 4560. Other possible but unconfirmed identifications of PVF from twice-ionized lines show similar behavior: Si III 5740, S III 4264, and Fe III 4407, 5129. The HVF components of S II lines also appear to be stronger at d than at d.
PVF Mg II 4481 is a major contributor to the very strong absorption found near 4220 Å in a blend with PVF Fe III 4407 and HVF Si III 4560. The left panel of Figure 3 shows the minimum of this feature near the dotted line at 21,500 km s-1 until d. A Mg II PVF with a velocity of 14,000 km s-1 would appear at about 19,000 km s-1 on the velocity scale of Si III 4560. SYNOW models show a better fit to the data when the PVF Fe III component is stronger than Mg II from d until about d. The SYNOW result is consistent with the abrupt shift of this feature to the red at d that aligns the minimum with characteristic PVF velocities for Mg II 4481.
The evidence for PVF from unburned C and O in SN 2009ig is inconclusive. C II 4743 makes a reasonable fit to absorption features for both HVF near 4370 Å and PVF near 4480 Å (Figure 3, wavelength axis on top). If, however, C II 4743 is the source of these features, then C II 6580 should also be easily detected. The PVF component of C II 6580 would appear near 3000 km s-1 in the velocity space of Si II 6355. Foley et al. (2012) cite work with SYNOW models (Parrent, Thomas, & Fesen, 2011) that finds C II 6580 to be present in the early-time spectra of SN 2009ig. C II is purported to cause a flattening of the red wing in the line profile of Si II 6355 from d to d. It may be that including C II improves the SYNOW fit to the line profile, but we do not find any absorption features at this location; the tiny notch at 6200 Å is telluric.
O I 7773 develops a broad PVF line beginning about d, but it is much weaker than PVF O I found in many SN Ia. The features near 7400 Å in the spectra from d to +9 d correspond to PVF of O I 7773 at 11,000–12,000 km s-1, consistent with other PVF velocities those phases.
6. The Location of HVF Line Forming Regions
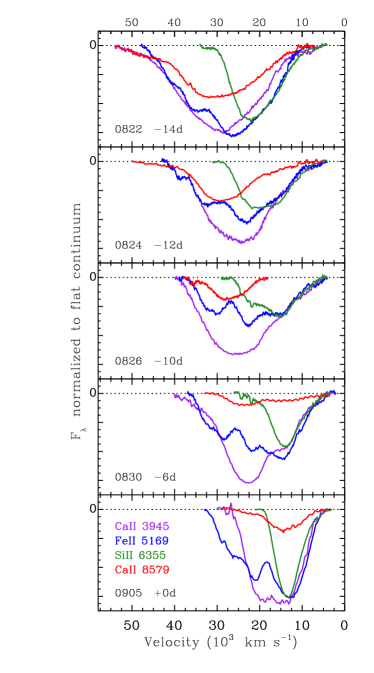
Figure 8 can be used to trace the location of the line forming regions for HVF of Ca II H&K, Ca II IR3, Fe II 5169, and Si II 6355 at phases d, d, d, d, and d (top to bottom). Velocity serves as a proxy for radial distance, with the center of the SN on the right at 0 km s-1 and the radius increasing with velocity from right to left.
The spectra are normalized to 1.0 at 6500 Å and the features are normalized to a flat continuum. The flux scale is the same in each panel. At d, all features have the same flux calibration. At later phases, all other features retain the same flux calibration, but Ca II H&K HVF is scaled down to fit in the figure.
At d, both Ca II HVF (purple and red) occupy the same velocity space, and a blue wing is present in both features that extends from 40,000 to 55,000 km s-1. The minima for the Ca II HVF are at velocities greater than 30,000 km s-1 (Table 2 and Figure 9). The HVF velocity from Fe II 5169 is near 26,000 km s-1. The line profile for Fe II at this phase is similar to that of Ca II H&K in both width and depth. A velocity difference of about 5,000 km s-1 is evident between the Ca II line forming region (purple line) and Fe II line forming region (blue line) on the red sides of the features. The blue sides, however, are closely aligned. This discrepancy is caused by the HVF of Fe II 5018 that creates a notch observed near 35,000 km s-1 in the velocity space of Fe II 5169 (blue line). Between the red edge of this notch and the continuum, the side of the Fe II 5169 HVF is shifted by about 7,000 km s-1 to the blue.
The Si II HVF at d has a minimum at about 23,000 km s-1, and the line forming region is confined to a velocity space that is almost entirely in the lower velocity half of the Fe II HVF. The Si II line profile at d (green) is clearly asymmetric, with a steeper blue side and an abrupt transition at the blue edge from the absorption to the continuum. The blue limit of the Si II HVF has nearly the same velocity as the absorption minimum for Ca II. In contrast, the PVF of Si II ( d, d) are nearly symmetric.
At d, HVF are strong from all lines, with velocities for Ca II about 29,000 km s-1, for Fe II near 23,000 km s-1, and for Si II near 21,000 km s-1. The Si II HVF is again formed in a smaller region than for other lines. The blue limit of the Si II HVF is close to the same velocity as it was at d. PVF from Si II and Fe II can be detected near 16,000 km s-1 at this phase, with the Si II PVF significantly distorting the line profile.
At d, the HVF of Si II is noticeably weaker, but it is clearly present as it forms the distortion in the blue side of the Si II PVF. Using the methods described in §3, the velocity of HVF from Si II is measured to be near 21,000 km s-1. The HVF velocity of Fe II is near 22,000 km s-1 and the Ca II HVF remains strong at about 27,000 km s-1. At this phase, the HVF of Fe II 5169 has a significant contribution from PVF Fe II 5018 that narrows the observed profile. The Ca II H&K HVF also receives a strong contribution from PVF Si II 3858.
At d, the most obvious evidence for HVF is a very weak absorption from the Ca II IR3 HVF. The blue line absorption near 21,000 km s-1 is primarily due to the PVF of Fe II 5018. The Ca II H&K HVF absorption (purple) near 23,000 km s-1 is a blend with PVF Si II 3858. The magnitude of the contribution from Si II can be estimated by comparing the HVF of Ca II H&K to the HVF of Ca II IR3. The broad Ca/Si profile does not provide a HVF detection. At this phase, Si II has a PVF at 14,000 km s-1, and the line profile is nearly symmetric in velocity space with no evidence of a HVF.
Figure 8 shows that the absorption minima for HVF are always observed above 20,000 km s-1. There is no evidence at any phase for HVF with lower velocities. By d, all absorptions are easily explained by associations with PVF at velocities near 13,000 km s-1. The blue wing of the Ca II IR3 PVF at this phase is slightly flattened by the remnant of the HVF.
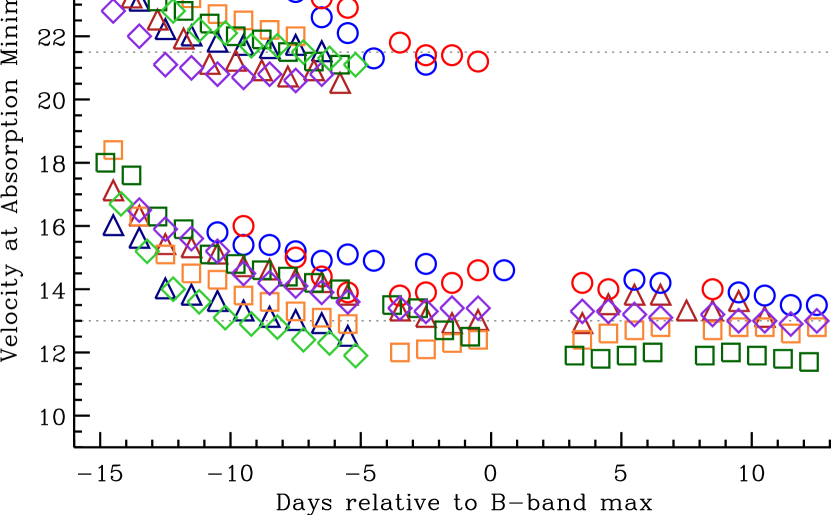
Figure 9 plots HVF and PVF velocity measurements by phase for Si II 6355, Si III 4560, S II 5453, 5641, Ca II 3945, 8579, and Fe II 5018, 5169. All lines contribute both HVF and PVF measurements to the figure. The plotted data are found in Tables 2 and 3. This figure is used to visually compare the relative velocities of both HVF and PVF from different lines at the same phases. Variations in the decline rates are easy to discern. HVF and PVF from the same lines or the same ions can also be compared.
HVF velocities converge to a common value near 21,500 km s-1 and PVF velocities are grouped together at all phases. A significant gap in velocity space is evident between the HVF and PVF regions for all lines at all phases. The separation is about 8,000 km s-1, except Ca II which displays a greater separation before d and Si II 6355 for which the separation at all phases is about 7,000 km s-1. No features are found at velocities that would place them between these layers.
Figure 9 shows that from d to d, the HVF velocities of both Fe II lines are intermediate between the higher Ca II HVF velocities and the lower HVF velocities for other lines. By d, Fe II HVF velocities are essentially the same as the velocities of other HVF that are not Ca II.
The patterns of velocity by phase can be compared the behavior of the HVF line profiles by phase that are displayed in Figure 8. Si II and Fe II both have their maximum velocities in the earliest spectrum at d. At that phase, the Fe II HVF line profile is wide, deep and more like the the HVF of Ca II then the HVF of Si II. The velocity difference between the HVF of Fe II and Si II is 3,600 km s-1. At d, the HVF line profiles are less distinct due to blending with PVF. The Fe II line profile is narrower and weaker and the velocities of Si II and Fe II are separated by 1,600 km s-1. The HVF of Ca II at this phase remain broad and at higher velocities. At d, the HVF of Si II and Fe II are very weak and their measured velocities are within 400 km s-1.
The velocity dispersion of the HVF components of Si II, Si III, S II, and Fe II is confined within a narrow velocity region of less than 2000 km s-1 from d until HVF are no longer detected. By d, the mean HVF velocity (excluding Ca II) is about 21,500 km s-1, and Ca II velocities reach this value a few days later. After the HVF velocities reach 21,500 km s-1, the velocities remain constant within the range of scatter introduced by measurement uncertainties. The mean PVF velocity is observed to be about 13,000 km s-1 at d, and it declines less than 1,000 km s-1 through the end of our observations at d. (Most of the decline is caused by Fe II 5169; see §5.) The relative velocities of the HVF and PVF regions imply that, with homologous expansion, the radius of the HVF line forming region is times greater than the radius of the PVF line forming region.
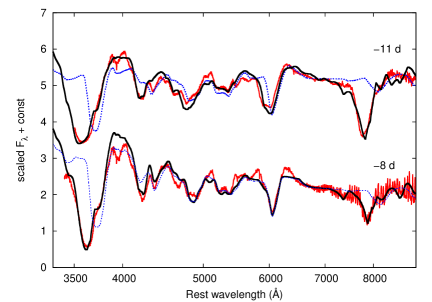
Figure 10 shows SYNOW model spectra plotted with data from SN 2009ig obtained at d and d. These phases are chosen because they include HVF and PVF, and the relative strengths of the components change in the time interval. The data are plotted in the figure with red lines. SYNOW spectra from models with only PVF velocities are plotted in blue with dotted lines, and model spectra with both HVF and PVF are solid black. At both phases, the addition of HVF noticeably improves the models in the regions of the Ca II and Si II features. More subtle improvements are evident around the Fe II and Si III features.
The SYNOW models using only PVF velocities produce a Ca II IR3 feature that is weak and shifted to longer wavelengths because the Ca II lines at d and d are dominated by the HVF component. The relative weakness of the PVF Ca II IR3 feature in the model is a consequence of SYNOW setting the optical depth for each ion to represent the strongest line (in this case Ca II H&K) and then calculating the strength of other lines from that ion assuming local thermodynamic equilibrium (LTE). The SYNOW parameters for the models are given in Table 4. In these simple models, the same HVF and PVF velocities are assigned to all ions except for high-velocity Ca II and Fe II.
Figure 10 can be compared to Figure 4 of Branch et al. (2005), which uses high-velocity Fe II to improve the SYNOW fit to a d spectrum from SN 1994D. Additional HVF contributions from Mg II and Fe III can be added to further improve the agreement between SYNOW model spectra and the data, but HVF from these lines are not clearly identified in SN 2009ig. Mg II and Fe III are not included in the velocity tables or plots.

7. Comparison to HVF in Other SN Ia
Figure 11 shows the development of Si II 6355 absorption features by phase in six SN Ia for which there are high-cadence spectroscopic observations that begin at least 12 days before -max.111Some of the data in Figure 11 were obtained through the WISeREP data archive (Yaron & Gal-Yam, 2012). The original published sources of the spectra are SN 2003du (Stanishev et al., 2007; Blondin et al., 2012), SN 2005cf (Garavini et al., 2007; Wang et al., 2009a), SN 2011fe (Nugent et al., 2011; Pereira et al., 2013) (SNFactory), and SN 2012fr (Childress et al., 2013a). The SN 2012cg data are previously unpublished FAST spectra from the CfA archive. We note that none of these SN Ia are rapid decliners; their values (in SN order of discovery) are 1.02, 1.05, 0.90, 1.11, 0.86, and 0.80.
The spectra obtained before d provide strong evidence for detached HVF regions from both Ca II and Si II in five of the six SN. With one exception, the earliest spectra require separate HVF and PVF components to fit the line profiles. Only SN 2011fe at d has a broad absorption feature that can be fit with a single Gaussian.
The line profiles for every spectrum in Figure 11 can be correlated with a profile from one of the phases in the spectral sequence of SN 2009ig. In some cases, the phase must be offset slightly to establish the best match. For example, the sequence of line profiles from d to d in SN 2005cf is nearly identical to the d to d profiles in SN 2009ig. The features of SN 2003du from d to d are similar to the features of SN 2009ig at the same phases, but the HVF diminish more rapidly in SN 2003du.
The most extreme phase offset relative to SN 2009ig is found in SN 2011fe, for which the sequence from d to d corresponds to SN 2009ig from d to d. Although the first spectrum of SN 2011fe was obtained earlier than the first spectrum of SN 2009ig with respect to -max, the spectrum of SN 2011fe corresponds to a phase in the sequence that is after the detached HVF are observed. There is only a It is possible that even earlier observations of SN 2011fe could have revealed HVF.
Previous authors have studied the eccentricities of the Si II 6355 line profile in SN Ia without directly detecting HVF. The presence of a HVF component from Si II 6355 is inferred from unusual line profiles that are wide, square, or triangular. None of the spectra available before SN 2009ig display separate and distinct high-velocity Si II features such as found at and d in SN 2009ig and from d to d in SN 2012fr.
Garavini et al. (2007) use SYNOW to model early-time spectra of eight SN Ia. They show that fitting the Si II 6355 line profile requires a “detached” Si II region at 20,000–22,000 km s-1 for seven of the eight SN Ia. The other SN in their sample requires a detached region at 24,500 km s-1.
Wang et al. (2009a) compare the early spectra of six SN Ia and report that each of the Si II 6355 line profiles are well fit by a double-Gaussian function with separate central wavelengths. They show that two separate absorption features can be combined to produce flat-bottomed and triangular line profiles.
Figure 11 shows that for different SN Ia the characteristic velocities of the HVF and PVF regions can vary by up to 3,000 km s-1, but in all cases a gap of at least 5,000 km s-1 is maintained between the HVF and PVF. Garavini et al. (2007), Stanishev et al. (2007), Wang et al. (2009a), and Childress et al. (2013a) describe the separation between HVF and PVF components to be about 8,000 km s-1, the same value as the velocity gap in SN 2009ig.
The correlation of line profiles from pre-maximum spectra of other SN Ia to the spectral sequence of SN 2009ig confirms a suggestion made by Stanishev et al. (2007) that the “peculiar” profiles of Si II 6355 in early-time spectra of SN Ia can be explained as part of a common evolutionary sequence that includes separate HVF and PVF components. Stanishev et al. (2007) also propose that the strength of the HVF components from Si II and Ca II lines is correlated in SN Ia. Thus, if one of these lines produces strong HVF, then the other will also have a strong HVF component. The spectra of SN 2009ig confirm this relationship, and they also demonstrate that the presence of strong HVF from Si II and Ca II may be an indicator for HVF of Si III, S II, and Fe II.
The agreement between the SN 2009ig results and these well-studied SN Ia demonstrates that the behavior of HVF line forming regions in spectra of SN 2009ig is not unique, and in fact is quite common. The papers discussed in this section identify fifteen SN Ia with spectra obtained at d or earlier. All fifteen SN display high-velocity Si II at velocities between 17,000 and 22,000 km s-1, and all but SN 2011fe show evidence for separate HVF and PVF absorption components.
8. Possible Sources of HVF
The observations of detached HVF in SN 2009ig suggest the presence of a region at 20,000–23,000 km s-1 in the velocity space of the SN with a localized enhancement of element abundance or density, or both. The proposed line forming region would be the source of HVF for Si II, S II, and Fe II from d to d.
This simple model is complicated by the fact that HVF are initially detected at a range of even higher velocities. In addition, the HVF velocities of Si II, Ca II, and Fe II decline at different rates. This suggests that the lines may sample different density structures. Although the velocity ranges overlap, the HVF of each line are not even detected in the same region. Figure 8 shows that at d, Si II 6355 has the narrowest detached HVF with a velocity range from 10,000 to 30,000 km s-1. At the same phase, the HVF of Ca II and Fe II HVF extend from 10,000 to 50,000 km s-1, but they are offset from each other.
Ca II absorptions are exceptionally broad in velocity space, with absorption minima that are several thousand km s-1 higher than the HVF components of other lines. Due to the very low excitation potentials of the Ca II lines ( eV), they are capable of producing detectable absorptions at much lower abundances than most other lines found in SN Ia. Fe II lines also have low excitation potentials ( eV). In SN 2009ig, the HVF from Fe II are nearly as wide and deep as HVF of Ca II, with velocities between Ca II and Si II.
The simplest explanation for both the HVF Ca and Fe observations is that primordial abundances of these elements are sufficient to produce the observed absorptions. The line profiles can be produced by light from the SN passing through a line forming region that extends from about 10,000 to 50,000 km s-1 in velocity space. The observed minima for these features would move to lower velocities with time, as expansion of the SN reduces opacity at high velocities more rapidly than it does at lower velocities. As the column depth is reduced, the observed minima become nearly constant at velocities near to the inner edge of the line forming region.
If the HVF of Ca II and Fe II are formed in regions of unburned material from the progenitor, it is still a challenge to explain the simultaneous presence of detached HVF for Si II 6355 (8.1 eV) and S II (13.7 eV). An explanation is also required for the fact that the HVF velocities for all lines, as measured at the absorption minima, eventually converge near 21,500 km s-1. Since Figure 8 shows that the line forming materials are distributed through a wide range of velocities, there must be some motivation for the line opacities of Si II, Si III, S II, Ca II, and Fe II to have approximately equal values at the same phases and in a relatively narrow velocity range.
Attempts have been made to explain HVF without invoking a separate line forming region. The flat-bottomed and triangular shapes observed in the Si II 6355 line profile at early times receive particular attention. None of the physical models used to generate unusual line profiles survive comparisons with early observations of multiple SN Ia. HVF from Ca II have also been attributed to opacity effects from recombination, but the time scale of recombination is a day or two and HVF from Ca II are observed from 8 to 15 days in individual SN Ia.
Explosion models for SN Ia make predictions for structures that range from spherical to highly asymmetric. The resulting chemical distributions may be simply stratified by atomic mass, violently mixed between regions of burned material, or contain bubbles of material moving between burning regions. Model results can be tuned to produce specific layering compositions and velocity distributions that may mimic HVF of specific atoms at specific locations. We are not aware of any explosion models that predict the relative uniformity across a range of absorbing materials that is observed for HVF in SN 2009ig.
One way to increase the local density in high-velocity regions is by interaction between the expanding ejecta and nearby circumstellar material (CSM; Gerardy et al., 2004). The shock front sweeps up CSM and a shell is “locked in” after the shock moves on. The shell will continue in homologous expansion with the rest of the SN ejecta. This model satisfies the constraint that the HVF line forming region exist in a narrow, unchanging velocity window and explains the asymmetric line profiles of the Si II 6355 HVF.
Three of the recent models have been able to produce variable density structures: symmetric ignitions that generate strong mixing (Maeda et al., 2010), gravitationally confined detonations with burning regions on the surface of the WD (Meakin et al., 2009), and double-detonation models that produce a high-velocity burning region with a density gap between it and the center of the SN (Shen, Guillochon, & Foley, 2013).
9. Summary and Conclusions
We present a time series of spectra of SN 2009ig obtained between d and d with respect to the time of -max. The two earliest observations in our sample ( d and d) are the first spectra of a SN Ia to resolve the high-velocity component of Si II 6355 as a distinctly separate absorption feature. HVF are identified in the spectra from Si II, Si III, S II, Ca II, and Fe II, and we show that the line profiles require a detached HVF line forming region.
Simultaneous detections are made for HVF and PVF of the same lines from d to d. Velocity measurements demonstrate that the HVF and PVF line forming regions are separated by km s-1 as long as HVF are detected. Using a mean velocity of 21,500 km s-1 for the HVF layer and 13,000 km s-1 for the PVF layer, we show that .
The initial HVF velocities and the velocity decline rates are different for each line. The fact that the HVF velocities eventually converge suggests the presence of a line forming region in SN 20019ig at velocities between 20,000 and 23,000 km s-1. A comparison of the HVF from Si II, Ca II, and Fe II by phase in velocity space shows that HVF from different lines are formed in overlapping but not identical regions. HVF of Ca II and Fe II have strong features that range from 10,000 to 50,000 km s-1 in the earliest spectra, but the locations of their absorption minima differ by 7,000 km s-1. At the same phases, Si II HVF are confined to a much narrower region that extends from 10,000 to only 30,000 km s-1. We explore the physical conditions that can produce detached HVF, and find that it is challenging for any model to reproduce the observations of SN 2009ig.
The spectra of SN 2009ig form a complete map of the transition from the earliest observations of detached HVF to features with contributions from both HVF and PVF, and finally to phases when all of the absorptions are PVF. HVF of both Ca II and Si II are frequent characteristics of SN Ia observed before d, and that allows us to compare our results to observations of several other SN Ia. All of the line profiles found in early-time spectra of SN Ia can easily be correlated with individual profiles that are part of the development sequence defined by SN 2009ig. We interpret this as evidence for a common evolutionary sequence in SN Ia that requires both HVF and PVF line forming regions.
References
- Altavilla et al. (2007) Altavilla, G., et al. 2007, A&A, 475, 585
- Benetti et al. (2005) Benetti, S., Cappellaro, E., Mazzali, P. A., et al. 2005, ApJ, 623, 1011
- Benetti et al. (2004) Benetti, S., Meikle, P., Stehle, M., et al. 2004, MNRAS, 348, 261
- Blondin et al. (2012) Blondin, S., et al. 2012, AJ, 143, 126
- Branch et al. (2005) Branch, D., Baron, E., Hall, N., Melakayil, M., & Parrent, J. 2005, PASP, 117, 545
- Branch, Dang, & Baron (2009) Branch, D., Dang, L. C., & Baron, E. 2009, PASP, 121, 238
- Branch et al. (2003) Branch, D., Garnavich, P., Matheson, T., et al. 2003, AJ, 126, 1489
- Branch et al. (2008) Branch, D., Jeffery, D. J., Parrent, J., Baron, E., Troxel, M. A., Stanishev, V., Keithley, M., Harrison, J., & Bruner, C. 2008, PASP, 120, 135
- Branch et al. (2007) Branch, D., et al. 2007, PASP, 119, 709
- Childress et al. (2013a) Childress, M. J., et al. 2013, ApJ, 770, 29
- Childress et al. (2013b) Childress, M. J., et al. 2013, MNRAS, submitted (arXiv:1307.0563)
- Cushing, Vacca, & Rayner (2004) Cushing, M. C., Vacca, W. D., & Rayner, J. T. 2004, PASP, 116, 362
- Filippenko (1982) Filippenko, A. V. 1982, PASP, 94, 715
- Filippenko (2001) Filippenko, A. V., Li, W. D., Treffers R. R., & Modjaz, M. 2001, in Small-Telescope Astronomy on Global Scales, ed. B. Paczyński, W. P. Chen, & C. Lemme (San Francisco: Astron. Soc. Pac.), 121
- Fisher et al. (1997) Fisher, A., Branch, D., Nugent, P., & Baron, E. 1997, ApJ, 481, 89
- Foley et al. (2013) Foley, R. J. 2013, MNRAS, submitted (arXiv1212.6261)
- Foley et al. (2012) Foley, R. J., Challis, P. J., Filippenko, A. V., et al. 2012 ApJ, 744, 38
- Foley, Sanders, & Kirshner (2011) Foley, R. J., Sanders, N. E., & Kirshner, R. P. 2011, ApJ, 742, 89
- Foley et al. (2003) Foley, R. J., et al. 2003, PASP, 115, 1220
- Garavini et al. (2007) Garavini, G., Nobili, S., Taubenberger, S., et al. 2007, A&A, 471, 527
- Gehrels et al. (2004) Gehrels, N., et al. 2004, ApJ, 611, 1005
- Gerardy et al. (2004) Gerardy, C. L., Höflich, P., Fesen, R. A., et al. 2004, ApJ, 607, 391
- Hatano et al. (1999) Hatano, K., Branch, D., Fisher, A., Baron, E., & Filippenko, A. V. 1999, ApJ, 525, 881
- Hill et al. (1998) Hill, G. J., et al. 1998, Proc. SPIE, 3355, 375
- Höflich et al. (2004) Höflich, P., Gerardy, C. L., Quimby, R., & Marion, G. H. 2006, NewAR, 50, 470
- Horne (1986) Horne, K. 1986, PASP, 98, 609
- Hoyle & Fowler (1960) Hoyle, P., & Fowler, W. A. 1960, ApJ, 132, 565
- Jha, Riess, & Kirshner (2007) Jha, S., Riess, A. G., & Kirshner, R. P. 2007, ApJ, 659, 122
- Kasen (2010) Kasen, D. 2010, ApJ, 708, 1025
- Kasen & Plewa (2005) Kasen, D., & Plewa, T. 2005, ApJ, 622, L41
- Kasen et al. (2003) Kasen, D., et al. 2003, ApJ, 593, 788
- Kleiser et al. (2009) Kleiser, I., Cenko, S. B., Li, W., & Filippenko, A. V. 2009, CBET 1918
- Leonard (2005) Leonard, D. C., Li, W., Filippenko, A. V., Foley, R. J., & Chornock, R. 2005, ApJ, 632, 450
- Li et al. (2001) Li, W., et al. 2001, PASP, 113, 1178
- Leibundgut et al. (1991) Leibundgut, B., Kirshner, R. P., Filippenko, A. V., Shields, J. C., Foltz, C. B., Phillips, M. M., & Sonneborn, G. 1991, ApJ, 371, L23
- Maeda et al. (2010) Maeda, K., et al. 2010, ApJ, 712, 624
- Marion et al. (2009) Marion, G. H., Höflich, P., Gerardy, C. L., Vacca, W. D., Wheeler, J. C., & Robinson, E. L. 2009, AJ, 138, 727
- Marion et al. (2003) Marion, G. H., Höflich, P., Vacca, W. D., & Wheeler, J. C. 2003, ApJ, 591, 316
- Matheson et al. (2000) Matheson, T., Filippenko, A. V., Ho, L. C., Barth, A. J., & Leonard, D. C. 2000, AJ, 120, 1499
- Mattila et al. (2005) Mattila, S., et al. 2005, A&A, 443, 649
- Maund et al. (2013) Maund, J., et al. 2013, MNRAS, 433, 20
- Mazzali, Benetti, & Altavilla (2005a) Mazzali, P. A., Benetti, S., Altavilla, G., et al. 2005a, ApJ, 623, L37
- Mazzali, et al. (2005b) Mazzali, P. A., Benetti, S., Stehle, M., et al. 2005b, MNRAS, 357, 200
- Mazzali, Nomoto, & Cappellaro (2001) Mazzali, P. A., Nomoto, K., Cappellaro, E., et al. 2001, ApJ, 547, 988
- Meakin et al. (2009) Meakin, C. A., et al. 2009, ApJ, 693, 1188
- Miller & Stone (1993) Miller, J. S., & Stone, R. P. S. 1993, Lick Obs. Tech. Rep. 66 (Santa Cruz: Lick Obs.)
- Navasardyan, Cappellaro, & Benetti (2009) Navasardyan, H., Cappellaro, E., & Benetti, S. 2009, CBET 1918
- Nugent et al. (2011) Nugent, P., et al. 2011, Nature, 480, 344
- Oke et al. (1995) Oke, J. B., et al. 1995, PASP, 107, 375
- Parrent, Thomas, & Fesen (2011) Parrent, J. T., Thomas, R. C., Fesen, R. A., et al. 2011, ApJ, 732, 30
- Parrent et al. (2012) Parrent, J. T., et al. 2012, ApJ, 752L, 26
- Patat et al. (2009) Patat, F., Baade, D., Höflich, P., Maund, J. R., Wang, L., & Wheeler, J. C. 2009, A&A, 508, 229
- Pereira et al. (2013) Pereira, R., et al. 2013, A&A, 554, 27
- Poole et al. (2008) Poole, T. S., Breeveld, A. A., Page, M. J., et al. 2008, MNRAS, 383, 627
- Quimby et al. (2006) Quimby, R., Höflich, P., Kannappan, S. J., Rykoff, E., Rujopakarn, W., Akerlof, C. W., Gerardy, C. L., & Wheeler, J. C. 2006, ApJ, 636, 400
- Ramsey et al. (1998) Ramsey, L. W., et al. 1998, Proc. SPIE, 3352, 34
- Rayner et al. (2003) Rayner, J. T., et al. 2003, PASP, 115, 362
- Roming et al. (2005) Roming, P. W. A., Kennedy, T. E., Mason, K. O., et al. 2005, Space Science Reviews, 120, 95
- Röpke et al. (2006) Röpke, F. K., Gieseler, M., Reinecke, M., Travaglio, C., & Hillebrandt, W. 2006, A&A, 453, 203
- Schlafly & Finkbeiner (2007) Schlafly, E. F., & Finkbeiner, D. P. 2011, ApJ, 737, 103
- Schlegel et al. (1998) Schlegel, D. J., Finkbeiner, D. P., & Davis, M. 1998, ApJ, 500, 525
- Schmidt, Weymann, & Foltz (1989) Schmidt, G. D., Weymann, R. J., & Foltz, C. B. 1989, PASP, 101, 713
- Shen, Guillochon, & Foley (2013) Shen, K. J., Guillochon, J., & Foley, R. J. 2013 ApJ, 770, L35
- Silverman, Kong, & Filippenko (2013) Silverman, J. M., Kong, J. J., & Filippenko, A. V. 2012, MNRAS, 25, 1819
- Stanishev et al. (2007) Stanishev, V., et al. 2007, A&A, 469, 645
- Tanaka et al. (2006) Tanaka, M., Mazzali, P. A., Maeda, K., & Nomoto, K. 2006, ApJ, 645, 470
- Tanaka et al. (2008) Tanaka, M., et al. 2008, ApJ, 677, 448
- Thomas et al. (2004) Thomas, R. C., et al. 2004, ApJ, 601, 1019
- Vacca, Cushing, & Rayner (2003) Vacca, W. D., Cushing, M. C., & Rayner, J. T. 2003, PASP, 115, 389
- Wade & Horne (1988) Wade, R. A., & Horne, K. 1988, ApJ, 324, 411
- Wagers, Wang, & Asztalos (2010) Wagers, A., Wang, L., & Asztalos, S. 2010, ApJ, 711, 711
- Wang et al. (2006) Wang, L., Baade, D., Höflich, P., Wheeler, J. C., Kawabata, K., Khokhlov, A., Nomoto, K., & Patat, F. 2006, ApJ, 653, 490
- Wang, Höflich, & Wheeler (1998) Wang, L., Höflich, P., & Wheeler, J. C. 1998, ApJL, 487, 29
- Wang et al. (2003) Wang, L., et al. 2003, ApJL, 591, 1110
- Wang et al. (2009b) Wang, X., Filippenko, A. V., Ganeshalingam, M., et al. 2009, ApJ, 699, L139
- Wang et al. (2009a) Wang, X., Li, W., Filippenko, A. V., et al. 2009, ApJ, 697, 380
- Wang et al. (2008) Wang, X., et al. 2008, ApJ, 675, 626
- Yaron & Gal-Yam (2012) Yaron, O., & Gal-Yam, A. 2012, PASP, 124, 668
| Date | PhaseaaPhase in days with respect to the time of -max (UT 2009 Sep 6.0 = JD 2,455,080.5). | Telescope/Instrument | RangebbWavelength range used for this paper. The complete spectra may cover a larger range. (Å) | MergeccWavelength at which this spectrum was trimmed and combined with a contemporaneous spectrum to form a single spectrum for this date. (Å) |
|---|---|---|---|---|
| Aug. 22.5 | -14.5 | Lick/Kast | 3400–9000 | 6700 |
| Aug. 22.6 | -14.4 | Keck I/LRIS | 3100–7860 | 6700 |
| Aug. 23.4 | -13.6 | HET/LRS | 4210–9000 | 4225 |
| Aug. 23.6 | -13.4 | Swift/Ugrism | 3200–4100 | 4070 |
| Aug. 24.5 | -12.5 | Lick/Kast | 3500–9000 | |
| Aug. 25.5 | -11.5 | Lick/Kast | 3500–9000 | 4000 |
| Aug. 25.6 | -11.4 | Swift/Ugrism | 3200–4400 | 4000 |
| Aug. 26.5 | -10.5 | MMT/Blue Channel | 3190–8330 | |
| Aug. 27.5 | -9.5 | Lick/Kast | 3400–9000 | 6700 |
| Aug. 27.5 | -9.5 | MMT/Blue Channel | 3180–8270 | 6700 |
| Aug. 28.5 | -8.5 | Lick/Kast | 3400–9000 | 6700 |
| Aug. 28.5 | -8.5 | MMT/Blue Channel | 3180–8320 | 6700 |
| Aug. 29.4 | -7.6 | HET/LRS | 7170–9000 | 7210 |
| Aug. 29.5 | -7.5 | MMT/Blue Channel | 3190–8270 | 7210 |
| Aug. 30.4 | -6.6 | HET/LRS | 4710–9000 | 6850 |
| Aug. 30.4 | -6.6 | MMT/Blue channel | 3180–8250 | 6850 |
| Aug. 31.4 | -5.6 | HET/LRS | 4170–9000 | |
| Sep. 1.6 | -4.4 | Swift/Ugrism | 3200–4900 | |
| Sep. 2.4 | -3.6 | HET/LRS | 4160–9000 | |
| Sep. 3.6 | -2.4 | Swift/Ugrism | 3200–4400 | 4200 |
| Sep. 3.5 | -2.5 | HET/LRS | 4190–9000 | 4200 |
| Sep. 4.4 | -1.6 | HET/LRS | 4180–9000 | |
| Sep. 5.4 | -0.6 | HET/LRS | 4180–9000 | |
| Sep. 6.7 | +0.7 | Swift/Ugrism | 3200–4900 | |
| Sep. 9.4 | +3.4 | HET/LRS | 4180–9000 | |
| Sep. 10.4 | +4.4 | HET/LRS | 4180–9000 | |
| Sep. 11.5 | +5.5 | FLWO/FAST | 3300–7200 | |
| Sep. 12.5 | +6.5 | FLWO/FAST | 3300–7200 | |
| Sep. 14.4 | +8.4 | HET/LRS | 4180–9000 | |
| Sep. 15.5 | +9.5 | FLWO/FAST | 3300–7200 | |
| Sep. 16.5 | +10.5 | FLWO/FAST | 3300–7200 | |
| Sep. 17.4 | +11.5 | FLWO/FAST | 3300–7200 | |
| Sep. 18.5 | +12.5 | FLWO/FAST | 3300–7200 |
Note. — The spectra obtained before Sep. 9 were previously published by Foley et al. (2012).
| Date | PhasebbRise time d (Foley et al., 2012), so the first spectrum was obtained 2.6 d after the explosion. | Ca II | Si III | Fe II | Fe II | S II | S II | Si II | Ca II |
|---|---|---|---|---|---|---|---|---|---|
| 3945 | 4560 | 5018 | 5169 | 5453 | 5641 | 6355 | 8579 | ||
| Aug. 22 | -14 | 32.2 | 25.7 | 26.6 | 26.4 | 23.9 | 22.8 | 31.4 | |
| Aug. 23 | -13 | 30.7 | 25.2 | 24.5 | 23.0 | 23.1 | 22.0 | 30.5 | |
| Aug. 24 | -12 | 29.2 | 22.8 | 24.0 | 23.1 | 22.1 | 22.4 | 21.1 | 29.2 |
| Aug. 25 | -11 | 27.9 | 22.2 | 23.2 | 22.8 | 21.9 | 21.8 | 21.0 | 28.4 |
| Aug. 26 | -10 | 26.5 | 22.1 | 22.7 | 22.4 | 21.7 | 21.0 | 20.8 | 27.5 |
| Aug. 27 | -9 | 25.1 | 21.7 | 22.5 | 22.0 | 21.6 | 21.1 | 20.7 | 26.2 |
| Aug. 28 | -8 | 24.0 | 21.7 | 22.2 | 21.9 | 21.5 | 20.8 | 20.8 | 25.0 |
| Aug. 29 | -7 | 23.4 | 21.5 | 22.0 | 21.5 | 21.6 | 20.6 | 20.6 | 24.1 |
| Aug. 30 | -6 | 22.6 | 21.3 | 21.2 | 21.4 | 20.8 | 20.8 | 23.2 | |
| Aug. 31 | -5 | 22.1 | 21.1 | 21.1 | 20.4 | 22.9 | |||
| Sep. 01 | -4 | 21.3 | 21.0 | ||||||
| Sep. 02 | -3 | 21.8 | |||||||
| Sep. 03 | -2 | 21.1 | 21.4 | ||||||
| Sep. 04 | -1 | 21.4 | |||||||
| Sep. 05 | 0 | 21.2 |
Note. — Measurement uncertainties are higher for HVF after d (see discussion in text).
| Date | PhasebbRise time d (Foley et al., 2012), so the first spectrum was obtained 2.6 d after the explosion. | Ca II | Si III | Fe II | Fe II | S II | S II | Si II | Ca II |
|---|---|---|---|---|---|---|---|---|---|
| 3945 | 4560 | 5018 | 5169 | 5453 | 5641 | 6355 | 8579 | ||
| Aug. 22 | -14 | 16.7 | 18.4 | 18.0 | 15.9 | 17.0 | |||
| Aug. 23 | -13 | 15.2 | 16.3 | 17.6 | 15.5 | 16.2 | 16.5 | ||
| Aug. 24 | -12 | 14.0 | 15.1 | 16.3 | 13.9 | 15.3 | 15.9 | ||
| Aug. 25 | -11 | 13.6 | 14.5 | 15.9 | 13.7 | 15.2 | 15.6 | ||
| Aug. 26 | -10 | 15.8 | 13.1 | 14.3 | 15.1 | 13.5 | 15.0 | 15.2 | |
| Aug. 27 | -9 | 15.4 | 12.9 | 13.8 | 14.8 | 13.2 | 14.6 | 14.5 | 16.0 |
| Aug. 28 | -8 | 15.4 | 12.8 | 13.6 | 14.6 | 13.0 | 14.5 | 14.2 | |
| Aug. 29 | -7 | 15.2 | 12.4 | 13.3 | 14.4 | 12.9 | 14.2 | 14.1 | 15.0 |
| Aug. 30 | -6 | 14.9 | 12.3 | 13.1 | 14.2 | 12.8 | 14.1 | 13.9 | 14.4 |
| Aug. 31 | -5 | 15.1 | 11.9 | 12.9 | 14.0 | 12.4 | 13.7 | 13.6 | 13.9 |
| Sep. 01 | -4 | 14.9 | 12.1 | ||||||
| Sep. 02 | -3 | 12.0 | 13.5 | 13.2 | 13.4 | 13.8 | |||
| Sep. 03 | -2 | 14.8 | 12.1 | 13.4 | 13.0 | 13.3 | 13.9 | ||
| Sep. 04 | -1 | 12.3 | 12.7 | 12.8 | 13.4 | 14.2 | |||
| Sep. 05 | 0 | 12.4 | 12.5 | 12.9 | 13.4 | 14.6 | |||
| Sep. 06 | 1 | 14.6 | |||||||
| Sep. 07 | 2 | ||||||||
| Sep. 08 | 3 | ||||||||
| Sep. 09 | 4 | 12.4 | 11.9 | 12.8 | 13.3 | 14.2 | |||
| Sep. 10 | 5 | 12.6 | 11.8 | 13.4 | 13.3 | 14.0 | |||
| Sep. 11 | 6 | 14.3 | 12.7 | 11.9 | 13.7 | 13.2 | |||
| Sep. 12 | 7 | 14.2 | 12.8 | 12.0 | 13.7 | 13.1 | |||
| Sep. 13 | 8 | 13.2 | |||||||
| Sep. 14 | 9 | 12.7 | 11.9 | 13.2 | 13.2 | 14.0 | |||
| Sep. 15 | 10 | 13.9 | 12.8 | 12.0 | 13.5 | 13.0 | |||
| Sep. 16 | 11 | 13.8 | 12.8 | 11.9 | 13.0 | 13.0 | |||
| Sep. 17 | 12 | 13.5 | 12.6 | 11.8 | 12.9 | ||||
| Sep. 18 | 13 | 13.5 | 12.8 | 11.7 | 13.0 |
Note. — Measurement uncertainties are higher for PVF before d (see discussion in text).
| Ion | ||||||||
|---|---|---|---|---|---|---|---|---|
| day | day | |||||||
| = 16,000 km s-1 | = 13,800 km s-1 | |||||||
| Si II | 3.0 | 16 | 30 | 2.0 | 1.2 | 16 | 30 | 2.0 |
| Si II(HVF) | 1.0 | 23 | 50 | 2.0 | 0.1 | 23 | 50 | 2.0 |
| Si III | 0.8 | 16 | 50 | 2.0 | 0.8 | 13 | 50 | 2.0 |
| Si III(HVF) | 0.5 | 23 | 50 | 2.0 | 0.5 | 23 | 50 | 2.0 |
| Mg II(HVF) | 0.5 | 22 | 50 | 4.0 | 0.3 | 22 | 50 | 4.0 |
| S II | 0.7 | 16 | 50 | 2.0 | 0.5 | 13 | 50 | 2.0 |
| S II(HVF) | 0.1 | 23 | 50 | 2.0 | 0.1 | 23 | 50 | 2.0 |
| Ca II | 2.0 | 16 | 50 | 8.0 | 2.0 | 13 | 50 | 8.0 |
| Ca II(HVF) | 25 | 28 | 50 | 4.0 | 6.0 | 26 | 50 | 4.0 |
| Fe II(HVF) | 0.5 | 28 | 50 | 2.0 | 0.05 | 23 | 50 | 2.0 |
| Fe III | 0.5 | 16 | 50 | 2.0 | 0.5 | 16 | 50 | 2.0 |
Note. — : reference line optical depth; : minimum velocity; : maximum velocity; : -folding velocity of optical depth profile. All velocities are in units of km s-1. Both models assume K.