S5 0716+714 : GeV variability study
Abstract
The GeV observations by Fermi-LAT give us the opportunity to characterize the high-energy emission (100 MeV - 300 GeV) variability properties of the BL Lac object S5 0716+714. In this study, we performed flux and spectral analysis of more than 3 year long (August 2008 to April 2012) Fermi-LAT data of the source. During this period, the source exhibits two different modes of flux variability with characteristic timescales of 75 and 140 days, respectively. We also notice that the flux variations are characterized by a weak spectral hardening. The GeV spectrum of the source shows a clear deviation from a simple power law, and is better explained by a broken power law. Similar to other bright Fermi blazars, the break energy does not vary with the source flux during the different activity states. We discuss several possible scenarios to explain the observed spectral break.
keywords:
galaxies: active – BL Lacertae objects: individual: S5 0716+714 – Gamma rays1 Introduction
The BL Lac object S5 0716+714 is an extremely active blazar, which shows significant flux variability on timescales from hours to days (Raiteri et al., 2003, Rani et al., 2010, Gupta et al., 2012). The optical continuum of the source is so featureless that it is hard to estimate its redshift. Nilsson et al. (2008) claimed a lower limit of based on the photometric detection of the host galaxy. Very recently, the detection of intervening Ly systems in the ultra-violet spectrum of the source constrains the earlier estimates of to 0.2315 0.3407 (Danforth et al., 2012).
S5 0716+714 has been classified as an intermediate-peak blazar (IBL) by Giommi et al. (1999), as the frequency of the first spectral energy distribution (SED) peak varies between 1014 and 1015 Hz, and thus does not fall into the wavebands specified by the usual definitions of low and high energy peak blazars (i.e. LBLs and HBLs). A concave X-ray spectrum in 0.1-10 keV band adds another factor in support of the IBL nature of the source (Foschini et al., 2006, Ferrero et al., 2006). The concave X-ray spectrum provides a signature of the presence of both the tail from the synchrotron emission and a flatter part from the Inverse Compton (IC) spectrum.
EGRET on board the Compton Gamma-ray Observatory (CGRO) detected high-energy -ray (100 MeV) emission of 0716+714 several times during 1991 to 2000 (Hartman et al., 1999, Lin et al., 1995, Nandikotkur et al., 2007). Two strong -ray flares were detected in the source during September and October 2007 (Chen et al., 2008). The broadband spectral modeling suggests the presence of two synchrotron self-Compton (SSC) components, representative of a slowly and a rapidly variable component, respectively.
Recently, the MAGIC collaboration reported the first detection of VHE gamma-rays (100 GeV) from the source at a 5.8 significance level (Anderhub et al., 2009). The discovery of S5 0716+714 as a VHE gamma-ray blazar was triggered by its very high optical state, suggesting a possible correlation between the VHE gamma-ray and the optical emission. This source also belongs to the Fermi/LAT Bright AGN Sample (LBAS) (Abdo et al., 2010), where the GeV spectrum of the source is described by a broken power law. The combined GeV-TeV spectra of the source display deviations from the single power-law, which are suggested to be due to absorption in the broad-line region (BLR) in 10–100 GeV energy range (Senturk et al., 2011).
The GeV observations by Fermi-LAT give us the opportunity to study and characterize the high-energy emission (100 MeV - 300 GeV) variability properties of the BL Lac object S5 0716+714. In this study, we performed flux and spectral analysis of more than 3 year long (August 2008 to April 2012) Fermi-LAT data of the source. In this paper, we present the results of the LAT observations. This paper is structured as follows. Section 2 provides a brief description of the observations and data reduction. In Section 3 we report our results, and the discussion is given in Section 4. We conclude our results in Section 5.
2 Observations and Data Reduction
The gamma-ray data (100 MeV 300 GeV) employed here are collected over JD = 2454686 (August 08, 2008 [12:00 UTC]) to JD = 2456022 (April 04, 2012 [12:00 UTC]) in survey mode by the FERMI/LAT instrument. The LAT data are analyzed using the standard ScienceTools (software version v9.23.1) and the instrument response function P7V6111http://fermi.gsfc.nasa.gov/ssc/data/analysis/scitools/overview.html. Photons in the source event class (evcls =2) are selected for this analysis because of their reduced charged-particle background contamination and a good angular reconstruction. A zenith angle cut in the instrument coordinates is used to avoid gamma-rays from the Earth limb. The diffuse emission from our Galaxy is modeled using a spatial model (gal2yearp7v6v0.fits), which is refined with the Fermi-LAT data taken during the first two years of operation. The extragalactic diffuse and residual instrumental backgrounds are modeled as an isotropic component (isotropicp7v6source.txt), which is provided with the data analysis tools. The data analysis is done with an unbinned maximum likelihood technique using the likelihood analysis software developed by the LAT team.
We analyzed a Region of Interest (RoI) of 10∘ in radius, centered at the position of the -ray source associated with S5 0716+714, using the maximum-likelihood algorithm implemented in gtlike. In the RoI model, we include all the 24 sources within 10∘ with their model parameters fixed to their catalog values except for 4C +71.07 (2FGLJ0841.6+7052), as none of the other sources are reported as variable in 2FGL catalog (see Ackermann et al., 2011, for details). 4C +71.07 was reported to be variable source in the 2FGL catalog, so we keep all the model parameters free for it. It is important to note that the contribution of the other 23 sources within the RoI model to the observed variability of the source is negligible as they are very faint compared to 0716+714.
The source variability is investigated by producing light curves by likelihood analysis with different time binnings (1 day, 1 week and 1 month) and over different energy ranges (E 100 MeV, E 248 MeV, E = 0.1-1 GeV and E 1 GeV). The light curves are produced by modeling the spectra over each bin using a simple power law which can provide a good fit over these small time bins, since the statistical uncertainties on the power law indices are smaller than those obtained from the broken-power law (BPL) fits.
The spectral analysis is performed by fitting the GeV spectra with multiple models over the whole energy range covered by Fermi/LAT above 100 MeV. The different spectral forms are : simple power law [SPL, , : Integral flux and : photon index], and broken power law [BPL, , with i = 1 if E and i = 2 if E , , : the two photon indices and : break energy]. We also examine the spectral behavior over the whole energy range with a SPL model fitting over equally spaced logarithmic energy bins with kept constant and equal to the value fitted over the whole range.
We also computed photon fluxes above the “de-correlation energy” E0 (Lott et al., 2012) which minimizes the spurious correlations between integrated photon flux and photon index (). Over the course of 3.8 years of observations, we found = 248 MeV. We follow the adaptive binning analysis method (Lott et al., 2012) to generate the constant uncertainty light curve above . The estimated systematic uncertainty on the flux is 10 at 100 MeV, 5 at 500 MeV, and 20 at 10 GeV.
3 Results
3.1 Sky map
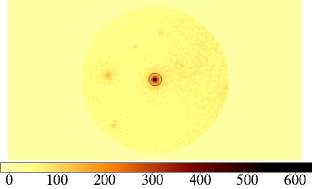
Figure 1 shows the Fermi-LAT count map of the -ray events above 100 MeV centered on the position of S5 0716+714 with an image radius of 10∘. As we see, there is no source as bright as 0716+714 within 10∘ of RoI. The nominal position of 0716+714 is marked by a circle. A total of 14,657 -ray photons associated with 0716+714 are detected during 3.8 years of observations within the 68 containment radius of the LAT PSF above 100 MeV.
3.2 Temporal behavior
3.2.1 Light Curves
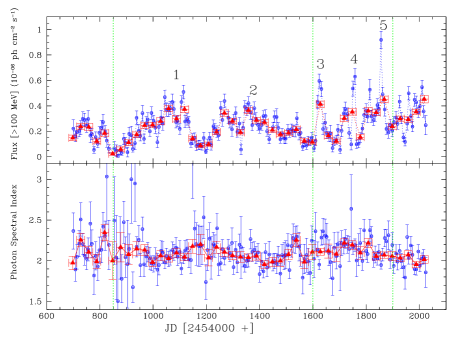
We investigate the GeV flux variability of 0716+714 over a time period between August 04, 2008 to April 04, 2012. Fig. 2 shows the weekly and monthly averaged gamma-ray light curves extracted over an energy range 100 MeV to 300 GeV. The source displays substantial flux variability during the past 3.8 years of LAT monitoring with five major flares labeled as “1” to “5”. Apparently, some individual flares are further composed of a number of sub-flares.
There is a significant enhancement in the weekly averaged gamma-ray flux over a time period between JD’222JD’ = JD-2454000 (September 21, 2006) = 900 to 1110 (flare 1), peaking at JD’ 1110, with peak flux equal to (0.570.05)10-6 ph cm-2s-1, which is 6 times brighter than its minimum value and 3 times brighter than its average value. Later it decays reaching a minimum at JD’ = 1150 followed by a quiescent state until JD’ = 1220. The quiescent state is followed by a low amplitude flux variability (flare 2) and later by a sequence of rapid flares (flare 3 to 5).
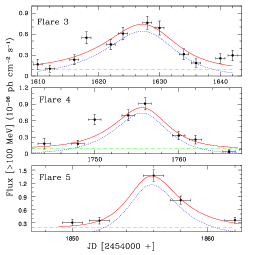
The high photon statistics during the rapid flares allows us to investigate their evolution with a fine time resolution. The light curves for with a 3 day time binning for the individual flares are shown in Fig. 3. A fit consisting of a slowly varying background and sub-flaring components is performed for each individual flare. The slowly varying background is roughly approximated by a photon flux value = 0.40 ph cm-2 s-1. Each component is fitted by a function of the form :
| (1) |
where Tr and Tf are the rising and decay times, respectively, and F0 is the flux at t0 representing approximately the flare amplitude. The solid curves in Fig. 3 represent the fitted flare components and the fitted parameters for each sub-component are given in Table 1.
Flare 3 lasts for a duration of 12 days (JD’ = 1610-1638). The source reaches a peak flux value FE>100MeV = (0.630.11)10-6 ph cm-2s-1 during this flare with a doubling timescale of 4.3 days. This flare is followed by another rapid flare (flare 4) which has a duration of 10 days. During this flare, the source reaches a peak flux value = (0.730.12)10-6 ph cm-2s-1 above 100 MeV. Flare 5 is the brightest gamma-ray flare observed in the source with a peak flux value = (1.130.03) 10-6 ph cm-2s-1 at E 100 MeV with a doubling timescale of less than a day. This is the fastest recorded GeV flare in the source.
| Flare | Tr | Tf | t0 | F0 | Doubling |
|---|---|---|---|---|---|
| (days) | (days) | JD’ | ph cm-2 s-1 | Time (days)∗ | |
| 3 | 6.221.02 | 4.140.86 | 1628.20.2 | 0.630.11 | 4.31 |
| 4 | 4.210.66 | 2.440.34 | 1756.00.1 | 0.730.12 | 2.91 |
| 5 | 1.290.12 | 2.050.18 | 1855.50.1 | 1.130.03 | 0.89 |
doubling time =
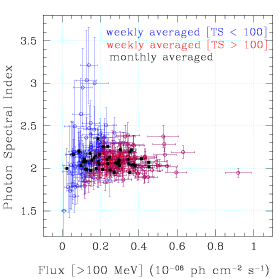
In comparison to the substantial flux variations, the photon index () remains almost constant during the different modes of flux activity. We notice only a marginal steepening of spectrum in the monthly averaged light curves during the flaring epochs. As we see in Fig. 4, the photon flux variations are characterized by a weak spectral hardening. For monthly averaged statistics, changes from (2.200.01) to (2.000.04) for a flux variation of (0.100.02) to (0.500.01) 10-6 ph cm-2 s-1.
3.2.2 Flux variations at different Energy bands
We have also investigated the temporal characteristics of the source at different energy bands. Fig. 5 shows a comparison of the flux variability at different energies. Figures 5 (b) & (c) show the GeV flux variations above and below 1 GeV, respectively. We found no substantial difference in the flux variability at E1GeV and E1GeV. Such a behavior is obvious because of the marginal variation in . We also do not find any time lag between the two light curves (at E below and above 1 GeV) for the weekly averaged light curves. Due to a limited statistics for the finer binned light curves, we can not claim any shorter time lag than our binning interval of 7 days.
Fig. 5 (d) shows the flux variations above the de-correlation energy, = 248 MeV. The constant uncertainty (15) light curve (red symbols) is obtained through the adaptive binning analysis method following Lott et al. (2012). An advantage of using this method is to avoid upper limits and to obtain better characteristics of the flares. The weekly averaged light curve below is shown in part (e) of the Fig. 5. The variability features are not clearly visible below due to large uncertainty and scattering of individual data points.
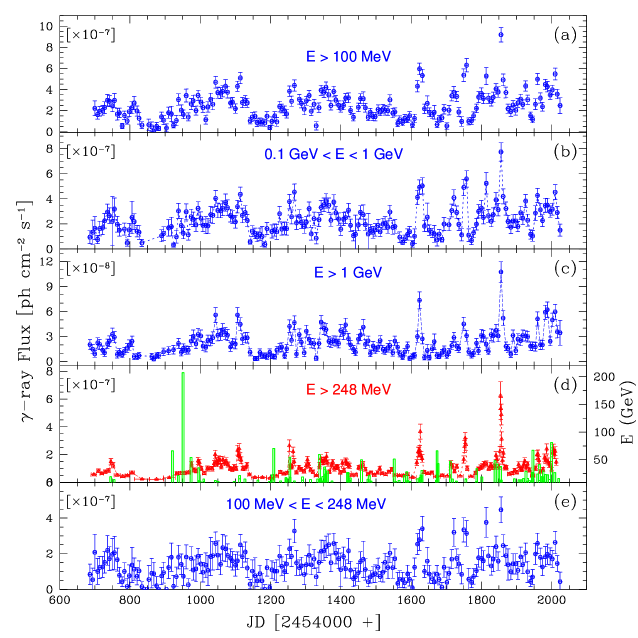
3.2.3 Highest energy photons
During the 3.8 years of observations, the highest energy photon associated with 0716+714 was detected at JD = 2454951 with an estimated energy of 207 GeV. This photon is observed as a front event of the LAT detector. The reconstructed arrival direction of the photon is 0.05∘ away from S5 0716+714, and is within the 68 containment radius of the LAT PSF at 207 GeV. Based on our model fit of the epoch which contains that highest-energy photon, we find the probability that the photon was associated with S5 0716+714 (as opposed to all other sources in the model including the diffuse emission and nearby point sources) is 99.96 which corresponds to 3.56 .
In total, we found 107 events with estimated energies higher than 10 GeV centered at S5 0716+714 within the 68 confinement radius of the LAT PSF and a total of 10 events above 50 GeV. Fig. 5 (d) plots the arrival time distribution of photons above 10 GeV. Interestingly, the highest energy photon arrived during the rising part of flare 1. In fact, a number of several high-energy photons were observed during this period. But during the peak and decay of flare 1, the number of events associated with the arrival of high-energy photons is very small. For rest of the four flares “2”-“5”, the arrival time distribution of the high-energy photons do not follow any systematic trend w.r.t the photon flux variations (see Fig. 5 (d)).
3.2.4 Variability timescale
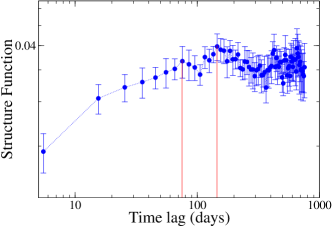
In order to extract the characteristic time scale of variability () from the GeV light curves, we employed the structure function (SF) (Simonetti et al., 1985) analysis method. The formula and details of the method can be found in Rani et al. (2009). For the SF analysis, we have used the adaptive binned -ray light curve at E248 MeV. The -ray SF curve is shown in Fig. 6. The SF curve follows a continuous rising trend showing a peak at 75 days, followed by another maximum at 145 days. So, the SF curve reveals two different variability time scales, one which reflects the short-term variability () while other refers to the long-term variability (). The first SF peak at time lag, = 755 days characterize the short-term or fast variability while the second peak at = 1405 days represent the long-term variability.
3.3 Spectral behavior
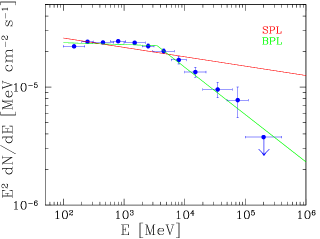
We extract the -ray spectrum using data for the entire 3.8 year period. Fig. 7 shows the GeV spectrum of the source with blue symbols as spectral measurements over equally spaced logarithmic energy bins in an energy range between 100 MeV to 300 GeV. The solid curves represent the best fitted power laws i.e. simple power law (SPL in red) and broken power law (BPL in green). The best-fitted model parameters calculated by the fitting procedure are summarized in Table 1. A BPL model is favored to describe the -ray spectral shape over the SPL model with a difference of the logarithm of likelihood, = 73.8 which corresponds to a significance of the order of 10 (see Table 1). So, we conclude that the GeV spectrum of the source is governed by a broken power law with break energy, = 3.50.05 GeV with power law indices, = 2.020.01 and = 2.400.04, respectively, below and above the break energy. The change in power law index () defined as is 0.380.04.
It is very likely that the physical conditions within the emission region changes
during different activity states. This motivates us to investigate the
-ray spectrum for the individual flares. So, we compare the GeV spectra of the source
during different activity states. Depending upon the
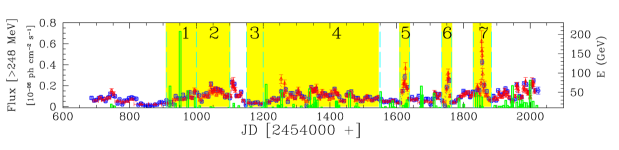
flux variability state and the distribution of high energy photons (E20 GeV), we construct
the GeV spectrum of the source over seven different periods shown in the top of
Fig. 8. It is important to note that the spectral bins are not at equal time
widths. We consider the following periods :
Bin1 [JD’ = 911-1000] : Flux is rising and a bunch of high energy
(E20 GeV) photons arrive during this period.
Bin2 [JD’ = 1000-1100] : Flux level is high and no high energy photons arrive during this period.
Bin3 [JD’ = 1150-1200] : Flux level is very low and no high energy (E15 GeV) photons arrive during this period.
Bin4 [JD’ = 1200-1550] : The source exhibits moderate level flux activity with a random distribution of
arrival times of high energy photons.
Bin5 [JD’ = 1610-1638] : A rapid flare with fewer high energy photons.
Bin6 [JD’ = 1735-1764] : A rapid flare with no high energy photons.
Bin7 [JD’ = 1840:1884] : The highest peaking flare with fewer high energy photons.
Fig. 8 (a)-(g) shows the individual GeV spectra of the source over these time bins. Here the blue symbols represent the spectral points constructed through a SPL fitting over the equally spaced logarithmic energy bins and the solid curves show the best fitted power law distributions. The fitted parameters with the SPL and BPL models are given in Table 2. The difference of the logarithm of likelihood is given in the second last column of Table 2 with a significance level by which the BPL model is preferred over the SPL model in the last column. We find that a broken power law model is favored to describe the -ray spectral shape over the SPL model for all the time bins except Bin1. For this bin, the estimated value of = 0.46, which corresponds to a significance level lower than 1 . Thus, the BPL model is not a better fit of the data than SPL. So, we do not find any clear break in GeV spectrum of the source for Bin1, rather, a SPL model better describes the spectrum (see Fig. 8 (a)). Interestingly, the -ray flux of the source is rising and a bunch of high energy photons are observed over this period. In fact, the 207 GeV photon arrives during this period. For the remaining time bins, the change in spectral index () below and above the break energy is listed in the column 8 of Table 2. We found that varies between 0.380.02 to 1.140.40 over the different activity states of the source.
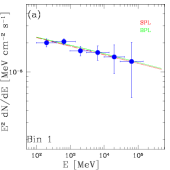
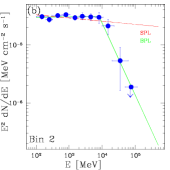
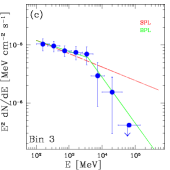
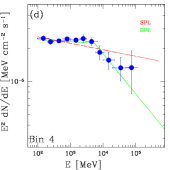
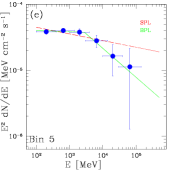
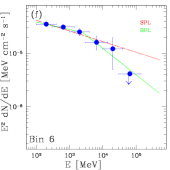
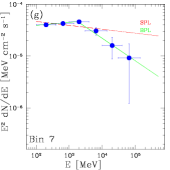
| Bin | JD’ | Model | / | Significance | |||||
|---|---|---|---|---|---|---|---|---|---|
| [JD-2454000] | () | (GeV) | |||||||
| total | 680-2022 | SPL | 2.090.01 | ||||||
| BPL | 2.020.01 | 2.400.04 | 3.500.05 | 0.380.04 | 73.80 | ||||
| 1 | 911-1000 | 0.210.10 | SPL | 2.080.04 | |||||
| BPL | 2.110.05 | 2.050.04 | 3.000.25 | -0.060.06 | 0.46 | ||||
| 2 | 1000-1100 | 0.410.11 | SPL | 2.050.02 | |||||
| BPL | 1.990.03 | 3.130.40 | 8.000.25 | 1.140.40 | 16.90 | ||||
| 3 | 1150-1200 | 0.080.04 | SPL | 2.230.09 | |||||
| BPL | 2.190.08 | 2.790.50 | 3.700.20 | 0.600.09 | 13.22 | ||||
| 4 | 1200-1550 | 0.270.10 | SPL | 2.050.01 | |||||
| BPL | 2.010.03 | 2.370.01 | 5.60.10 | 0.360.10 | 11.90 | ||||
| 5 | 1610-1638 | 0.450.12 | SPL | 2.100.04 | |||||
| BPL | 2.020.02 | 2.440.03 | 2.800.15 | 0.420.03 | 11.72 | ||||
| 6 | 1735-1764 | 0.510.11 | SPL | 2.190.05 | |||||
| BPL | 2.140.07 | 2.490.14 | 3.700.10 | 0.350.12 | 9.80 | ||||
| 7 | 1840-1884 | 0.680.15 | SPL | 2.070.03 | |||||
| BPL | 1.940.05 | 2.420.13 | 1.800.05 | 0.480.13 | 10.52 |
is the difference of the -log(likelihood) value of BPL with respect to SPL.
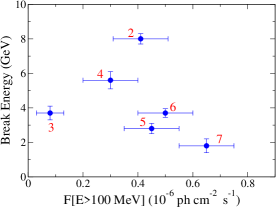
The variation of the break energy, with flux during the different activity states is displayed in Fig. 9 (a), which does not show any systematic evolution of the break energy as a function of the flux variations. The formal correlation statistics also does not reveal a significant correlation of the break energy w.r.t. the flux variations. Formally, we obtain the following correlation coefficient and significance : = -0.34 and 55 confidence level ( being the linear Pearson correlation coefficient). Similar to other Fermi blazars, we find no systematic variation of as a function of the photon flux variations in S5 0716+714.
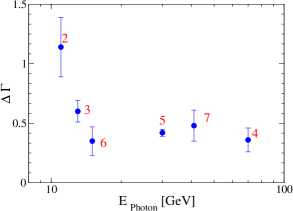
The variation of change in spectral slope () as a function of the break energy (EBreak) is shown in Fig. 9 (b). Again, we do not see any systematic variation in w.r.t. EBreak. Although, (1) is higher for the higher break energy (8 GeV), but, for the rest, remains almost constant with a decrease in EBreak.
As we see in Fig. 8, no spectral break is observed during the arrival period of the highest energy photon (Bin 1). Likewise, is maximum for Bin 2 (no high energy photons arrived during this period). This indicates a possible connection between the energy of highest detected GeV photon, and the spectral break parameters, as expected. Fig. 10 shows the variation of as a function of . As we see here, decreases with an increase in . The correlation statistics reveal a significant correlation of w.r.t. . Formally, we obtain the following correlation coefficient and confidence level, for vs : = -0.74 and 95 confidence level. Concluding this section, we can say that the detection of the high energy photons with energy is seems to be correlated with the spectral break parameter, .
4 Discussion
The GeV spectral breaks seen in many bright Fermi blazars lie within a few GeVs. The origin of these spectral breaks has generated considerable theoretical interest, and is still controversial. Among the most likely scenarios, the absorption of -rays via photon-photon pair production on He II Lyman recombination continuum and lines within the broad line region (e.g. Poutanen & Stern, 2010, Tanaka et al., 2011, and references therein) may be responsible for the observed breaks. Spectral breaks in the bright Fermi FSRQs like 3C 454.3, 3C 279, PKS 1510-089, 4C +21.35 etc. were interpreted using these scenarios. absorption by full BLR is also proposed as one reasonable possibility (Senturk et al., 2011). The -ray emitting region must be located deep within the BLR for this model to work.
Alternatively, the GeV spectral breaks could also be explained by a combination of two Compton-scattered components, for example, by Compton scattering of the disk and BLR radiation as proposed by Finke & Dermer (2010). They explore this possibility to model the spectral breaks in FSRQ 3C 454.3. The combined external Compton and synchrotron self-Compton components may also explain these spectral breaks. A further explanation invokes an intrinsic origin of the spectral breaks. The change in spectral index below and above the break of order 0.5 is expected from the typical “cooling break” associated with radiative losses (Abdo et al., 2009). The observed softening may instead be due to an intrinsic decline or break in the particle distribution as well.
We found that the change in spectral slope () above and below the break energy varies between 0.4 to 1.14. The estimated values for S5 0716+714 does not favor the standard radiative cooling models that predict a spectral break of 0.5 units. It is also difficult to reconcile the constancy of the break energy w.r.t. the flux variations within the “cooling break” scenario. Furthermore, this scenario failed to explain the absence of break for Bin 1. From this we conclude that the observed spectral breaks in 0716+714 are unlikely to have an intrinsic origin associated with the radiative cooling.
The spectral break in FSRQ 3C 454.3 is reproduced by a combination of two components, namely, the Compton-scattered disk and broad-line region (BLR) radiations (Finke & Dermer, 2010). But, as for BL Lacs, the jet radiation completely outshines the disk emission. So, the disk emission contribution seems to be negligible here, although, we can not exclude it completely. A further possibility is the combination of SSC and EC components. Modeling the broadband SEDs of the source over different time bins during the course of Fermi/LAT observations (see Rani et al. 2013 for details), we found that a model including an external Compton component generally does a better job in reproducing the entire SED with an external radiation field dominated by Ly- from a putative broad line region (BLR). There we found that the radiation field energy density of this external field varies between 10-(6-5) ergs cm-3, which is a factor of 1000 lower than what we expect for a typical quasar. Such values are not unreasonable for BL Lac type objects and since S5 0716+714 is known to exhibit a featureless optical spectrum. A low energy density of the BLR appears in accordance with the non-detection of emission line. However, the non-existence of a spectral break for ‘Bin 1’ (see Fig. 8) cannot be easily explained within this scenario.
The spectral breaks within few GeVs are well described by -ray absorption within the broad line region. The observed spectral breaks due to absorption within the broad line region constrain the location of the -ray emission region. It implies that -rays are produced within the BLR region i.e. within a few parsec distance from the central engine. The -ray photons originating outside of the BLR region are unlikely to be absorbed as a result of absorption and hence do not show any break in the GeV spectrum. Likewise the chances of detection of high energy photons will also be higher. So, it can be convincingly argued that the detection of many high energy photons and the absence of a spectral break for Bin1 is due to lower absorption.
Alternatively, external Compton scattering of IR photons from a dusty torus offers an alternative explanation for the observed spectral breaks. Given the fact that 0716+714 is also detected at TeV energies by MAGIC (Anderhub et al., 2009), the frequency of the target photons for the inverse Compton up-scattering in the Thompson regime should be less than 1014 Hz (Sahayanathan & Godambe, 2012). If the scattering would be in the KN regime, a steeper photon index should be seen, which is in disagreement of the observed hard TeV spectra. However, we note that the lack of any excess IR detection expected from a torus, does not necessarily rule out its existence, owing to the large amount of relativistic Doppler-boosting of the core region and the resulting strong dominance of the non-thermal emission. In this context the physical nature of the observed spectral break in the GeV/TeV spectrum still remains open and poses a challenge for future theoretical modeling.
The impact of the geometry of the broad line region on the expected absorption, through the process was recently discussed by Tavecchio & Ghisellini (2012). They argued that a correlated variation in and is expected for an “open” geometry of the BLR. However, if the BLR is “closed” the break energy does not change as long as the emission occurs within the BLR, but decreases as the emission region moves away from the central engine. For 0716+714, we do no find any correlated variation between and , although, both changes from state to state. This rules out the possibility of an “open” BLR geometry and most probably the emission region in the source is not located at a fixed distance from the black hole. We also notice that the GeV spectrum constructed during the period of detection of the highest energy (207 GeV) photon does not show any spectral break, while, the spectral break parameters ( and ) are maximum for the spectrum constructed over the period where the detection of high energy (E20 GeV) photons is low. A significant correlation between and with a decreasing for an increasing is a signature of varying opacity.
5 Conclusions
The continuous monitoring in the high-energy -ray band by Fermi/LAT allows us to investigate the GeV flux and spectral variability of the BL Lac object S5 0716+714. The source displays prominent flaring activity during this period reaching as high as 1.5 10-6 ph cm-2 s-1 above 100 MeV. The source exhibits two different modes of variability : (1) the slow and modest level flux variability, and (2) the rapid flares. The estimated variability timescale for the two modes of variability are 1405 and 755 days, respectively. The highest recorded photon for the source arrives at “207 GeV”, and is observed during the rising part of the first flare at JD = 2454951. Similar to other Fermi blazars, no significant correlation between the flux and photon index has been measured in the source, rather the flux variations are characterized by a weak spectral hardening. A more detailed discussion of the broadband flaring activity with emission models will be given in Rani et al. (2012).
The 3.8 year averaged -ray spectral shape above 100 MeV clearly deviates from a
single power law. A broken-power law model yields a break energy within a few GeV range. During
different activity states of the source, the spectral break energy does not follow any systematic trend
w.r.t the photon flux variations. Such a behavior is
similar to that observed in other bright Fermi blazars. The combination of non-simultaneous GeV-TeV
spectrum of the source shows absorption
like features between 10-100 GeV (Senturk et al., 2011). More simultaneous GeV-TeV observations are required
to check this. A continuous TeV monitoring of the source during will
shed more light on it.
This study has highlighted some possible explanations for the origin of GeV spectral breaks in BL Lac
S5 0716+714. Following our analysis, we argued in favor of absorption.
Still, we can not rule out a combination of two or more Compton scattered components which could also lead such breaks.
We address all these key questions for future study.
Acknowledgments
The Fermi-LAT Collaboration acknowledges the generous support of a number of agencies and institutes that have supported the Fermi-LAT Collaboration. These include the National Aeronautics and Space Administration and the Department of Energy in the United States, the Commissariat à l’Energie Atomique and the Centre National de la Recherche Scientifique / Institut National de Physique Nucléaire et de Physique des Particules in France, the Agenzia Spaziale Italiana and the Istituto Nazionale di Fisica Nucleare in Italy, the Ministry of Education, Culture, Sports, Science and Technology (MEXT), High Energy Accelerator Research Organization (KEK) and Japan Aerospace Exploration Agency (JAXA) in Japan, and the K. A. Wallenberg Foundation, the Swedish Research Council and the Swedish National Space Board in Sweden. BR gratefully acknowledges the travel support from the COSPAR Capacity-Building Workshop fellowship program. BR was supported for this research through a stipend from the International Max Planck Research School (IMPRS) for Astronomy and Astrophysics at the Universities of Bonn and Cologne.
References
- Abdo et al. (2009) Abdo, A. A., Ackermann, M., Ajello, M., et al. 2009, ApJS, 183, 46
- Abdo et al. (2010) Abdo, A. A., Ackermann, M., Ajello, M., et al. 2010, ApJ, 710, 1271
- Ackermann et al. (2011) Ackermann, M., Ajello, M., Allafort, A., et al. 2011, ApJ, 743, 171
- Anderhub et al. (2009) Anderhub, H., Antonelli, L. A., Antoranz, P., et al. 2009, ApJ, 704, L129
- Chen et al. (2008) Chen, A. W., D’Ammando, F., Villata, M., et al. 2008, A&A, 489, L37
- Danforth et al. (2012) Danforth, C. W., Nalewajko, K., France, K., & Keeney, B. A. 2012, ArXiv e-prints
- Ferrero et al. (2006) Ferrero, E., Wagner, S. J., Emmanoulopoulos, D., & Ostorero, L. 2006, A&A, 457, 133
- Finke & Dermer (2010) Finke, J. D. & Dermer, C. D. 2010, ApJ, 714, L303
- Foschini et al. (2006) Foschini, L., Tagliaferri, G., Pian, E., et al. 2006, A&A, 455, 871
- Giommi et al. (1999) Giommi, P., Massaro, E., Chiappetti, L., et al. 1999, A&A, 351, 59
- Gupta et al. (2012) Gupta, A. C., Krichbaum, T. P., Wiita, P. J., et al. 2012, MNRAS, 425, 1357
- Hartman et al. (1999) Hartman, R. C., Bertsch, D. L., Bloom, S. D., et al. 1999, ApJS, 123, 79
- Lin et al. (1995) Lin, Y. C., Bertsch, D. L., Dingus, B. L., et al. 1995, ApJ, 442, 96
- Lott et al. (2012) Lott, B., Escande, L., Larsson, S., & Ballet, J. 2012, A&A, 544, A6
- Nandikotkur et al. (2007) Nandikotkur, G., Jahoda, K. M., Hartman, R. C., et al. 2007, ApJ, 657, 706
- Nilsson et al. (2008) Nilsson, K., Pursimo, T., Sillanpää, A., Takalo, L. O., & Lindfors, E. 2008, A&A, 487, L29
- Poutanen & Stern (2010) Poutanen, J. & Stern, B. 2010, ApJ, 717, L118
- Raiteri et al. (2003) Raiteri, C. M., Villata, M., Tosti, G., et al. 2003, A&A, 402, 151
- Rani et al. (2010) Rani, B., Gupta, A. C., Joshi, U. C., Ganesh, S., & Wiita, P. J. 2010, ApJ, 719, L153
- Rani et al. (2009) Rani, B., Wiita, P. J., & Gupta, A. C. 2009, ApJ, 696, 2170
- Rani et al. (2013) Rani, B., Krichbaum, T. P., Fuhrmann, L., et al. 2013, arXiv:1301.7087
- Sahayanathan & Godambe (2012) Sahayanathan, S., & Godambe, S. 2012, MNRAS, 419, 1660
- Senturk et al. (2011) Senturk, G. D., Errando, M., Boettcher, M., et al. 2011, ArXiv e-prints
- Simonetti et al. (1985) Simonetti, J. H., Cordes, J. M., & Heeschen, D. S. 1985, ApJ, 296, 46
- Tanaka et al. (2011) Tanaka, Y. T., Stawarz, Ł., Thompson, D. J., et al. 2011, ApJ, 733, 19
- Tavecchio & Ghisellini (2012) Tavecchio, F. & Ghisellini, G. 2012, ArXiv e-prints