Extraordinary Magnification of the Ordinary Type Ia Supernova PS1-10afx
Abstract
Recently, Chornock and co-workers announced the Pan-STARRS discovery of a transient source reaching an apparent peak luminosity of erg s-1. We show that the spectra of this transient source are well fit by normal Type Ia supernova (SNIa) templates. The multi-band colors and light-curve shapes are also consistent with normal SNeIa at the spectroscopically determined redshift of ; however, the observed flux is a constant factor of 30 times too bright in each band over time as compared to the templates. At minimum, this shows that the peak luminosities inferred from the light-curve widths of some SNeIa will deviate significantly from the established, empirical relation used by cosmologists. We argue on physical grounds that the observed fluxes do not reflect an intrinsically luminous SNIa, but rather PS1-10afx is a normal SNIa whose flux has been magnified by an external source. The only known astrophysical source capable of such magnification is a gravitational lens. Given the lack of obvious lens candidates, such as galaxy clusters, in the vicinity, we further argue that the lens is a supermassive black hole or a comparatively low-mass dark matter halo. In this case, the lens continues to magnify the underlying host galaxy light. If confirmed, this discovery could impact a broad range of topics including cosmology, gamma-ray bursts, and dark matter halos.
Subject headings:
supernovae: individual (PS1-10afx) — gravitational lensing: strong — gravitational lensing: micro — dark matter1. Introduction
Type Ia supernovae (SNeIa) represent a remarkably homogeneous class of cataclysmic explosions. While some debate remains over the precise physical nature of their progenitors and explosion mechanism (e.g. Howell, 2011), a large body of evidence shows that SNeIa reach nearly standard peak luminosities (e.g. Yasuda & Fukugita, 2010), and there is a strong correlation between this and other observables, most notably their light-curve shapes (Phillips, 1993), which can be used to standardize this peak power. This relation has famously been exploited to probe the cosmology of our universe (e.g. Riess et al., 1998; Perlmutter et al., 1999).
SNeIa are understood from theoretical work to be thermonuclear explosions involving C/O white dwarf stars, a fact which is now supported by observational constraints on the progenitor systems (Nugent et al., 2011; Bloom et al., 2012). The peak luminosities of SNeIa and the tight relationship between these and their light-curve shapes can be understood in terms of the mass of radioactive 56Ni produced in the first seconds of the explosion and the opacities of the ejected material (e.g. Kasen & Woosley, 2007).
Recently, Chornock et al. 2013 (hereafter C13) have presented a transient, PS1-10afx, from the Panoramic Survey Telescope & Rapid Response System 1 (Pan-STARRS1; Kaiser et al. 2010) survey with a light-curve shape similar to SNeIa, but with an apparent luminosity far larger ( erg s-1). The redshift can be set precisely at based on narrow interstellar emission lines presumably from the relatively faint, and compact galaxy within of the transient. The apparent luminosity of PS1-10afx is similar to so-called superluminous supernovae (Gal-Yam, 2012), but the colors and fast evolving light curve are not.
In this letter we argue that PS1-10afx is a normal SNIa with a normal peak luminosity that has been magnified by a gravitational lens. We show that the spectra are consistent with normal SNeIa in §2. In in §3, we show this classification is supported by the photometry of PS1-10afx, but the fluxes are much brighter than the light-curve width would suggest. In §4 we consider various gravitational lensing scenarios to explain the anomalous brightness of PS1-10afx. We conclude in §5 with a summary of our results and discuss the implications of this discovery.
2. Spectroscopic Classification
We first consider the spectroscopic nature of PS1-10afx, as spectroscopic features define the classification system of supernovae (e.g. Wheeler & Harkness, 1990; Filippenko, 1997). Our analysis is limited to the four spectra presented by C13. We assign spectroscopic classifications using the SN template fitting package, superfit (Howell et al., 2005). We employed 157 representative SNIa templates with a roughly Gaussian distribution of phases ( days), 135 SNIbc templates ( days), and 95 SNII templates. These include normal supernovae (e.g. 1994D, 1992A, 1994I, 1984L) as well as peculiar (e.g. 1991bg, 1991T, 1998bw). The templates are redshifted, (de)reddened and combined with galaxy templates to fit the observed spectra. Based on the host galaxy SED presented in C13, we only consider a standard Sc type galaxy template below, although our results do not change significantly if we adopt other templates.
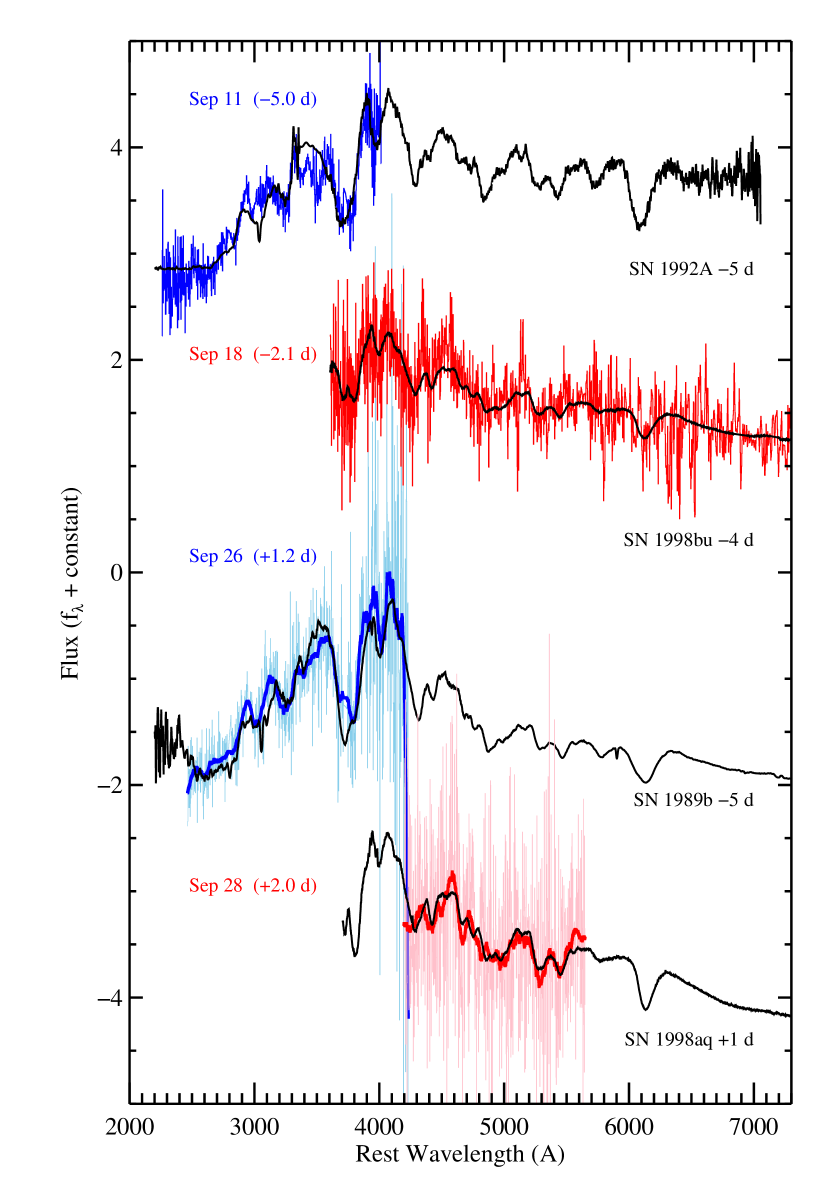
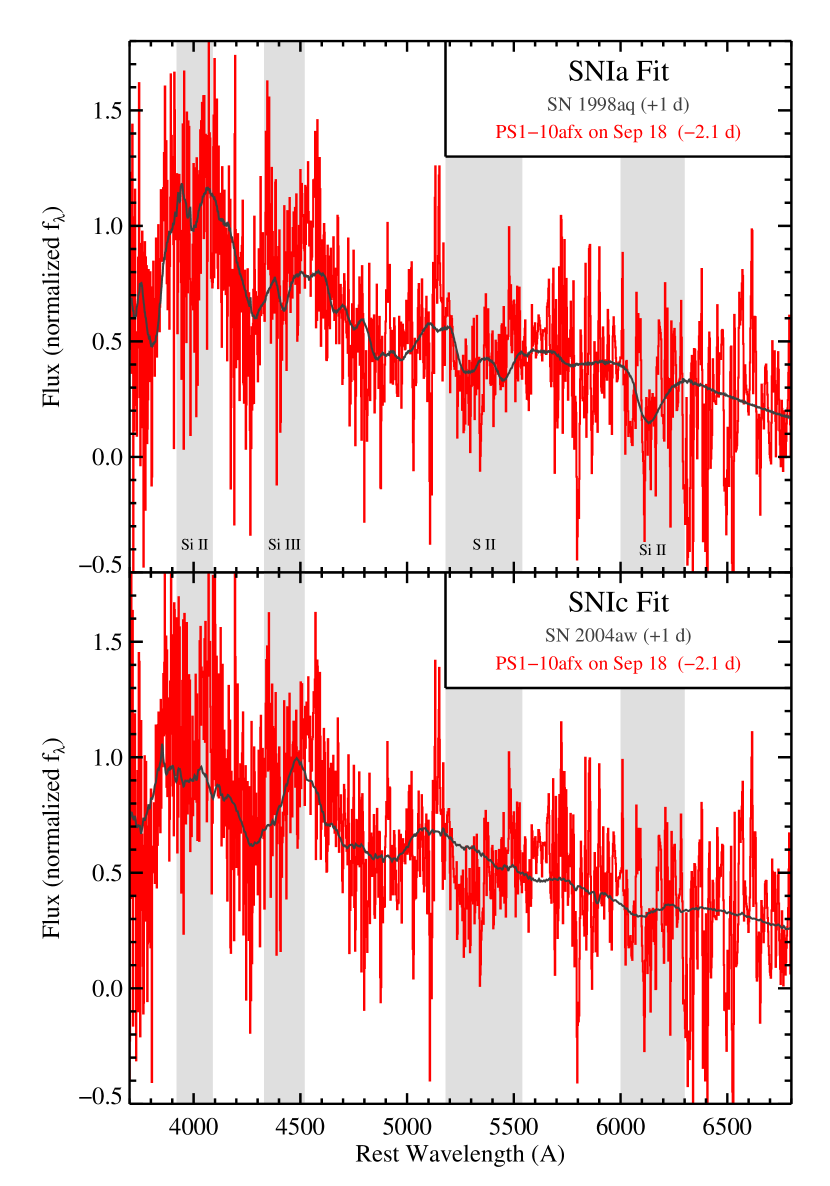
The (observer-frame) NIR spectrum taken on 2010 September 18 covers the rest-frame optical wavelength range over which the defining spectroscopic signatures of supernovae can be found. Using superfit we find that the spectrum is well matched by normal SNeIa such as 1998aq and 1998bu near maximum light (see figures 1 and 2). The top 5 matches have an average phase relative to B-band maximum of days. SNIc templates provide poorer quality fits and must be artificially de-reddened by large amounts (). Likewise, subluminous, SN 1991bg-like SNeIa cannot match the features or relatively blue continuum of PS1-10afx, although SN 1986G also yields an acceptable fit with . Matches to SNIa with more shallow silicon, such as 1999aa, are also allowed. Such fits favor less galaxy light contamination, which can wash out the Si II ‘6150’ feature. The Si II ‘5800’ feature falls in a strong telluric absorption band, so we cannot compute the pseudo-equivalent width ratio to definitively identify the SNIa subgroup to which PS1-10afx belongs.
Figure 2 emphasizes that several signatures of the SNIa class are present in this near maximum light spectrum of PS1-10afx. In addition to the Si II features, which define this class, there is a strong S II “W”, which is not seen in other supernova types.
We also used the spectral cross-correlation package, snid version 5.0 with version 2.0 of the templates to classify the spectra (Blondin & Tonry, 2007). Unlike superfit, snid is not able to correct for contaminating galaxy light and it ignores the overall continuum shape. The only acceptable matches (those with the quality-of-fit parameter ) are for SNIa templates. The best match is to the normal SNIa, 2008Z (), but some SN 1991T-like templates match as well (e.g. SN 1998es; ). The best-fitting SN 1991bg-like template is SN 1999by (), and the best-fitting SNIc template is SN 2004aw ().
Using superfit, we similarly find that the other three spectra are best fit by SNIa templates. The (observer-frame) optical spectrum obtained on 2010 September 26 and the (observer-frame) NIR spectrum obtained two days later are noisier than the first spectra, but they are each of sufficient quality to uniquely classify with superfit. Both of these spectra are again consistent with normal SNeIa. The fits show that below 2800 Å and above 6000 Å, most of the signal is from contaminating galaxy light, which would be consistent with the host SED fit in C13. Assigning this light instead to the transient, C13 disfavor classifying PS1-10afx as a SNIa.
To summarize, any of the four spectra presented in C13 can be used to classify PS1-10afx as a SNIa. The template fits set the redshift of the supernova at (to a typical precision of about ) independent of the host redshift. We thus securely conclude that PS1-10afx can be spectroscopically classified as a SNIa at a redshift consistent with its apparent host galaxy.
3. Photometric Classification
Spectroscopically normal SNeIa have similar light curves (e.g. Hicken et al., 2009; Ganeshalingam et al., 2010). In this section, we test whether PS1-10afx is photometrically consistent with normal SNeIa using the photometry from C13.
To predict the expected observer-frame magnitudes for a normal SNIa at a redshift of in each of the photometric bands employed, we use the spectral templates of Hsiao et al. (2007) and a flat, km s-1, cosmology. The templates represent the average from over a thousand individual observations of normal SNeIa. We adjust the pre-maximum template phases to have a rise time of 18 days, the average value for SNeIa with normal B-band declines over 15 days after peak, mag (Ganeshalingam et al., 2011).
Using mpfit.pro in IDL, we fit the Hsiao templates to the observed photometry (detections only) with three free parameters: the epoch of B-band maximum, a single “stretch” term, and a global flux scaling term. We first consider only the photometry from C13 measured after removal of quiescent light using PSF-matched templates taken with the same instruments and filters. These data include 24 detections in the , , , and bands over 19 rest-frame days. The best fit template has a /DoF of and indicates B-band maximum occurred on (see Fig. 3). From the stretched template we measure mag. This rules out SNeIa like 1999aa, which have 0.8 mag declines. For , the MLCS2k2 light-curve fitting package (Jha et al., 2007) predicts such SNeIa should have peak absolute magnitudes of . The observed magnitudes are mag brighter. C13 note that PS1-10afx is 3.8 magnitudes brighter than HST04Sas, a spectroscopically confirmed SNIa at (Riess et al., 2007).
The Hsiao template fit also suggests a rise to B-band maximum of 16 days, which is normal for SNeIa (e.g. Ganeshalingam et al., 2011); however, prior to the first detection, there is a (rest-frame 3160 Å) limit 0.5 mag below the template prediction. We attribute this to a problem in the template. Brown et al. (2012) have shown that the UV light curves of SNeIa do not rise as smoothly as the templates assume. Rather, there is a rapid rise in flux near the epoch in question. The Hsiao templates over predict the UV flux at earlier phases. Brown et al. (2012) demonstrate that fitting a “fireball” () model to UV observations of SN 2011fe near and after this phase will underestimate the true rise time; this would explain the faster rise favored by C13.
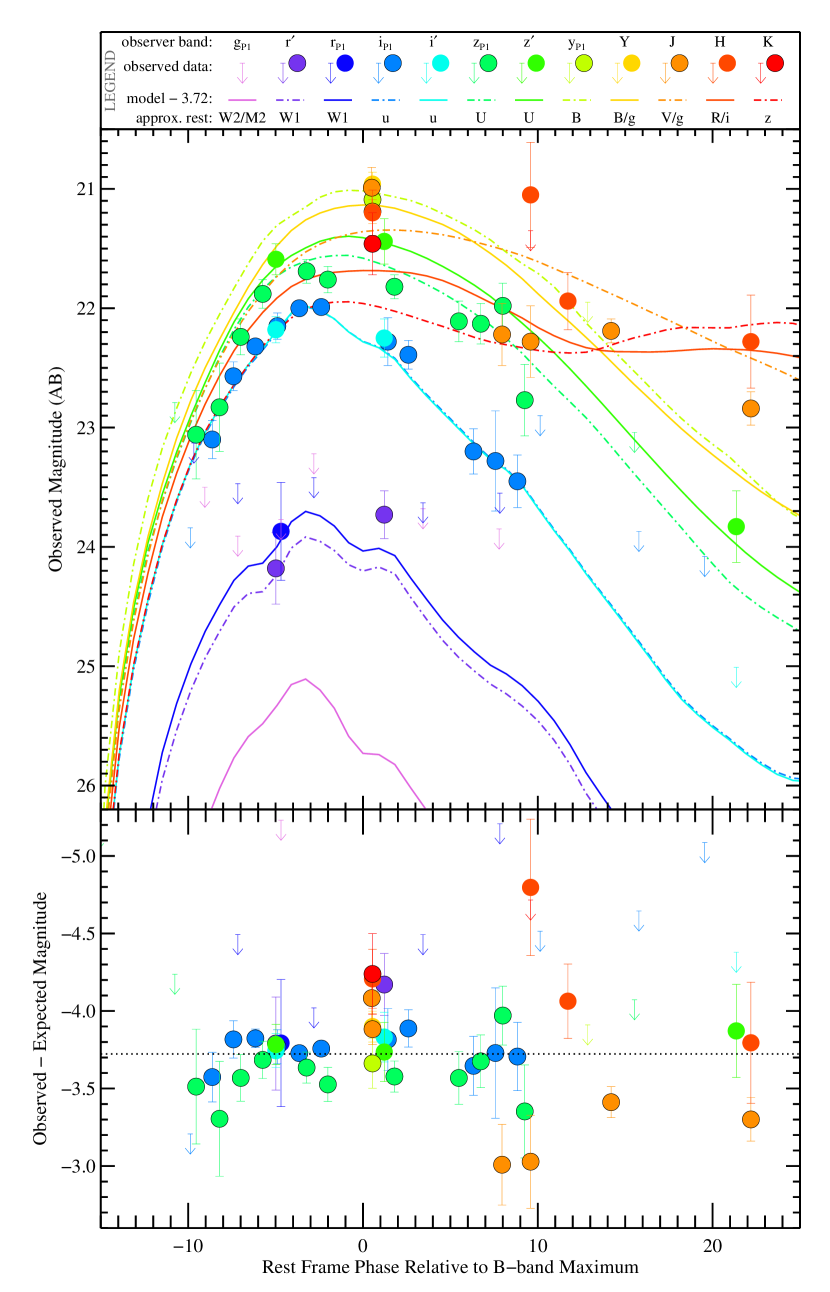
The remaining photometry from C13, based on cross instrument measurements, is also shown in figure 3. C13 point out that their measurements near maximum light are 0.2 mag brighter than their data from similar phases, but the and measurements appear consistent with the and bands, respectively. They do not, however, discuss systematic offsets between the four different instruments employed for the NIR photometry, or how cross filter differences may vary with time as the spectra of PS1-10afx evolve (i.e. the mag offset between the bands is expected for a SNIa near maximum, but the difference increases to 0.4 mag on day ). Some of the NIR measurements have the host light removed not through PSF-matched image subtraction, but numerically. It is not clear if the supernova light was measured in the same 1.7″ radius aperture as the host photometry, or how C13 may have accounted for systematic differences between the measurements, but some of the J-band measurements of PS1-10afx have errors in flux that are smaller than the host’s error. Including the NIR measurements, the /DoF for the template fit increases to 2.0, but allowing for a small systematic error (0.1 mag) results in a good fit (/DoF = 1.2).
From the overall excellent agreement in the spectra, light-curve shapes, and colors predicted from the SNIa templates, we conclude that PS1-10afx is a normal SNIa. The well established physical models for SNeIa suggest that the observed flux excess is not intrinsic to the supernova itself; rather, PS1-10afx has been magnified by an external source.
4. Source of the Magnification
As a normal SNIa, we can calculate the actual luminosity of PS1-10afx and compare this to its inferred luminosity to derive the signal magnification. This results in a magnification factor of assuming a SNeIa dispersion of mag after correction. The only astrophysical object capable of such large, achromatic signal magnification is a gravitational lens. In this section, we consider the possible lensing scenarios that may explain the anomalous properties of PS1-10afx.
Massive galaxy clusters are perhaps the best known sources of strong gravitational lensing. C13 point out that there is no evidence for such a cluster in the Pan-STARRS1 data. A red sequence cluster finder (Finoguenov et al., 2010) also shows no evidence for a massive cluster in the deeper CFHT images (Gwyn, 2008). With a galaxy cluster lens, we would also expect strong distortion of the host into an arc (or arcs). We thus conclude that PS1-10afx is not lensed by a galaxy cluster.
Moving to small scales, we next consider micro-lensing events. It is possible for a massive source in our Galaxy to greatly magnify light from a background source, but the peculiar motion of the lens across the plane of the sky requires the magnification factor to vary with time. The magnification of typical micro-lensing events varies by a factor of a few over 20 day periods (e.g. Besla et al., 2013), whereas PS1-10afx appears consistent with a constant magnification over at least 2 months.
Individual galaxies may magnify supernovae as well (see Mörtsell et al., 2001; Oguri & Marshall, 2010). There is a galaxy to the south east with (Ilbert et al., 2006), but the separation, about 8″, is far too large for this to be a viable lensing candidate. Alternatively, the lensing galaxy could be directly in front of, and thus confused with the host. In this case, the lensing galaxy must be faint or physically compact to be compatible with the available imaging. The lensing galaxy also cannot have much dust nor can it harbor an optically luminous AGN as the photometry of PS1-10afx do not indicate reddening, and the spectra do not show emission lines aside from the nebular lines in the SN rest-frame. These constraints may allow for a compact red galaxy as the lens, and the light from this object may dominate the true host galaxy’s NIR emission.
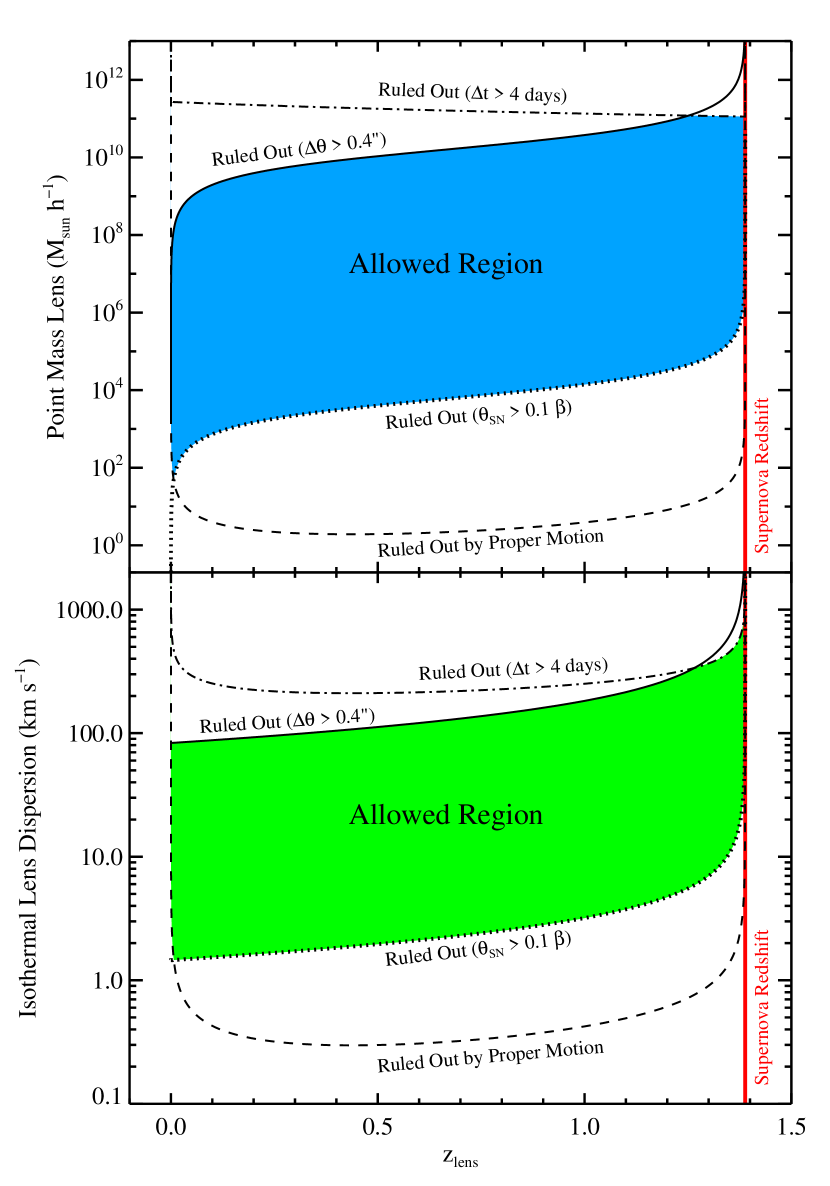
The apparent lack of obvious, luminous material at the lens redshift could suggest the lens is a dark matter halo with little baryonic material, such as the compact red galaxy noted above, or an isolated, supermassive black hole. Figure 4 depicts plausible lens parameters for a point mass and for an isothermal body that meet the following criteria.
We require a large magnification, so the supernova can only be slightly misaligned from the lensing object with an Einstein radius, , by an angle, . For a point mass we have
| (1) |
where , and are the angular diameter distance between the lens and the source, between us and the lens and between us and the source, respectively. For an isothermal body,
| (2) |
where is the velocity dispersion. The angular separation between the two images is given by . PS1-10afx is apparently unresolved in the Pan-STARRS1 images, so we adopt ″. For the point mass, the sum of the magnifications of the two images is given by
| (3) |
with . Setting , we find that . For the isothermal body,
| (4) |
and thus .
The angular size of PS1-10afx’s photosphere must be smaller than the misalignment angle (i.e. ) to avoid changes in the effective magnification over time. Also, the angle by which the lens moves with respect to PS1-10afx during the two months of observations cannot be large or, like the micro-lensing examples cited above, the magnification would vary. These constraints are also depicted in figure 4. In addition, the light curve fit from §3 suggests that the time delay, , between images is small (we further note a lack of evidence for mircolensing distortions; Dobler & Keeton 2006).
5. Conclusions and Discussion
PS1-10afx is a Type Ia supernova. This is strictly true since the spectra of PS1-10afx show strong Si II features and no hydrogen, which are the defining characteristics of the SNIa class. In addition, normal SNeIa can explain the light-curve shape and broad band colors, as well as the phase of the spectra with respect to the photometric B-band maximum light epoch while other varieties of supernovae are incompatible with these observations. However, we find that the flux measurements for PS1-10afx are systematically 30 times brighter than can be explained by a SNIa with the observed light-curve shape. At a minimum, this shows that some SNeIa, which otherwise appear perfectly normal, can have fluxes greatly exceeding the well known luminosity to light-curve width relation, which is fundamental to the use of SNeIa as cosmological probes.
We next consider the physical origin of PS1-10afx’s apparently anomalous flux. We argue that this cannot be representative of the intrinsic luminosity of the supernova based on physical grounds. The spectra of SNeIa have been extensively modeled and are found to be the results of thermonuclear explosions consuming carbon and oxygen to produce intermediate mass elements and iron peak elements including, most importantly, 56Ni, which radioactively decays to provide the input power for the light curve. C13 have already pointed out that 56Ni cannot produce both a luminosity of a few erg s-1 as well as the 2-week time scale rise and fall of PS1-10afx: the mass of 56Ni required would exceed the allowed ejecta mass, which largely determines the light-curve time scale. PS1-10afx can thus not have both the spectroscopic features observed, which imply a thermonuclear origin, and an intrinsically high peak luminosity, which would require more complete thermonuclear burning than the light curves can accommodate. We conclude that PS1-10afx is a normal SNIa with a normal luminosity and that the anomalously bright flux observed is a result of factors external to the supernova.
The only known astrophysical scenario for achromatically magnifying the flux of an object is a gravitational lens. We have presented the physical constraints on a point mass lens and an isothermal lens based on geometrical considerations and the observed magnification factor. It should be noted that this magnification is independent of the existence of the supernova; it applied and still applies to the host environment of PS1-10afx.
This prediction of a persistent lensing source provides a test of our hypothesis. High spatial resolution images from HST may be able to resolve the Einstein ring from the magnified host galaxy. If the lens is a compact red galaxy then color information should distinguish it from the blue, star-forming galaxy in the background. If a foreground galaxy is not detected, then this would either suggest that more exotic lensing systems, such as free floating black holes, are required or it could support the hypothesis of C13 that a new class of superluminous supernovae is required to explain PS1-10afx.
New physics may not be needed, however, since known physical processes can already provide a satisfying explanation. Oguri & Marshall (2010) have predicted that 0.1 SNeIa strongly lensed into resolved pairs or quads should be found in the Pan-STARRS1 Medium Deep Survey. Revising this calculation to include SNeIa with unresolved images, we calculate 0.8 events are expected. It is thus statistically plausible for Pan-STARRS1 to have detected a gravitationally lensed SNIa as we have concluded. Due to Malmquist bias in the selection of candidates, objects with larger magnifications are more likely to be detected and followed up. Monte Carlo simulations (following Oguri & Marshall 2010) show that magnification factors of 20 are expected from strong lenses in the flux-limited Pan-STARRS1 sample even though there are many more SNeIa with lower magnifications in a given volume. Such highly lensed SNeIa may impose a larger systematic error in future, high precision cosmological measurements than previously thought (e.g. Holz & Linder, 2005).
A larger “milli-lensing” sample may give some insight into the distribution of these lensing systems. For example, such observations can be used to obtain constraints on the number of dark subhalos around galaxies that have been speculated to exist (Simon & Geha, 2007). Sources at larger redshifts (e.g. ) have a substantially larger optical depth to foreground lenses and are thus much more likely to be lensed. We speculate that other flux limited samples of transient objects may already be contaminated with lensed events. In particular, some of the massive, red galaxies coincident with “dark” gamma-ray bursts may be foreground lenses to even higher redshift events (Perley et al., 2013).
It may become increasingly common to find lensed transients like PS1-10afx as next generation optical transient surveys with the Dark Energy Camera, the Hyper-Suprime Camera, and the Large Synoptic Survey Telescope, begin deep, wide-area surveys. Such discoveries may be exploited to probe the expansion of our universe (e.g. Oguri & Kawano, 2003; Linder, 2011), or as tests of gravity (e.g. Smith, 2009).
References
- Besla et al. (2013) Besla, G., Hernquist, L., & Loeb, A. 2013, MNRAS, 428, 2342
- Blondin & Tonry (2007) Blondin, S. & Tonry, J. L. 2007, ApJ, 666, 1024
- Bloom et al. (2012) Bloom, J. S., Kasen, D., Shen, K. J., et al. 2012, ApJ, 744, L17
- Brown et al. (2012) Brown, P. J., Dawson, K. S., de Pasquale, M., et al. 2012, ApJ, 753, 22
- Chornock et al. (2013) Chornock, R., Berger, E., Rest, A., et al. 2013, arXiv:1302.0009
- Dobler & Keeton (2006) Dobler, G. & Keeton, C. R. 2006, ApJ, 653, 1391
- Filippenko (1997) Filippenko, A. V. 1997, ARA&A, 35, 309
- Finoguenov et al. (2010) Finoguenov, A., Watson, M. G., Tanaka, M., et al. 2010, MNRAS, 403, 2063
- Gal-Yam (2012) Gal-Yam, A. 2012, Science, 337, 927
- Ganeshalingam et al. (2011) Ganeshalingam, M., Li, W., & Filippenko, A. V. 2011, MNRAS, 416, 2607
- Ganeshalingam et al. (2010) Ganeshalingam, M., Li, W., Filippenko, A. V., et al. 2010, ApJS, 190, 418
- Gwyn (2008) Gwyn, S. D. J. 2008, PASP, 120, 212
- Hicken et al. (2009) Hicken, M., Challis, P., Jha, S., et al. 2009, ApJ, 700, 331
- Holz & Linder (2005) Holz, D. E. & Linder, E. V. 2005, ApJ, 631, 678
- Howell (2011) Howell, D. A. 2011, Nature Communications, 2
- Howell et al. (2005) Howell, D. A., Sullivan, M., Perrett, K., et al. 2005, ApJ, 634, 1190
- Hsiao et al. (2007) Hsiao, E. Y., Conley, A., Howell, D. A., et al. 2007, ApJ, 663, 1187
- Ilbert et al. (2006) Ilbert, O., Arnouts, S., McCracken, H. J., et al. 2006, A&A, 457, 841
- Jha et al. (2007) Jha, S., Riess, A. G., & Kirshner, R. P. 2007, ApJ, 659, 122
- Kaiser et al. (2010) Kaiser, N., Burgett, W., Chambers, K., et al. 2010, in Society of Photo-Optical Instrumentation Engineers (SPIE) Conference Series, Vol. 7733, Society of Photo-Optical Instrumentation Engineers (SPIE) Conference Series
- Kasen & Woosley (2007) Kasen, D. & Woosley, S. E. 2007, ApJ, 656, 661
- Linder (2011) Linder, E. V. 2011, Phys. Rev. D, 84, 123529
- Mörtsell et al. (2001) Mörtsell, E., Gunnarsson, C., & Goobar, A. 2001, ApJ, 561, 106
- Nugent et al. (2011) Nugent, P. E., Sullivan, M., Cenko, S. B., et al. 2011, Nature, 480, 344
- Oguri & Kawano (2003) Oguri, M. & Kawano, Y. 2003, MNRAS, 338, L25
- Oguri & Marshall (2010) Oguri, M. & Marshall, P. J. 2010, MNRAS, 405, 2579
- Perley et al. (2013) Perley, D. A., Levan, A. J., Tanvir, N. R., et al. 2013, arXiv:1301.5903
- Perlmutter et al. (1999) Perlmutter, S., Aldering, G., Goldhaber, G., et al. 1999, ApJ, 517, 565
- Phillips (1993) Phillips, M. M. 1993, ApJ, 413, L105
- Riess et al. (1998) Riess, A. G., Filippenko, A. V., Challis, P., et al. 1998, AJ, 116, 1009
- Riess et al. (2007) Riess, A. G., Strolger, L.-G., Casertano, S., et al. 2007, ApJ, 659, 98
- Simon & Geha (2007) Simon, J. D. & Geha, M. 2007, ApJ, 670, 313
- Smith (2009) Smith, T. L. 2009, arXiv:0907.4829
- Wheeler & Harkness (1990) Wheeler, J. C. & Harkness, R. P. 1990, Reports on Progress in Physics, 53, 1467
- Yasuda & Fukugita (2010) Yasuda, N. & Fukugita, M. 2010, AJ, 139, 39