Dual view FIDA measurements on MAST
Abstract
A Fast Ion Deuterium Alpha (FIDA) spectrometer was installed on MAST to measure radially resolved information about the fast ion density and its distribution in energy and pitch angle. Toroidally and vertically-directed collection lenses are employed, to detect both passing and trapped particle dynamics, and reference views are installed to subtract the background. This background is found to contain a substantial amount of passive FIDA emission driven by edge neutrals, and to depend delicately on viewing geometry. Results are compared with theoretical expectations based on the codes NUBEAM (for fast ion distributions) and FIDASIM. Calibrating via the measured beam emission peaks, the toroidal FIDA signal profile agrees with classical simulations in MHD quiescent discharges where the neutron rate is also classical. Long-lived modes (LLM) and chirping modes decrease the core FIDA signal significantly, and the profile can be matched closely to simulations using anomalous diffusive transport; a spatially uniform diffusion coefficient is sufficient for chirping modes, while a core localized diffusion is better for a LLM. Analysis of a discharge with chirping mode activity shows a dramatic drop in the core FIDA signal and rapid increase in the edge passive signal at the onset of the burst indicating a very rapid redistribution towards the edge. Vertical viewing measurements show a discrepancy with simulations at higher Doppler shifts when the neutron rate is classical, which, combined with the fact that the toroidal signals agree, means that the difference must be occurring for pitch angles near the trapped-passing boundary. Further evidence of an anomalous transport mechanism for these particles is provided by the fact that an increase of beam power does not increase the higher energy vertical FIDA signals, while the toroidal signals do increase.
pacs:
52.20.Dq, 52.25.Xz, 52.55.Fa, 52.55.Pi, 52.70.Kz,I Introduction
The physics of fast ions is of particular importance from the point of view of fundamental understanding for predicting the performance of burning plasmas, as well as making correct interpretation of data on present day plasma experiments where energetic ions play a role such as in neutral beam heating and ion cyclotron resonance heating. The classical collisional slowing down process [1, 2] is the primary effect required to describe the fast ion distribution function. However, instabilities can also alter the distribution function. Large fast-ion transport by fishbones [3], toroidal Alfvén eigenmodes (TAEs) [4], and neoclassical tearing modes (NTMs) [5] have been measured; other modes that could modify the distribution function include magnetic micro-turbulence [6], the ideal infernal mode [7], and compressional Alfvén eigenmodes (CAEs) [8]. Because the magnetic field is low in spherical tokamaks, injected fast ions are super-Alfvénic so, during the slowing down process, many resonances that can cause transport can occur. For example, in MAST, the toroidal transit frequency of full-energy beam ions is kHz, while the TAE frequency is kHz and the fishbone frequency is even lower (kHz). Four mechanisms of resonant fast-ion transport have been identified [9]. With global modes such as the fishbone, phase-locked convective transport occurs when the particles stay in phase with the wave as they steadily march out of the machine [10]. Losses can also occur when the wave-particle interaction causes a change in orbit topology and places the fast ion onto an unconfined banana orbit [11]. In the presence of many small-amplitude resonances, diffusive transport occurs [12]. A fourth type of transport is analogous to the collapse of a sandpile avalanche, where steepening of the profile by one mode causes progressive destabilization of modes at other spatial locations [13]. In addition to these resonant processes, the orbits of sufficiently energetic fast ions can become stochastic in the presence of a large helical field perturbation introduced by an NTM or infernal mode [14, 15]. Recent experiments have also demonstrated that, in the presence of loss boundaries, non-resonant interactions of fast ions with Alfvén eigenmodes can cause substantial losses [16]. For all of these processes, the effect on the distribution function ultimately depends on the amplitudes of the instabilities. The nonlinear processes that determine these amplitudes are difficult to model accurately, so experiments are necessary to evaluate which processes are most important.
The Mega-Amp Spherical Tokamak features two neutral beam injectors (NBIs) of up to 75keV energy and 2.5MW each [17]. These injectors are separated toroidally by and are labelled SS and SW. A variety of fast ion driven MHD such as fishbones [7] and TAEs [18] has been reported based on magnetic measurements. Fast ion diagnostics have included a compact neutral particle analyzer (CNPA) and a main NPA [19]. The main absolutely-calibrated diagnostic is the fission chamber [20]. It has been shown [21] that the measured neutron rate is lower than the rate expected based on collisional classical slowing down, particularly at higher power. The measured neutron rate also drops after fishbone activity. A counter-viewing bolometer is sensitive to lost fast ions and shows spikes during fishbone events [7]. Transport studies [22, 23] have also been hampered by accuracy of the ion power source due to fast ion slowing down. Using the NUBEAM code [24], anomalous fast ion diffusion can be introduced into the modelling. There are many possible ways to include this, as the spatial and energy dependencies can be varied and convection may also be included. In [22], using an anomalous diffusion of reduced the predicted neutron rate to the measured value, while other parameterisations which maintain the stored energy and Shafranov shift (which depend on fast ion pressure) result in a negative thermal conductivity, indicating the need for improved fast ion diagnostics to support transport analysis. The neutron rate, EFIT [25] derived stored energy and Shafranov shift are somewhat blunt instruments in the sense that they are not local quantities. The MSE-constrained EFIT-derived total pressure, which includes a fast ion component, is unreliable as it often depends on the data weights. In future, the use of Bayesian methods may provide a reliability check on the equilibrium derived pressure [26], but for now better quantification of the fast ion losses through profile measurements is essential and has led to the recent development of the FIDA diagnostic as well as a neutron camera system [27]. Complementary analysis of all these fast ion diagnostics will improve understanding of the fast ion physics as different diagnostics have different degrees of sensitivity in energy/pitch and real space [28].
The fast ion (FIDA) spectroscopy technique [9] is an appealing way to diagnose local and energy-resolved information about the fast ion distribution function, which is essential to measure spatial redistribution, where spatially-integrated measurements such as a fission chamber neutron counter are less sensitive. The first application of a charge exchange diagnostic to infer details of the fast ion distribution used He spectroscopy on JET [29], while the first true FIDA experiments were carried out on DIII-D [30]. Since then the technique has been applied to various machines [31, 32, 33, 34, 35]. Modelling of FIDA signals has advanced over the years with the development of the FIDASIM code [36]. In many machines, FIDA measurements have been made by re-configuring the CXRS optics. Pilot experiments to test the FIDA concept on MAST were carried out during late 2009 using both the main CXRS system in MAST [37], as well as an auxiliary high resolution spectrometer and fibres dedicated for MSE [38]. The results were encouraging but not of high quality because of the presence of a very bright emission peak and the lack of flexibility of the CXRS spectrometer. The FIDA system described here was therefore installed in 2010.
The purpose of this paper is to describe in detail the instrument on MAST, as well as to show preliminary results demonstrating the potential of the diagnostic to provide new information about the fast ion distribution.
This paper is organized as follows. In section II, the FIDA installation on MAST, including sight lines and spectrometer, is described. In Section III, calibration and validation are considered (essential to properly understand whether the fast ion signal obeys a classical distribution) and the reliability of the different background subtraction methods is compared. In section IV, simulations are described which are used for comparison with measurements in section V. Results are analysed in an MHD quiescent, ‘classical’ discharge, for both the toroidal (passing) and vertical (near the trapped/passing boundary) signals. The toroidal signals are analyzed in a discharge with a steady LLM, and a discharge with chirping mode activity, including a comparison of the time history to ‘limit cycle’ behaviour.
II Diagnostic setup
II.1 Sight lines
Owing to limited port access it was decided to utilize the CXRS viewing optics [37], as these already include toroidal (tangential) and vertical (perpendicular) viewing fibres for toroidal and poloidal rotation measurements. Also, the toroidal views have an approximately vertical tilt which makes the sight lines pass mostly through a single beam rather than both beams, thereby allowing better spatial localization. For the toroidal views, a reference view is installed around from the closest beam in order to subtract bremsstrahlung and passive FIDA components. The toroidal views are shown in Figure (1a). FIDA was combined with the CXRS system by adding a second row of fibres to the collection lens, such that the imaged spots on the beam (approximately 1.5cm diameter) from backlighting the CXRS and FIDA fibres were coincident with one another. In addition, to provide contingency against toroidal asymmetries in the background emission (which can arise from gas puffing, for example [39, 31]), additional chords were installed which view approximately the same radius as the beam viewing chords but are vertically displaced. This was achieved by having a third row of fibres inserted into the active viewing lens, to collect light from 25cm above or below the beam (depending on rotation of the lens assembly). There are 32 chords available on the active view from and 32 chords on each of the toroidally and vertically-displaced reference views. While the CXRS system has views on both SS and SW beams, FIDA views were only installed on a single beam. The sight lines were interchanged between different beams during the MAST M8 experimental campaign. The vertically-displaced reference views are placed on the side of the beam which passes though a greater path length of plasma and a similar flux coordinate at the edge, to ensure that the background component is similar on active and reference views.
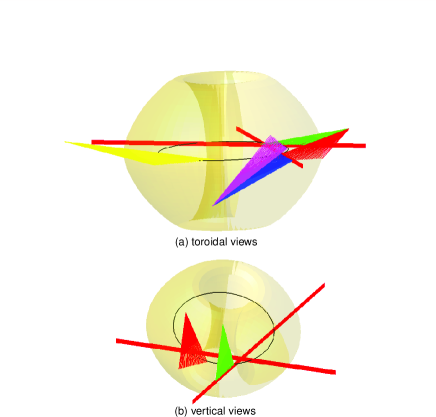
Vertical views were also installed. Direct vertical viewing access is difficult in MAST because of the divertor plates. Previously, the CXRS installation [37, 40] was such that there were 4 vertical views - internally mounted lens coupled fibres directed to an optical vacuum feed through - consisting of a pair of terminated 8x8 fibre arrays on either side of a window, together with imaging optics. There were in total an active and reference view on both the SS and SW beams. However, the CXRS spectrometer could only utilize one beam at a time. This gave the opportunity of utilizing the unused views for FIDA. New fibres were installed to take light from the internal SS beam-viewing active and reference fibre bundles to a patch panel, and from there to the spectrometer. The active viewing lenses were relocated such that each chord passed through the centreline of the beam. The reference view was relocated toroidally by around such that it avoided both the SS and SW beams. The achieved geometry is shown in Figure (1b). There are 32 active and 32 reference vertical fibres spanning a region from 1.0-1.3m, limited on the inner and outer sides by vertical and resonant magnetic perturbation field coils respectively.
II.2 Response functions and spectral shape
The viewing direction defines the range of pitch angles in the distribution function to which the diagnostic is sensitive, according to the algebra given in the appendix of [28]. It can be shown that the maximum possible Doppler shift from a reneutralized fast ion gyrating with energy and pitch parameter is given by [41]
| (1) |
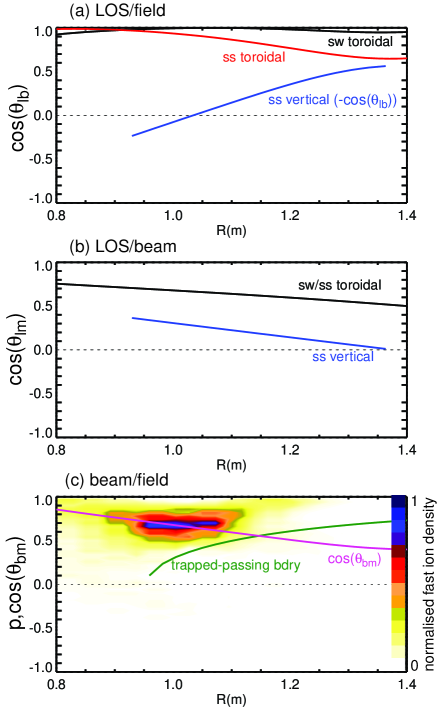
where with and being the unshifted and Doppler shifted wavelengths respectively, and is the angle between the line of sight and the magnetic field . It can furthermore be shown that is the pitch parameter at which E is minimised, however most of the signal has contributions from higher energies at different pitch angles. The spatial profiles of are given in Figure (2a), for all the possible active views (SS/SW toroidal and SS vertical). The SW toroidal view, as it is inclined upward, is almost entirely tangential to the field; the SS toroidal view is inclined downward, resulting in lower values of . The SS vertical view is completely perpendicular to the field near the magnetic axis (m) having , rising up to near the edge (the negative sign used because the relevant spectral region is blue shifted). Therefore, towards the core, there is a roughly equal distribution of blue and red-shifted light, while towards the edge there is more blue shift.
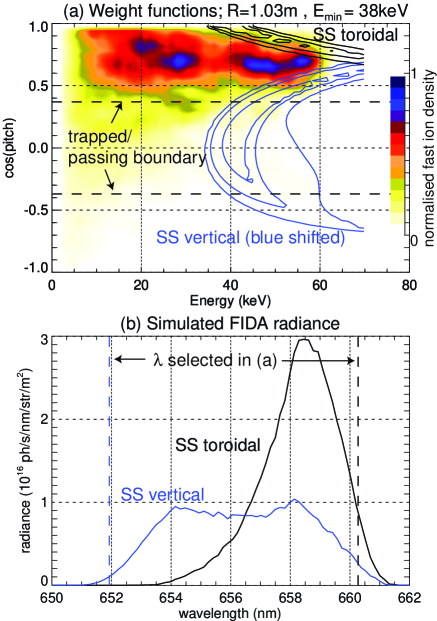
The energy and pitch parameter resolved weight functions for the toroidal and vertical views, overlaid on a representative NUBEAM-computed fast ion distribution function at m are plotted in Figure (3a). The dashed line indicates the trapped/passing boundary. The toroidal views are more sensitive to passing particles while the vertical views are more sensitive to the trapped particles, however it is evident that at higher energies, there are no trapped particles. Most of the signal from the vertical views at higher Doppler shifts therefore arises due to particles near the trapped/passing boundary. This fact is particularly important when considering the results presented in Section (V.2), which indicate that there is a deficit in the vertical signal at higher Doppler shifts but not in the horizontal signal. It is also worth noting that the weight function is only non-zero for as described above, and that this shifts up or down depending on the Doppler shift . For these views, the simulated FIDA signals are shown in Figure (3b). Because of the co-injected beams, the toroidal FIDA signal is completely red shifted.
In addition to FIDA, there are beam emission components at full, half, and one-third injection energy (from molecular deuterium in the accelerator). The factor , where is angle between the line of sight and the injected neutral beam , which determines the wavelength of the beam emission components, is plotted in Figure (2b). An optimum FIDA view would have everywhere, so that the beam emission is at the same wavelength as the background light, and having a larger wavelength range containing fast ion information [30]. This is the case for the SS vertical views near the edge, but towards the core increases (because the lens is mounted near the edge). Beam emission in the toroidal views has a larger Doppler shift, with near the innermost radius of 0.8m, thereby overlapping strongly over the FIDA signal, however sufficient uncontaminated windows remain that a FIDA signal may still be observed (see Section II.5).
Finally, the factor , where is the angle between the magnetic field and the injected neutrals, defines the pitch parameter at birth of the fast ions. This is plotted as a function of radius in Figure (2c). Comparison with the resolved TRANSP-calculated fast ion distribution for energies above 30keV shows that the distribution is dominated by particles around the magnetic axis (m); completely passing particles are born near beam tangency (0.7-0.8m) inboard from the magnetic axis, and these follow trajectories outboard from the magnetic axis to produce a peak in the passing particle population at m.
II.3 Spectrometer/CCD
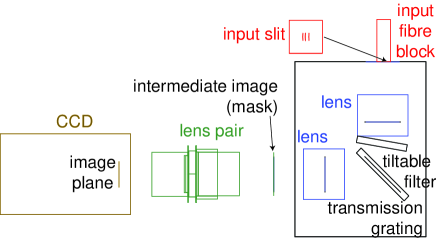
The spectrometer system resembles closely the system installed on NSTX [34]. The system installed on MAST is shown in Figure (4). A Holospec f/1.8 f=85mm transmission grating spectrometer [42] is used which matches optimally to the numerical aperture of the optical fibres. Instead of a CCD at the output of the spectrometer, a second relay lens system is incorporated which allows access to the intermediate image for blocking unwanted bright spectral components. The second lens system enables demagnification via a 85mm/50mm (Nikon f/1.8 / Nikon f/1.2) lens pair. A conventional 2155 lines/mm grating is used (CWL: 653nm) which features a modest dispersion of 6nm/mm, giving a trade-off between wavelength coverage and spectral resolution. An EMCCD is utilized on the output, model Cascade 128+ from Photometrics. This features a very fast readout rate of up to 3.3kHz (when binned over 12 vertical channels), and vertical transfers of 80ns/row to minimise frame transfer smearing. As the efficiency of the system is high, a typical FIDA spectral radiance of should theoretically give around 900 photo-electrons per pixel per 0.3ms time interval, which, with the use of EM gain to mitigate read noise, should give a SNR of around 30. Additional losses have however been discovered, as outlined in Section III.1. One disadvantage of this CCD is that the chip size is somewhat small () compared with other instruments based on the same spectrometer (e.g. [34], which utilizes an chip). The disadvantage of this is that fewer channels can be accommodated (2 columns of 12 fibres), and wavelength range is reduced to 20nm total for both columns versus about 50nm for the 8mm chip. According to Figure (3b), the minimum required spectral band is approximately 650nm-662nm plus extra for measuring the bremsstrahlung background. As the dimensions of the chip are insufficient to accommodate the required wavelength range, it was decided to use filters with reduced spectral bands of 6nm FWHM, spanning 649nm-655nm for the vertical channels (ignoring red-shifted components) and 657-663nm for the toroidal channels. As such, blue-shifted vertical and red-shifted horizontal views cannot be simultaneously measured. As this is desirable, a third column of fibres was put in, and a filter used to pass the entire 14nm FWHM region from 649-663nm (including the unshifted peak). The input focal plane consists of a block with three columns of 12 fibres, on a curved radius to cancel the vertical wavelength dispersion. The intention is that only two columns are used at any one time, the closer pair being used for the 6nm FWHM bandpass filters and the further-apart pair used for the 14nm FHWM filter. A translation stage permits the CCD and final image plane to be translated with respect to the intermediate image plane to adjust the wavelength region from the red filter band to the blue filter band. Fixed, blackened slits of widths 50, 100 and 200 are available, giving spectral resolutions of 0.3, 0.6 and 1.2nm respectively (however lens aberrations create additional ‘wings’ to the instrument function). The narrowest option is used for the toroidal views where the beam emission contaminates the FIDA, while wider options are used for the vertical views. The filter is mounted inside the spectrometer between the first lens and the grating, via a tiltable filter holder. Because the unshifted light is known to be several orders of magnitude brighter than the FIDA emission, it is imperative to make efforts to avoid contamination of the FIDA signal. Accordingly, the red and blue filters have transmisson at 656.1nm [43], increasing to 0.7nm away (with peak transmission ). After the filter, the unshifted is measured to be only about as bright as the beam emission components. With such a bright line in the wing of the filter, back reflections off the filter may reflect back off the slit mask area and pass though the filter at a steeper angle, where the blue shift arising due to the tilt may cause the light to pass though producing a contaminant line. The filters were therefore inserted at an angle of a few degrees to the optical axis in order that the back reflection effectively be off the side of the chip, and that the back reflection hits the blackened area of the slit and avoids the other fibre columns.
The next problem that can arise is due to frame transfer smearing. Although this is small (as the total frame shift time into the readout area is only ), the beam emission peaks in the toroidal channels may smear into neighboring channels which contain only FIDA and are naturally free from other contaminant lines. This is often a problem since the beam emission is about 2 orders of magnitude brighter than the FIDA emission, giving a smeared signal comparable to, but somewhat less than, the FIDA emission. To mitigate this, a mask can be inserted at the intermediate image plane with ’blocking bars’ for the beam emission components. Alternatives include the use of a FLC shutter as well as longer integration times. In this respect, utilizing a smaller CCD gives shorter row transfer times, reducing smearing when the integration time is not set by the maximum rate of the camera.
II.4 Patching layout
While the diagnostic can only accommodate 24 fibres simultaneously, there are 160 fibres available to be patched. Given that at any one time the system is only imaging either toroidal channels or vertical channels, there are available 32 active and 32 reference fibres for the 24 spectrometer channels, each one with a spatial resolution of cm. Therefore, generally, every 3rd fibre is patched in the system. Because of the finite lifetime of the excited state, the intrinsic spatial localization of the emission is around 2cm (though with broader tails). The Larmor radius for the fastest ions is which limits the minimum possible scale length of the fast ion distribution. Patching neighboring channels would not therefore allow sharper gradients to be measured. Because the most complete information about the fast ion distribution is obtained when data are available from both horizontal and vertical views, it is necessary to run identical discharges with the system using the red and blue shifted filters on alternate shots. This was achieved for a limited set of shots during the M8 campaign.
II.5 Measured spectra
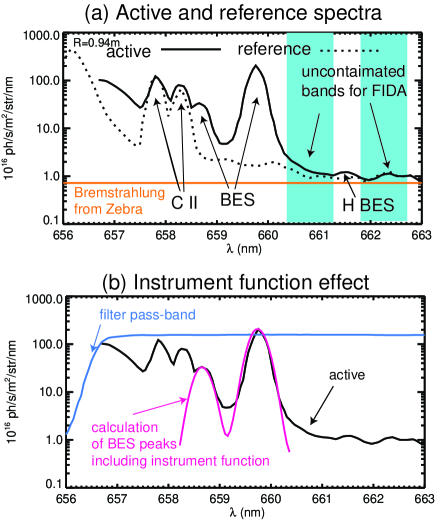
Measured active and reference spectra for an inner channel of the toroidal view are plotted in Figure (5). The spectra have been calibrated as described in the next section. The notable features of the active spectrum include the BES peaks, including a small amount at times the primary Doppler shift from hydrogen in the beam, C II impurity lines at 657.7nm and 658.3nm, and the unshifted component at 656.1nm. Both spectra are elevated by an amount very similar to that expected from bremsstrahlung considering from the Zebra diagnostic and the difference of the measured wavelength region (nm instead of nm) [44].
The differences between the active and reference spectra include the FIDA emission, which should have a spectrum as shown in Figure (3b), as well as the primary and hydrogen beam emission spectrum (BES). The brightest contaminant is the unshifted . The filter bandpass, over-plotted in (b), indicates how much the edge and lower energy halo components are attenuated. The FIDA radiance is of order . The edge , which should be about 10,000 times as bright as the FIDA signal, is attenuated by the filter such that it is comparable in magnitude to the beam emission peaks. The carbon impurity lines are much brighter than the FIDA emission. Consequently, small errors in the background subtraction lead to large errors in the FIDA such that these wavelengths must be rejected. One interesting feature is that the passive spectrum is not flat as one would expect if it were dominated only by impurity lines and bremsstrahlung; rather, it has a spectral shape in the region of 660nm which greatly resembles that of the active FIDA signal as shown in Figure (3b). This wing indicates the presence of passive FIDA driven by charge exchange between fast ions and neutrals penetrating from the edge. The magnitude can be as large as the active FIDA signal, and is examined in more detail in Section (III.3).
In Figure (5b), the active spectrum is compared with the synthesized beam emission spectrum considering the measured instrument function width. It is clear that the width of the BES peaks is completely dominated by the instrument function. When plotted on a log scale, the spectral width of the beam emission is approximately 0.75nm at the width level, while the theoretical instrument resolution is only 0.2nm. The reason for the larger width is the presence of ’wings’ in the point spread function of the imaging lenses, particularly given that they operate at a low f-number (f/1.2). Because the beam emission is approximately 50 times brighter than the FIDA + background emission, this eliminates approximately 0.8nm of bandwidth from the usable spectrum. The signal between the primary and secondary beam emission peaks is a little higher than the predicted ‘wings’, which may be due to FIDA emission, but it is very difficult to isolate. Thus only wavelengths higher than the beam emission peak are taken.
The H BES peak is very weak compared with the main BES peak, and can vary depending on the the degree of getter pumping in the NBI. It can introduce significant errors when the FIDA signal is calculated. Reasonable FIDA data estimates can however be obtained by interpolating over the H BES peak; this was done for later figures showing the radial profiles of the net FIDA signal (active minus reference).
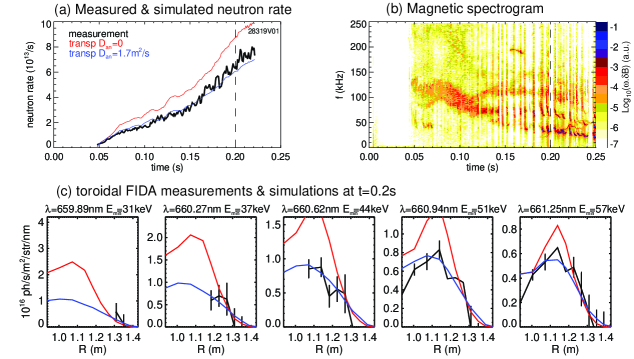
Spatial profiles of the net FIDA signal are plotted in Figure (10c) for different wavelengths corresponding to from 30 to 60keV. In this figure, regions influenced by beam emission have been removed (no lines or points), and those influenced by H beam emission have been interpolated over (lines, but no points). Because the Doppler shift of the beam emission varies with channel, lower wavelengths are absent for inner radii.
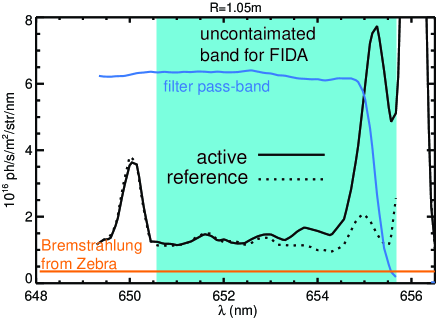
Active and reference spectra from the vertical view are shown in Figure (6), compared with the expected bremsstrahlung level based on Zebra measurements, and the filter pass-band. There is a peak at about 655.2nm, corresponding to a competition between increasing halo closer to the unshifted line, and decreasing filter transmission. The available wavelength band for the vertical views is much larger, the entire blue shifted region being free from contaminants apart from an oxygen line at 650nm which is out of the FIDA spectral region. The background is however somewhat larger than the bremsstrahlung level, probably due to radiation from the divertor region.
III Calibration and tests
III.1 Relative calibration
A relative calibration was made between the tokamak fibre and coupling lens system and the calibration fibres located adjacent to the spectrometer. Separate calibration factors were obtained for each individual fibre and were found to be approximately , with the channel-to-channel variation being within and additional reproducibility errors being of order . The windows are shuttered during discharge cleaning and have a transmission of .
Calibration of the vertical views is much more difficult than the horizontal views on account of the fact that (1) the internal lenses are not protected from deposition from the plasma and glow discharge cleaning pulses, and (2) the vacuum feed through system relies on imaging fibre to fibre and is prone to small misalignments. The coupling efficiency of the in-vessel lens to the ex-vessel fibres is , as determined by the ratio of the beam emission compared with that expected from the beam model, while it was measured to be during installation. The reason for this discrepancy may be due to coating of the in-vessel lens, however the transmission has not deteriorated significantly during an experimental campaign.
For each viewing bundle, active to reference cross-calibration can be performed by looking at discrete spectral lines as well as the broadband bremsstrahlung baseline. For the toroidal views, both broadband and line components are very similar between active and reference views, indicating that no additional calibration factor is necessary. The vertical active signals require on average a relatively large scaling factor of 2.5 to bring them into agreement with the vertical reference views. This is similar to the observed reduction in transmission efficiency of the active lens (), however this ratio can vary substantially between indivdual pairs of (active/reference) channels and may be indicative of the spatial structure of divertor molecular emission.
To account for this relative calibration, routine analysis presented in later sections includes multiplication by the basic active/reference transmission ratio (which for the toroidal view is close to unity) and offsetting of the reference emission to force the background level to be the same (at 662nm) in active and reference views, in order that basic mis-matches (due to reflection of broadband molecular emission from the divertor, for example) are avoided.
III.2 Absolute calibration via beam emission
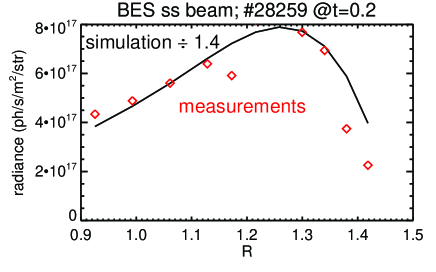
Because the FIDA spectrometer is designed to view the weak FIDA light, the instrument must be configured deliberately to obtain beam emission measurements on the toroidal views without saturation of the detector. The profile of the simulated (using the NEBULA code, as described in Section (IV)) and measured beam emission is compared in Figure (7). Considering the relative calibration factors above, and absolute calibration of the spectrometer, a scaling factor of 1.4 is required to model the beam emission. On the other hand, the broadband bremsstrahlung component often agrees with that calculated from the Zebra diagnostic (partially as indicated in Figure (5), though other analysis has confirmed this more thoroughly), indicating consistency of the absolute calibration. The spatial profile of the beam emission matches well with the model, indicating that the beam attenuation is modelled correctly, which validates the spatial profile of the power and fast ion deposition. It is evident that the disagreement factor of 1.4 is indicative that at least one of the assumptions made above is wrong, those being: absolute calibration of the FIDA diagnostic; divergence profile of the beam, beam power, electron temperature and density; FIDA sightline geometry with respect to the beam; and atomic physics rate coefficients.
The beam specification is given in [17]. The shape (divergence) and position of the beams are confirmed with an unfiltered camera which can clearly see the beam during beam-into-gas discharges, and another filtered imaging diagnostic which measures the Doppler shifted beam emission in the range of 660nm. Beam power measurements take account of a neutralization model for the beam and measurements of the species fraction mix. Modelling of the beam deposition is likely to be accurate to better than 10 percent, and can be confirmed by the profile shape of beam emission as seen in Figure (7).
Geometry of the sight lines with respect to the beam was confirmed using backlighting tests and indicate that the alignment is correct to within about 2cm, which should degrade the beam emission by only . The beam power is considered to be correct on two accounts; firstly since the measured total neutron rate agrees with TRANSP simulations in MHD quiescent discharges, and secondly, since the toroidal FIDA signals (scaled to match the beam emission) also agree with TRANSP simulations in these same quiescent discharges (see for example Figure (5)). This is because the BES signal while the FIDA signal (where is the beam power). A calibration error would affect these two signals by the same factor but a power error would affect the FIDA signal more strongly.
The ADAS rate coefficients used here were shown during experiments on JET to be discrepant by around the same factor of 1.4 derived here, but in that work the discrepancy was attributed to uncertainty in the absolute calibration. On the other hand, on DIII-D, the rate coefficients have been confirmed [45]. On ASDEX too, FIDA measurements have been shown to be in absolute agreement with modelling, indicating that the some of the rate coefficients are correct (beam emission modelling is only based on electron and ion collision cross-sections, while FIDA modelling relies on the same cross-sections as well as state-selective charge exchange).
III.3 Passive FIDA subtraction
As shown in Figure (5), there exists passive FIDA emission even on the reference views caused by edge neutrals [46]. The amount of passive FIDA is experimentally estimated to be the spectrum minus the minimum of the spectrum, around 662nm, which is taken to be the (bremsstrahlung and molecular emission) background. The amount of passive FIDA is in delicate balance, influenced by the penetration depth of neutrals from the edge as well as the population of fast ions towards the edge of the plasma. Performing beam cut-off experiments and examining the on-off difference is a method to independently check the amount of passive emission in the active view and compare that with the reference views, as immediately after beam-switch off, a substantial population of fast ions remains. On the other hand, at the initial beam-switch on, there is no passive FIDA component because of the lack of fast ions.
Radial profiles of the passive FIDA (calculated as above) on the active and reference bundles, before and after beam switch off, and for various wavelengths are plotted in Figures (8) and (9). In Figure (8), the toroidal lens was viewing the SW beam. An alternative tokamak-spectrometer patching scheme was used in which there were 7 chords each from the active bundle, vertically-displaced reference bundle and toroidally-displaced reference bundle. It may be observed that there are noticeable discrepancies between active and both vertically and toroidally-displaced reference bundles. The vertically-displaced reference view has a very similar spectral shape to the active view but has a serious deficit in the magnitude of the passive FIDA, which renders this view most inaccurate for background subtraction since the magnitude of the passive FIDA is similar to the active FIDA. This difference in magnitude may be due to the vertical extent of the fast ion distribution or the donor neutral density and motivates the development of a model for passive FIDA emission.
The magnitude of the passive FIDA on the toroidally-displaced reference view is closer to that in the active view, but is slightly stronger towards the edge in the 660-661nm region. This extra passive emission may be caused by the vertical tilt of the toroidally displaced reference (), this being significantly different from that of the active view (). Referring to Figure (2), of the the SS beam (which is tilted down by , similar to that of the toroidally-displaced reference) is close to the pitch parameter characteristic of the birth of fast ions, near the edge, of about 0.7 so it is sampling parts of the fast ion distribution which have not been scattered in pitch angle. The energetic parts are scattered only by electrons which affect their energy rather than their pitch angle. On the other hand, of the SW beam is very close to unity and rather different from the birth pitch parameter, indicating that this picks up less of the signal from recently-born fast ions. The passive emission from SW active views and toroidally-displaced passive might therefore plausibly be different.
A similar background subtraction test was conducted (in different discharge conditions) between the active bundle on the SS beam and the toroidally-displaced reference in Figure (9). Here, the passive emission profile is very similar in both magnitude and shape on the SW view. There are still some discrepancies at higher wavelengths on the edge few chords. This configuration was therefore chosen for further analysis in this paper.
IV Forward modelling of FIDA and beam emission
Thorough modelling of FIDA and beam emission can be done with the FIDASIM code [36]. This is based on output from the TRANSP code, which uses the NUBEAM module for the fast ion distribution function. In its basic form, NUBEAM considers only classical collisional slowing down and transport. Additional anomalous diffusion coefficients can however be introduced using a variety of parameterisations, which may be utilized to match the experiment due to anomalous activity from fast particle MHD, for example. There will certainly be a broader class of models which would also be consistent with the results, but these simple models are useful for evaluation of the fast ion heat source.
For TRANSP simulations, MSE-constrained EFIT equilibria are used. Thomson scattering data give electron temperature and density; CXRS provides ion temperatures and bulk toroidal rotation velocities; and the Zebra bremsstrahlung diagnostic is used to obtain profiles of . All diagnostics have spatial resolutions better than a few centimetres at most. Profiles are mapped to the EFIT equilibrium and fitted on both sides of the magnetic axis using adaptive smoothing based on error bars and goodness of fit. For rapid modelling of beam emission measurements incorporating up-to-date ADAS rate coefficients, the NEBULA code was used. This is based on the code NEMO [47], formerly used for the same purpose [48]. This code has been validated against other codes, in particular FIDASIM and TRANSP.
V Comparison of FIDA measurements with modelling
V.1 Toroidal view in MHD-quiescent phase of a low-power discharge
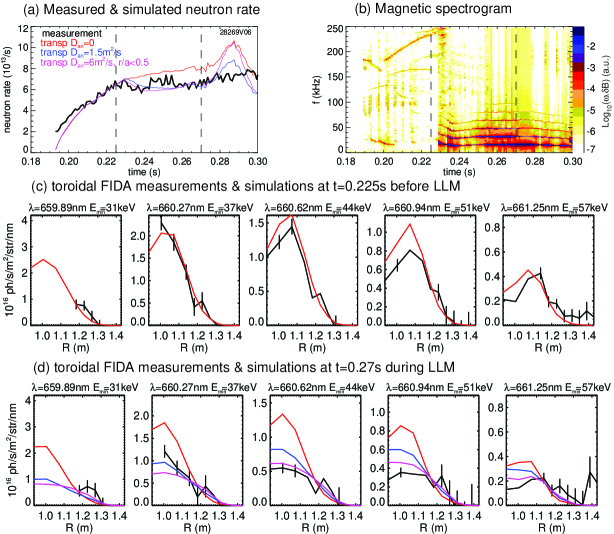
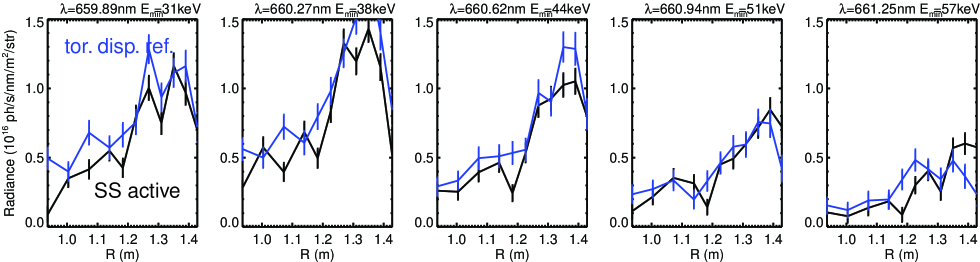
A period within a discharge is chosen in which the neutron rate matches the TRANSP calculation. The time evolution of the neutron rate, compared with TRANSP simulation, as well as a magnetic spectrogram is plotted in Figure (10a). This discharge features a long lived mode (LLM) after s, but in this section s (during the quiescent phase) is analysed. Spatial profiles of the FIDA signals are shown in Figure (10c) for different wavelengths corresponding to from 31 to 57keV. The error bar in the figure is a combination of the shot-noise error bar as well as an estimate of the (subtraction) systematic error, taken to be of the value of the passive FIDA signal as described in Section (III.3). FIDASIM code results based on classical NUBEAM calculations (scaled down by 1.4 in order to match the beam emission) are compared with the experimental data points. Though the overall agreement is not perfect here, it is quite reasonable, and serves as a basis for the investigation of anomalous effects. The slight over-estimation at keV may be due to frame-transfer smearing of the peaks; this occurs despite the use of a blocking mask. There is a discrepancy with edge channels at higher energy as a consequence of the error in passive background subtraction; it was shown in Figure (9) that the reference view often sees a larger signal than the active view at FIDA wavelengths as a consequence of the slight difference in viewing geometry. There is an anomalously high value in the few edge channels at keV, while the subtracted signal goes negative (because the passive signal is larger) at around keV. These discrepancies become larger in the presence of MHD.
V.2 Vertical system measurements in quiescent discharge
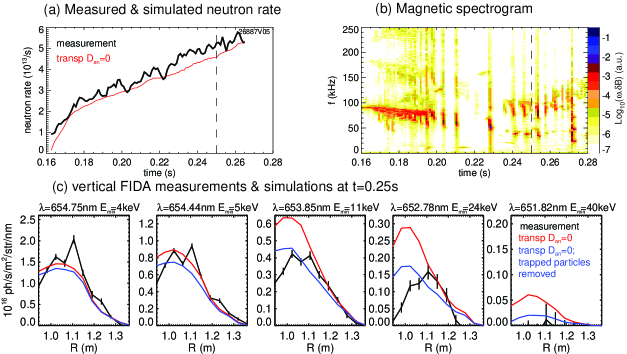
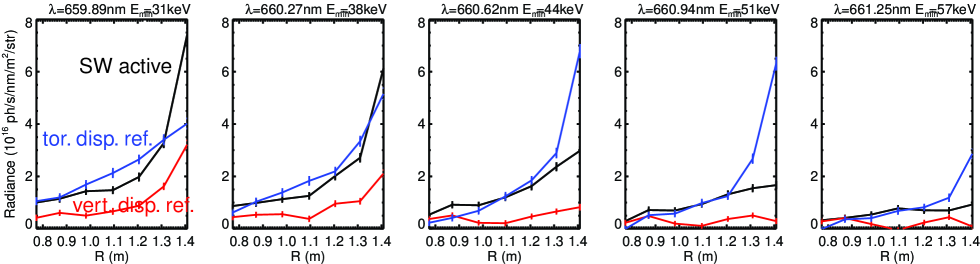
The MHD-quiescent discharge was part of a series during which toroidal and vertical data were taken on repeat discharges, however since the vertically-displaced reference was used for the toroidal data, such data cannot be used. The use of both views simultaneously would allow tomographic reconstructions of the fast ion distribution to be made to complement the unknown parts of the distribution function from each measurement [41]. The time history of the neutron rate and magnetic spectrogram is shown in Figure (11a). While the discharge does feature some chirping modes, the neutron rate matches closely the TRANSP prediction (the slight under-prediction may be a result of the fact that the simulation start time is slightly after (ms) the actual beam start time due to data timing issues). The FIDA signals are plotted in Figure (11b). An attenuation factor of 1.4, derived from the toroidal beam emission discrepancy, is used in addition to value of due to the in-vessel fibres (n.b. this factor was verified via beam-into-gas shots on the vertical view). Additionally, the background has been multiplied by 0.4 to account for the coating of the active in-vessel lens. The chosen values of here are much lower, simply by virtue of the fact that the higher values contain little or no signal. The lowest value here is just in the tail of the halo. Here, the proper halo calculation was performed using the direct charge exchange module of the FIDASIM code. There are noticeable discrepancies between the measurement and the (classical) theory. It appears that the signal is discrepant by up to a factor of 2 for . For higher energies the discrepancy is much larger, with there being no clear difference between active and reference signals while theory would predict that there should be. It is worth noting that the discrepancy does not vary between the fishbone events, and is present in many other discharges with a low amount of MHD activity where the neutron rate is classical.
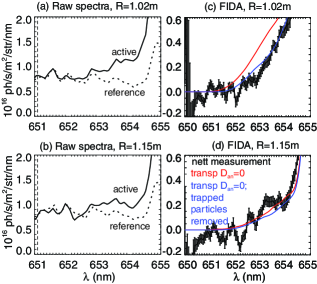
The discrepancy in energy space is more clearly visualised by examining the spectra in Figure (12) of raw signals (a), subtracted signals and simulations (b) for the inner radii where the discrepancy is largest and a mid-radius channel where the discrepancy is small. It can be seen that the spectral shape at m does not match the simulation, and that even a scaling factor would not bring this into agreement. On the other hand, at m, the agreement is reasonable. It is noteworthy that in both cases, the FIDA signal is somewhat smaller than the background level.
Because of the fact that trapped ion orbits have worse confinement properties than passing ion orbits, it is worth considering whether this discrepancy might be explained by a reduction in trapped particle fraction. To test this, the trapped particles were ’zeroed’ out in the TRANSP calculation result and fed into the FIDASIM calculation. It is unlikely that this corresponds to the real situation, but it serves to demonstrate the contribution of trapped particles to the FIDA signal. The result of this calculation brings the magnitude of the signals into considerably better agreement, but there are still discrepancies particularly in the core region at keV, equivalently for nm. Note that reducing the trapped particle fraction results in a negligible reduction of the predicted neutron rate as the highest-energy particles tend to be passing.
Redistribution of the passing particles may also reduce the FIDA signal. The fast ion distribution, together with the vertical weight function for , is plotted in Figure (3a) at m, corresponding to that in Figure (11b, far right panel). It can be seen that the given wavelength for has its response function just intersecting the primary birth energy peak at , (corresponding approximately to the birth pitch angle). One way in which the simulated signal could be reduced is if the average pitch parameter were higher, thereby ‘missing’ more of the weight function of the vertical chords. Initially, it would appear that such an explanation is unlikely, as the volume of phase space contributing to the weight function is smaller at larger pitch parameter. On the other hand, if one inspects Figure (2c), at inner radii, close to the tangency radius of 0.7m, the birth pitch parameter becomes close to unity. The fast ions follow a flux surface to give a large component of the distribution at pitch parameter unity near m. If the fast ions were not ’born’ until they were further into the plasma, then their value of pitch parameter would be closer to unity. Another possibility is that finite Larmor radius effects, included only via a coarse approximation in the presented simulations, may play a role. This would particularly affect potato orbits near the core, resulting in slightly different pitch parameters.
Other FIDA systems on other tokamaks have had differing levels of agreement between modelling and data on vertical views. In DIII-D for example, agreement was found with theory on vertical views (or horizontal ones sensitive to the trapped ions) [28], while on NSTX, there have been problems gaining agreement on the vertical views, although calibration errors contributed to this discrepancy [49].
V.3 Power scaling of vertical FIDA signals
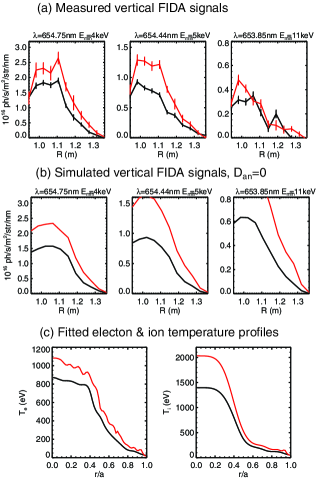
In the same set of experiments as the previous section, the discharge was repeated with double the beam power, achieved by simultaneous injection of the SS and SW beams. Here, the neutron rate goes up by a factor of 1.7. The comparison of the measured and (classical) simulated vertical FIDA signals at keV, and ion and electron temperature profiles, are shown in Figure (13). The measured increase in vertical FIDA signals is approximately of the expected increase at 6 and 4 keV, while there is practically no increase at 11 keV and above. Toroidal FIDA signals on the other hand do increase by a reasonable factor when the beam power doubles.
The ion temperature increases by between the 1 beam and 2 beam shot, while the electron temperature increases only slightly. As the ion heating rate scales as , such low energy fast ions contribute to most of the ion heating. This is evidence that the apparent stiffness in the bulk heat transport causes or is caused by the same anomalous effects that degrade the confinement of fast ions at energies only few times the thermal energy.
V.4 Degradation of toroidal signals due to long lived mode
In most discharges, a long lived mode (LLM) appears as q approaches unity [7]. This is associated with strong braking and a steady mode structure. While the LLM might be avoided in advanced tokamak scenarios in future devices, it does indeed show how the fast ion signal decreases in response to a symmetry breaking and how certain resonant particles are lost. It is somewhat relevant to the chirping modes in MAST which are often decreasing to the same frequency as the LLM, and are shown theoretically to have a similar n=1 kink structure (though there are important differences). The measured signal at in shot is plotted in Figure (10d). The measured neutron rate is of the calculated neutron rate assuming . On the other, hand, FIDA measurements are discrepant by about in the core region, and within error bars agree towards the edge except at high energies where there is possibly a contribution from the incorrect background subtraction discussed previously. The y-scales in each subplot corresponding to different values of are scaled in proportion to the contribution to the neutron rate. To assess the effect of other models two further simulations were performed, one in which over the entire radius (for ), and one for which for (again for ). Both of these models match the neutron rate. However, by using the model for which is applied only in the inner half radius, the modeled higher energy FIDA signals match better to the measurement. On the other hand, at the lower energy band wavelength, , this model has decreased the signal by too great a factor. Some sort of hybrid model would be appropriate where the diffusion coefficient decreases at lower energies. An energy dependent model has been used in the past [22], and tends to give a better match to the stored energy while maintaining a similar neutron rate. Stored energy is not compared here, as it is often found that in discharges for which the neutron rate matches a classical TRANSP simulation the stored energy is underestimated.
Such ad-hoc methods for applying a diffusion operator in TRANSP do not completely elucidate the physics, as there may be other models which replicate the same experimental signals. Nevertheless, simple models give an idea of the likely heating power delivered to the ions and electrons. For example, in this case, the heating power at mid radius is only different between the two anomalous models, validating the existing transport simulations at half radius.
V.5 Degradation of toroidal signals due to chirping modes
Most discharges in MAST feature some sort of chirping modes, and they tend to extend from the TAE range of frequencies down to the rotation frequency of the core, corresponding to an n=1 kink mode characteristic of a fishbone oscillation. The avoidance of these modes is a current research topic and necessary for the design of future high performance devices. On the other hand, for transport analysis of the highest power discharges for example, some chirping modes must be taken into account in the calculation of the ion and electron heating power. While only the neutron measurements have been used for calculating the effective diffusion coefficient (including the fission chamber and neutron camera [50, 51]), a range of functional forms for the spatial/energy dependence of the diffusion coefficient may exist. In this respect the FIDA data may corroborate/invalidate some of these models.
With any bursting, intermittent mode such as a fishbone or sawtooth, the period between events is often larger when the events are larger, so the net transport level may not depend strongly on the period. It is important however to understand the trigger for the mode as well as the mechanism for the degradation of fast ions. Fishbones are considered to be triggered by trapped ions but can redistribute a significant fraction of passing ions. This is determined from the fact that, for example, the neutron rate is affected, which is known to be most sensitive to the higher energy passing ions. The relaxation between fishbones is therefore likely to be governed by the collisional phase-space redistribution of particles back towards equilibrium. Often however, the magnetic spectrogram at low frequencies does not go completely quiet between fishbones.
FIDA data from a chirping mode discharge are shown in Figure (14). Initially a ’continuum’ of modes exists, then they become more discretely spaced in time. A uniform anomalous diffusion coefficient of brings the predicted neutron rate into agreement with the fission chamber. This appears not to require adjustment depending on the period of the fishbones, reinforcing the idea that the period does not affect the rate of fast ion redistribution. At s, the FIDA spatial profiles of the toroidal channels are compared with the simulations for zero anomalous diffusion and for . Here it is found that the FIDA measurement is clearly smaller than the classical prediction, but matches quite reasonably, within error bars, the simulation with a uniform diffusion coefficient. This is in contrast to the LLM, which required the diffusion to be concentrated in the core.
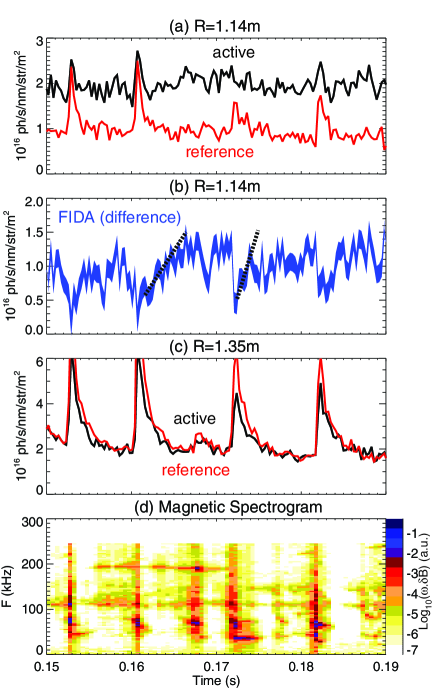
To investigate degradation/recovery due to fishbones, the time evolution of core and edge signals of both active and reference views (as well as the subtracted, i.e. FIDA component of the core signal), is compared with the magnetic spectrogram in Figure (15). This demonstrates the utility of having a very fast CCD and high light throughput. Clear bursts in the reference signals occur for both core and edge channels, which is considered to be due to a rapid ’burst’ of passive FIDA emission from the edge. The core FIDA (difference) signal drops concomitantly with each magnetic burst, with there being some relation between the size of the magnetic burst and the amount of drop of the FIDA signal. There is virtually no difference between active and reference signals at the edge, even during a fishbone burst. The beam driven FIDA signal is proportional to the beam density (), while the passive FIDA signal is proportional to the neutral density, which can be up to in the edge but attenuates rapidly into the plasma. The large increase in passive FIDA and lack of increase in beam FIDA near the edge indicates that the fast ions are being rapidly redistributed toward the edge. The core (net) FIDA signal on the other hand appears often to recover and ’saturate’ at a particular value before the next fishbone occurs. In fact, one can see a sort of cyclic fast sawtooth type of behaviour, indicating that smaller bursts may be occurring in between the larger bursts, and their net transport level may be similar as the neutron rate does not increase. Further simulations of the collisional relaxation between fishbones, as well as the drop due to individual fishbones, are underway to quantify this in more detail.
The recovery time of the passive FIDA in the edge is somewhat longer than that of the active signal in the core. It may be that the dynamics of the recovery of the edge signal are a strong controlling parameter in triggering the next fishbone. On the other hand, losses of fast ions at the edge are quite rapid. The mechanism of fast ion damping/orbit loss in the edge is therefore important.
These fishbone cycles are only prevalent in the toroidal FIDA signals; the vertical FIDA signals do not show any clear drop with fishbone events, and although some correlation may be found it is much less clear. This may be because there is an anomalously low vertical FIDA signal. Further analysis of FIDA measurements during fishbone activity in MAST can be found in [52].
VI Conclusions
The FIDA signals observed on MAST provide both energy and spatially-resolved information about the fast ion distribution. The diagnostic arrangement, as well as first results from the dual-view FIDA spectrometer on MAST have been presented. The toroidal chords can be used for moderate to high energies (30-60keV) and are strongly sensitive to passing particles, while the vertical chords can be used for a broad range of energies and are sensitive to trapped particles and those close to the trapped/passing boundary (at high energies). The background signal on toroidal channels is found to contain passive FIDA emission, driven by edge neutrals, and this can be almost as large as the active FIDA emission. Moreover, the passive FIDA emission was found to be quite different in spectral shape and magnitude depending on which of the views were taken: the active view through each beam; a toroidally-displaced reference; or a vertically-displaced reference. It was concluded that using the toroidally-displaced reference on the SS beam was most accurate and good enough for comparing measurements with FIDASIM simulations. Cross-calibration of all the views has been carried out. Absolute calibration has been performed, and is partially validated in that the spectral baseline often agrees with the Zebra diagnostic. Uncertainties remain, since FIDASIM and NEBULA simulations predict a factor 1.4 higher intensity beam emission than that measured with the FIDA diagnostic. Possible causes of this discrepancy have been considered. Incorporating this factor, the toroidal FIDA signals have been validated against modelling in the MHD-quiescent phase of a discharge where the neutron rate also matches simulation. On the other hand, FIDA signals from vertical chords agree with simulations for keV, but do not agree with simulations at higher energies. This indicates that there may be discrepancies in simulations (even in the absence of MHD) for pitch angles around the trapped/passing boundary near the core, which may be due to finite Larmor radius effects combined with potato orbits in the core. The NUBEAM simulations simply approximate the gyro-motion as circular motion in a magnetic field sampled at the guiding centre, which may not be true in spherical tokamaks where the field varies considerably around the gyro orbit. This is a topic for study, and hopefully for inclusion in future simulations.
FIDA measurements show a degradation in fast ion transport due to the long-lived mode, and a model which is most consistent with the total neutron rate and FIDA signal is one in which the anomalous diffusion coefficient is high in the inner half radius and zero outside this. This is consistent with the LLM being localized in the broad, low-shear region of the core.
In discharges with fishbones, a spatially flat anomalous diffusivity of a few , consistent with the neutron rate, is sufficient to fit the spatial profile of toroidal signals. During fishbones, core active FIDA signals drop while edge active FIDA signals hardly change but the passive FIDA signals increase dramatically, indicative of dramatic sudden redistribution far into the edge, which may be due to for example an avalanche or induced change of orbit type from confined to unconfined. Between fishbones, the active FIDA signal appears to saturate. There may however be other modes present in the selected discharge which affect this active FIDA signal. Further work is underway to examine changes in spectra during fishbones and simulate the inter-fishbone evolution. Simulation work is also underway at to quantify fast ion losses by fishbones using the simulation codes LOCUST-GPU [53] and HAGIS [54]. Tomographic techniques will also be applied to simultaneous toroidal and vertical FIDA measurements to generate a reconstruction of the fast ion distribution [55].
VII Acknowledgments
The authors would like to acknowledge the support of the MAST technical team, as well as M. Salewski and K. McClements for checking the manuscript, A. Bortolon for assistance with the spectrometer, B. Grierson for information about atomic rate coefficients, and D. Liu and E. Ruskov for their assistance with the FIDASIM code. This work was funded partly by the RCUK Energy Programme under grant EP/I501045 and the European Communities under the contract of Association between EURATOM and CCFE. The views and opinions expressed herein do not necessarily reect those of the European Commission or of the ITER Organization.
References
- [1] J. G. Cordey and W. G. F. Core. Physics of Fluids, 17(8):1626, 1974.
- [2] W. G. F. Core. Nuclear Fusion, 33(5):829, 1993.
- [3] K. McGuire, R. Goldston, M. Bell, et al. Study of high-beta magnetohydrodynamic modes and fast-ion losses in pdx. Physical Review Letters, 50:891, 1983.
- [4] H. H. Duong, W. W. Heidbrink, E. J. Strait, T. W. Petrie, R. Lee, R. A. Moyer, and J. G. Watkins. Loss of beam ions during tae activity in diii-d. Nuclear Fusion, 33:749, 1993.
- [5] E. M. Carolipio, W. W. Heidbrink, C. B. Forest, and R. B. White. Simulations of beam ion transport during tearing modes in the diii-d tokamak. Nuclear Fusion, 42:853, 2002.
- [6] T. Hauff, M.J. Pueschel, T. Dannert, and F. Jenko. Electrostatic and magnetic transport of energetic ions in turbulent plasmas. Physical Review Letters, 102(7):075004, 2009.
- [7] I.T. Chapman, M.-D. Hua, S.D. Pinches, R.J. Akers, A.R. Field, J.P. Graves, R.J. Hastie, C.A. Michael, and the MAST Team. Saturated ideal modes in advanced tokamak regimes in mast. Nuclear Fusion, 50(4):045007, 2010.
- [8] E. D. Fredrickson, N. Gorelenkov, C. Z. Cheng, R. Bell, D. Darrow, D. Johnson, S. Kaye, B. LeBlanc, J. Menard, S. Kubota, and W Peebles. Observation of compressional alfven modes during neutral beam heating on the nstx. Physical Review Letters, 87:145001, 2001.
- [9] W. W. Heidbrink. Fast-ion d alpha measurements of the fast-ion distribution (invited). Review of Scientific Instruments, 81(10):10D727, 2010.
- [10] R. B. White, R. J. Goldston, K. McGuire, et al. Theory of mode-induced beam particle loss in tokamaks. Physics of Fluids, 26:2958, 1983.
- [11] D. J. Sigmar, C. T. Hsu, R. White, and C. Z. Cheng. alpha-particle losses from toroidicity-induced alfven eigenmodes. part ii: monte carlo simulations and anomalous alpha-loss processes. Physics of Fluids B, 4:1506, 1992.
- [12] R. B. White, N. Gorelenkov, W. W. Heidbrink, and M. A. VanZeeland. Particle distribution modification by low amplitude modes. Plasma Physics and Controled Fusion, 52:045012, 2010.
- [13] H. L. Berk, B. N. Breizman, J. Fitzpatrick, and H. V. Wong. line broadened quasi-linear burst model. Nuclear Fusion, 35:1661, 1995.
- [14] S. V. Konovalov and S. V. Putvinskii. Effect of kink perturbations of the magnetic field on the fast-particle drift surfaces in a tokamak. Soviet Journal of Plasma Physics, 14:461, 1988.
- [15] H. E. Mynick. Transport of energetic ions by low-n magnetic perturbations. Physics of Fluids B, 5:1471, 1993.
- [16] Xi Chen, M. E. Austin, R. K. Fisher, W. W. Heidbrink, G. J. Kramer, R. Nazikian, D. C. Pace, C. C. Petty, and M. A. Van Zeeland. Enhanced localized energetic ion losses resulting from single-pass interactions with alfven eigenmodes. Physical Review Letters, 111:in press, 2013.
- [17] S.J. Gee, R. Baldwin, A. Borthwick, D. Ciric, G. Crawford, L. Hackett, D. Homfray, D. Martin, J. Milnes, T. Mutters, M. Simmonds, R. Smith, R. Stephen, P. Stevenson, E. Surrey, C. Waldon, S. Warder, A. Whitehead, and D. Young. Mast neutral beam long pulse upgrade. Fusion Engineering and Design, 74(1–4):403 – 407, 2005.
- [18] M.P. Gryaznevich, S.E. Sharapov, M. Lilley, S.D. Pinches, A.R. Field, D. Howell, D. Keeling, R. Martin, H. Meyer, H. Smith, R. Vann, P. Denner, E. Verwichte, and the MAST Team. Recent experiments on alfvén eigenmodes in mast. Nuclear Fusion, 48(8):084003, 2008.
- [19] W. Schneider, M.R. Turnyanskiy, F.V. Chernyshev, V.I. Afanasyev, M. Kick, and T. Richert. Comparison of the ioffe neutral particle analyser with the princeton analyser on the mega amp spherical tokamak. Vacuum, 83(4):752 – 756, 2008. Proceedings of the “Symposium on Vacuum based Science and Technology”, Greifswald, 5-7 September 2007.
- [20] Keith Stammers and M.J. Loughlin. The calibration of the mast neutron yield monitors. Nuclear Instruments and Methods in Physics Research Section A: Accelerators, Spectrometers, Detectors and Associated Equipment, 562(1):521 – 530, 2006.
- [21] M. Turnyanskiy, D.L. Keeling, R.J. Akers, G. Cunningham, N.J. Conway, H. Meyer, C.A. Michael, and S.D. Pinches. Study of the fast ion confinement and current profile control on mast. Nuclear Fusion, 49(6):065002, 2009.
- [22] A.R. Field, C. Michael, R.J. Akers, J. Candy, G. Colyer, W. Guttenfelder, Y. c. Ghim, C.M. Roach, S. Saarelma, and the MAST Team. Plasma rotation and transport in mast spherical tokamak. Nuclear Fusion, 51(6):063006, 2011.
- [23] M. Valovic, R. Akers, M. de Bock, J. McCone, L. Garzotti, C. Michael, G. Naylor, A. Patel, C.M. Roach, R. Scannell, M. Turnyanskiy, M. Wisse, W. Guttenfelder, J. Candy, and the MAST team. Collisionality and safety factor scalings of h-mode energy transport in the mast spherical tokamak. Nuclear Fusion, 51(7):073045, 2011.
- [24] Alexei Pankin, Douglas McCune, Robert Andre, Glenn Bateman, and Arnold Kritz. The tokamak monte carlo fast ion module nubeam in the national transport code collaboration library. Computer Physics Communications, 159(3):157 – 184, 2004.
- [25] L.C. Appel, M.K. Bevir, and M.J. Walsh. Equilibrium reconstruction in the start tokamak. Nuclear Fusion, 41(2):169, 2001.
- [26] M.J. Hole, G. von Nessi, J. Svensson, L.C. Appel, and the MAST Team. An equilibrium validation technique based on bayesian inference. Nuclear Fusion, 51(10):103005, 2011.
- [27] M. Cecconello, M. Turnyanskiy, S. Conroy, G. Ericsson, E. Ronchi, S. Sangaroon, R. Akers, I. Fitzgerald, A. Cullen, and M. Weiszflog. A neutron camera system for mast. Review of Scientific Instruments, 81(10):10D315, 2010.
- [28] W W Heidbrink, Y Luo, K H Burrell, R W Harvey, R I Pinsker, and E Ruskov. Measurements of fast-ion acceleration at cyclotron harmonics using balmer-alpha spectroscopy. Plasma Physics and Controlled Fusion, 49(9):1457, 2007.
- [29] M G von Hellermann, W G F Core, J Frieling, L D Horton, R W T Konig, W Mandl, and H P Summers. Observation of alpha particle slowing-down spectra in jet helium beam fuelling and heating experiments. Plasma Physics and Controlled Fusion, 35(7):799, 1993.
- [30] W W Heidbrink, K H Burrell, Y Luo, N A Pablant, and E Ruskov. Hydrogenic fast-ion diagnostic using balmer-alpha light. Plasma Physics and Controlled Fusion, 46(12):1855, 2004.
- [31] B Geiger, M Garcia-Munoz, W W Heidbrink, R M McDermott, G Tardini, R Dux, R Fischer, V Igochine, and the ASDEX Upgrade Team. Fast-ion d-alpha measurements at asdex upgrade. Plasma Physics and Controlled Fusion, 53(6):065010, 2011.
- [32] T. Ito, M. Osakabe, K. Ida, M. Yoshinuma, M. Kobayashi, M. Goto, S. Murakami, M. Isobe, S. Kobayashi, K. Toi, K. Ogawa, Y. Takeiri, and S. Okamura. Fast ion charge exchange spectroscopy adapted for tangential viewing geometry in lhd. Review of Scientific Instruments, 81(10):10D327, 2010.
- [33] E. Delabie, R. J. E. Jaspers, M. G. von Hellermann, S. K. Nielsen, and O. Marchuk. Charge exchange spectroscopy as a fast ion diagnostic on textor. Review of Scientific Instruments, 79(10):10E522, 2008.
- [34] M. Podesta, W. W. Heidbrink, R. E. Bell, and R. Feder. The nstx fast-ion d-alpha diagnostic. Review of Scientific Instruments, 79(10):10E521, 2008.
- [35] A. Bortolon, W. W. Heidbrink, and M. Podesta. A tangentially viewing fast ion d-alpha diagnostic for nstx. Review of Scientific Instruments, 81(10):10D728, 2010.
- [36] W.W. Heidbrink, D. Liu, Y. Luo, E. Ruskov, and B. Geiger. Commun. Comput. Phys., 10(3):716–741, 2011.
- [37] N. J. Conway, P. G. Carolan, J. McCone, M. J. Walsh, and M. Wisse. High-throughput charge exchange recombination spectroscopy system on mast. Review of Scientific Instruments, 77(10):10F131, 2006.
- [38] N. J. Conway, M. F. M. De Bock, C. A. Michael, M. J. Walsh, P. G. Carolan, N. C. Hawkes, E. Rachlew, J. F. G. McCone, S. Shibaev, and G. Wearing. The mast motional stark effect diagnostic. Review of Scientific Instruments, 81(10):10D738, 2010.
- [39] Marco Wisse. Charge-Exchange Spectroscopy in the MAST Tokamak. PhD thesis, University College Cork, 2007.
- [40] A R Field, J McCone, N J Conway, M Dunstan, S Newton, and M Wisse. Comparison of measured poloidal rotation in mast spherical tokamak plasmas with neo-classical predictions. Plasma Physics and Controlled Fusion, 51(10):105002, 2009.
- [41] M. Salewski, S.K. Nielsen, H. Bindslev, V. Furtula, N.N. Gorelenkov, S.B. Korsholm, F. Leipold, F Meo, P.K. Michelsen, D. Moseev, and M. Stejner. On velocity space interrogation regions of fast-ion collective thomson scattering at iter. Nuclear Fusion, 51(8):083014, 2011.
- [42] Ronald E. Bell. Exploiting a transmission grating spectrometer. Review of Scientific Instruments, 75(10):4158–4161, 2004.
- [43] Materion Corp., Massachusetts, USA. 2010.
- [44] A. Patel, P.G. Carolan, N.J. Conway, and R.J. Akers. Zeff profile measurements from bremsstrahlung imaging in the mast spherical tokamak. Review of Scientific Instruments, 75(11):4944–50, 2004.
- [45] B. Grierson. private communication, 2012.
- [46] W W Heidbrink, G R McKee, D R Smith, and A Bortolon. ’beam-emission spectroscopy’ diagnostics also measure edge fast-ion light. Plasma Physics and Controlled Fusion, 53(8):085007, 2011.
- [47] M. Schneider, L.-G. Eriksson, I. Jenkins, J.F. Artaud, V. Basiuk, F. Imbeaux, T. Oikawa, JET-EFDA contributors, and ITM-TF contributors. Simulation of the neutral beam deposition within integrated tokamak modelling frameworks. Nuclear Fusion, 51(6):063019, 2011.
- [48] E Delabie, M Brix, C Giroud, R J E Jaspers, O Marchuk, M G O’Mullane, Yu Ralchenko, E Surrey, M G von Hellermann, K D Zastrow, and JET-EFDA Contributors. Consistency of atomic data for the interpretation of beam emission spectra. Plasma Physics and Controlled Fusion, 52(12):125008, 2010.
- [49] W. W. Heidbrink, A. Bortolon, C. M. Muscatello, E. Ruskov, B. A. Grierson, and M. Podestá. Calibration techniques for fast-ion d[sub alpha ] diagnostics. Review of Scientific Instruments, 83(10):10D903, 2012.
- [50] M. Cecconello, S. Sangaroon, M. Turnyanskiy, S. Conroy, I. Wodniak, R.J. Akers, G. Ericsson, and the MAST Team. Observation of fast ion behaviour with a neutron emission profile monitor in mast. Nuclear Fusion, 52(9):094015, 2012.
- [51] M. Turnyanskiy, C. D. Challis, R. J. Akers, M. Cecconello, A. Kirk, S. D. Pinches, S. Sangaroon, and I. Wodniak. Measurement and control of the fast ion redistribution on mast. In Proc. IAEA FEC (San Diego, USA), EX/P6-06, 2012.
- [52] O M Jones, C A Michael, K G McClements, N J Conway, B Crowley, R J Akers, R J Lake, and S D Pinchesa nd MAST team. Fast-ion deuterium alpha spectroscopic observations of the effects of fishbones in the mega-ampere spherical tokamak. Plasma Physics and Controlled Fusion, in preparation, 2013.
- [53] R.J.Akers, E. Verwichte, S.D. Pinches T.J. Martin and, and R. Lake. Gpgpu monte carlo calculation of gyro-phase resolved fast ion and n-state resolved neutral deuterium distributions. In Proc. EPS. (Stockholm, Sweden), P5.088, 2012.
- [54] S.D. Pinches, L.C. Appel, J. Candy, S.E. Sharapov, H.L. Berk, D. Borba, B.N. Breizman, T.C. Hender, K.I. Hopcraft, G.T.A. Huysmans, and W. Kerner. The hagis self-consistent nonlinear wave-particle interaction model. Computer Physics Communications, 111(13):133 – 149, 1998.
- [55] M. Salewski, B. Geiger, S.K. Nielsen, H. Bindslev, M. García-Muñoz, W.W. Heidbrink, S.B. Korsholm, F. Leipold, F. Meo, P.K. Michelsen, D. Moseev, M. Stejner, G. Tardini, and the ASDEX Upgrade team. Tomography of fast-ion velocity-space distributions from synthetic cts and fida measurements. Nuclear Fusion, 52(10):103008, 2012.
- [56] R.B. White. The Theory of Toroidally Confined Plasmas. Imperial College Press, 2006.