Low-Density Structures in the Local Universe.
II. Nearby Cosmic Voids
Abstract
We present the results of the search for spherical volumes
containing no galaxies with luminosities brighter than the
Magellanic Clouds in the Local Supercluster and its vicinity.
Within a distance of 40 Mpc from us, 89 cosmic voids were
discovered with the diameters of 24 to 12 Mpc, containing no
galaxies with absolute magnitudes brighter than . A
list of these voids and the sky distribution maps are given. It
was found that 93% of spherical voids overlap, forming three more
extended percolated voids (hypervoids). The largest of them, HV1,
has 56 initial spherical cells and extends in a horseshoe shape,
enveloping the Local Volume and the Virgo cluster. The Local Void
(Tully, 1988) in the Hercules–Aquila region is the closest
part of the HV1. Another hypervoid, HV2, contains 22 spherical
voids in the Eridanus constellation, and the third compact
hypervoid (HV3) comprises 6 spherical cells in the Bootes. The
total volume of these voids incorporates about 30% of the Local
Universe. Among 2906 dwarf galaxies excluded from the original
sample () in the search for spherical volumes, only 68
are located in the voids we have discovered. They are
characterized by late morphological types (85% are Ir, Im, BCD,
Sm), absolute magnitudes ranging from to ,
moderate star formation rates () and gas reserves per
luminosity unit twice to three times larger than in the other
dwarf galaxies located in normal environments. The dwarf
population of the voids shows a certain tendency to sit shallow
near the surfaces of cosmic voids.
Keywords: cosmology: large-scale structure of Universe.
1 Main Astronomical Observatory, National Academy of Sciences, Kiev, 03680 Ukraine
2 Institut d’Astrophysique et de Geophysique, Université de Liège, Liège, B5C B4000 Belgium
3 Special Astrophysical Observatory of the Russian AS, Nizhnij Arkhyz 369167, Russia
4 Astronomical Observatory, Taras Shevchenko National University of Kiev, 04053 Ukraine
1 INTRODUCTION
The main element in the picture of the large-scale structure of the Universe, often referred to as the “Cosmic Web”, are the vast low-density regions, separated by the “walls” and filaments. The first observational evidence for the existence of giant cavities (voids) appeared about 30 years ago [1, 2, 3], but the concept of cosmic voids was implemented in common practice with the advent of mass surveys of galaxy redshifts. According to the current estimates, the sizes of voids span a wide range of extents from the supervoids with the diameters of about 200 Mpc [4] to mini-voids covering about 3–5 Mpc [5]. There is a conception that the typical number density of galaxies in cosmic voids is at least an order of magnitude lower than global mean density.
A lot of studies can be found in the literature, examining the statistics of sizes and shapes of voids, as well as the features of their population. A recent review of these studies was presented by van de Weygaert and Platen [6]. Different authors have used various algorithms for identifying the voids in mass sky surveys. Some of them suggest a complete absence of galaxies in the voids up to a fixed luminosity level. Other criteria allow the possibility of presence of a small number of galaxies with normal luminosity in the low-density regions. In the latter case, these regions should rather be called lacunas instead of voids.
Two important questions still remain unresolved: 1) whether there are volumes of space, completely devoid of galaxies, 2) if there are any signs of the void expansion in the kinematics of galaxies surrounding it. The answers to these questions are closely related to the choice of the most plausible scenario of the formation of the large-scale structure of the Universe [7, 6]. It is evident that the best opportunity to explore the dwarf population of the voids and the kinematics of galaxies around them is provided by the nearest voids. Compiling the atlas of nearby galaxies, Tully and Fisher [8] have discovered a giant empty region in the Aquila–Hercules constellations, which starts immediately at the threshold of our Local Group of galaxies, and occupies about a quarter of the entire sky. Inside this Local Void only two dwarf galaxies were found to date: KK 246 [9] and ALFAZOA J1952+1428 [10] with absolute -magnitudes of and , respectively. The analysis of the data on the radial velocities and distances of the galaxies in the vicinity of the Local Void points to an expansion of its frontiers at a velocity of about 300 km/s [11].
Using the 2dFGRS [12] and SDSS111Sloan Digital Sky Survey (http://www.sdss.org). [13] galaxy redshift surveys, Patiri et al. [14] and Hoyle et al. [15] have identified a large number of distant voids at the characteristic distances of . However, we have not found in the literature any systematic lists of voids in a closer volume on the scale of . An enumeration of nearby voids in the southern and northern sky, indicating their rough outlines can be found in the Fairall’s manuscript [16]. Pustilnik and Tepliakova [17] have investigated the properties of dwarf galaxies in the region of the Lynx–Cancer void. Saintonge et al. [18] noted the presence of a nearby km/s) void in the Pisces constellation according to the ALFALFA survey data [19].
In the first paper of this series [20], applying the percolation method we have identified the diffuse agglomerates of galaxies in the Local Supercluster, which are located in the regions of low matter density, and discussed the properties of the most populated non-virialized structures. In this paper we describe the algorithm for identifying the voids in the Local Supercluster, give a list of nearby (within 40 Mpc) voids and briefly discuss the properties of dwarf galaxies located in the nearby voids.
2 ORIGINAL SAMPLE OF GALAXIES
To search for voids in the Local Universe we used a sample of
10 502 galaxies with radial velocities km/s relative to the centroid of the Local Group. The
sample includes both the northern and southern sky, except for the
low galactic latitudes . For these galaxies,
presented in recent versions of the HyperLeda222Lyon
Database for Physics of
Galaxies
(http://leda.univ-lyon1.fr). [21] and
NED333NASA/IPAC Extragalactic Database
(http://nedwww.ipac.caltech.edu). databases we have refined
their angular dimensions and morphological types. Since the stellar
mass of the galaxy is best expressed through its -band
luminosity, we have used the -luminosities of galaxies
from the 2MASS survey [22]. In the absence of
these data, we determined the apparent -magnitudes from
the apparent -magnitudes and average color index
separately for each morphological
type according to [22]. From the original
sample, we have excluded faint galaxies with , and
objects with negative radial velocities. At the Hubble parameter
of km/s/Mpc the distance modulus for the far boundary of
our sample corresponds to . In order to have the same
conditions for the void identification both in the near and far
regions of our volume, we have excluded from the analysis the
dwarf galaxies with absolute magnitudes fainter than .
This threshold is roughly equivalent to the luminosity of the
Small Magellanic Cloud-type dwarfs. At that, the distances to the
galaxies were determined by their radial velocity with the
given above.
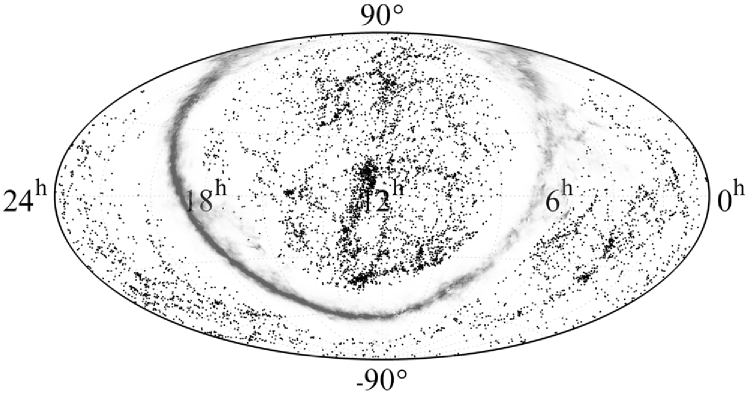
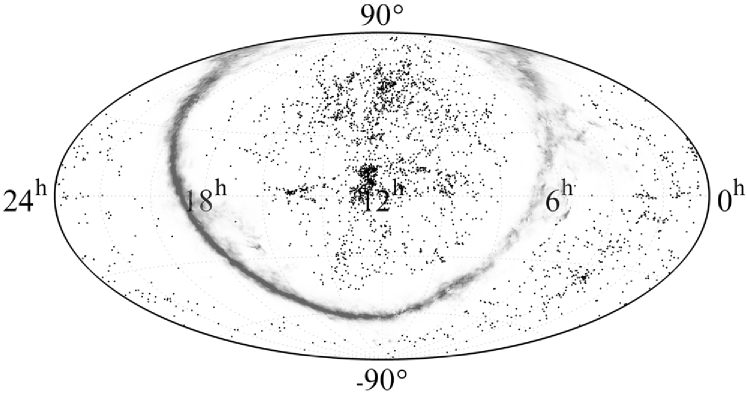
The top and bottom panels of Fig. 1 show the sky distribution of 7596 bright galaxies with and 2906 dwarf galaxies, excluded from the void identification procedure, respectively. Both sub-samples show the effects of clustering into groups and clusters, as well as the concentration to the equator of the Local Supercluster. The distribution of dwarfs is affected by their over-clustering in the volumes of the nearby Virgo cluster and the Canes Venatici I cloud, as well as high density of galaxies with known redshifts in the SDSS survey [13] region.
3 VOID IDENTIFICATION ALGORITHM
For each of the 7596 galaxies with within Mpc the Cartesian equatorial coordinates X, Y, Z were calculated. Then, in this volume, applying the galactic latitude restriction, we searched for the maximum radius for a sphere which does not contain any galaxies. For this purpose, we have carried out a search of all possible coordinates of the circumcenter and the radius of the sphere. The search increment has been set at 1.5 Mpc for the elapsed time reasoning (a compromise between the accuracy and required computer time). The limiting conditions were set so that the center of the sought void would lie within Mpc and not be located in the cone of the Milky Way .
Further, we looked for the following void with the maximum radius and containing no galaxies. The limiting conditions were supplemented with a new constraint: the center of the desired void has to be located outside the volume, occupied by the previous void. This procedure was repeatedly iterated accounting for the locations and sizes of all previous voids. This process was in progress until the number of voids has reached . The result is a collection of 179 empty spherical volumes with the radii of 12 to 6 Mpc, quite a few of which partially overlap each other.
The applied algorithm does obviously include several parameters, the choice of which affects the final list of voids. One of them is the minimum distance of the void center to the boundaries of the volume, as well as the minimum distance between the centers of the voids. Another parameter is the threshold absolute magnitude of the dwarf galaxies (), the possible presence of which in the empty volume is ignored. The third parameter is the minimum radius of the spherical void ( Mpc), which terminates the application of the algorithm.
Attempting to reject the sphericity of the identified empty volumes, as did Tikhonov and Karachentsev [5] significantly complicates the algorithm. In addition, a comparison of the SDSS DR7 data with the galaxy distribution of the Millennium 1 model catalog by Tavasoli et al. [23] has shown that the shape of voids tends to be spherical. If needed, nonspherical voids can be obtained within our approach by joining two or more intersecting spherical volumes in their association: a “dumbbell”, a “boomerang” or a “ string”.
4 A LIST OF EMPTY VOLUMES IN
THE LOCAL UNIVERSE
The results of our search for nearby spherical voids applying the above algorithm are presented in Table 1. The table columns include: (1) the number of the void in the procedure we have adopted, when each subsequent step yields the voids of an ever smaller radius; (2) the distance to the center of the void in Mpc; (3, 4) equatorial coordinates of the void’s center in degrees; (5, 6) the linear and angular diameter of the void; (7) notes, which stipulate the location of 12 most nearby voids in the constellations, and the membership of the given empty volume in the ever more extended formations, called the hypervoids (HV).
0mm
| No. | , | RA, | Dec, | , | , | Note | No. | , | RA, | Dec, | , | , | Note | ||
| Mpc | deg | deg | Mpc | deg | Mpc | deg | deg | Mpc | deg | ||||||
| (1) | (2) | (3) | (4) | (5) | (6) | (7) | (1) | (2) | (3) | (4) | (5) | (6) | (7) | ||
| 38 | 8.7 | 301 | 0 | 7.5 | 59 | HV1, | Aqr | 47 | 30.9 | 8 | 47 | 7.5 | 14 | HV1 | |
| 9 | 16.1 | 288 | –28 | 9.0 | 34 | HV1, | Sgr | 122 | 31.2 | 279 | 29 | 6.0 | 11 | HV1 | |
| 116 | 16.6 | 85 | –5 | 6.0 | 21 | HV1, | Ori | 26 | 31.5 | 141 | –72 | 7.5 | 14 | HV2 | |
| 34 | 17.6 | 275 | 20 | 7.5 | 25 | HV1, | Her | 161 | 31.8 | 16 | –28 | 6.0 | 11 | HV2 | |
| 27 | 18.4 | 117 | 24 | 7.5 | 24 | HV1, | Gem–Leo | 117 | 31.9 | 278 | –45 | 6.0 | 11 | HV1 | |
| 136 | 19.1 | 360 | 45 | 6.0 | 18 | HV1, | And | 159 | 32.0 | 329 | –8 | 6.0 | 11 | HV1 | |
| 147 | 20.1 | 347 | 4 | 6.0 | 17 | Psc–Peg | 100 | 32.1 | 258 | 25 | 6.0 | 11 | HV1 | ||
| 144 | 21.0 | 18 | 25 | 6.0 | 17 | HV1, | Psc | 114 | 32.3 | 83 | 68 | 6.0 | 11 | HV1 | |
| 90 | 21.5 | 238 | –25 | 6.0 | 16 | HV1, | Sco–Lib | 35 | 32.4 | 79 | –76 | 7.5 | 13 | HV2 | |
| 119 | 21.5 | 283 | 50 | 6.0 | 16 | HV1, | Dra | 146 | 32.4 | 347 | –52 | 6.0 | 11 | HV2 | |
| 135 | 21.8 | 309 | 12 | 6.0 | 16 | HV1, | Del | 148 | 32.7 | 35 | 43 | 6.0 | 11 | HV1 | |
| 31 | 23.9 | 248 | –70 | 7.5 | 18 | HV1, | Aps | 157 | 32.8 | 32 | –30 | 6.0 | 11 | HV2 | |
| 120 | 25.3 | 68 | –71 | 6.0 | 14 | HV2 | 156 | 32.9 | 29 | 33 | 6.0 | 11 | HV1 | ||
| 107 | 25.6 | 265 | 50 | 6.0 | 14 | HV1 | 2 | 33.1 | 339 | 39 | 12.0 | 21 | HV1 | ||
| 118 | 25.6 | 279 | –45 | 6.0 | 14 | HV1 | 49 | 33.3 | 319 | 27 | 7.5 | 13 | HV2 | ||
| 130 | 26.0 | 299 | –44 | 6.0 | 13 | HV1 | 165 | 33.5 | 22 | –16 | 6.0 | 10 | HV2 | ||
| 39 | 26.1 | 80 | 7 | 7.5 | 17 | HV1 | 56 | 33.7 | 3 | –21 | 7.5 | 13 | HV1 | ||
| 123 | 26.6 | 288 | 58 | 6.0 | 13 | HV1 | 124 | 34.0 | 291 | –68 | 6.0 | 10 | HV1 | ||
| 42 | 27.0 | 60 | 26 | 7.5 | 16 | HV1 | 166 | 34.3 | 337 | –3 | 6.0 | 10 | HV1 | ||
| 140 | 27.1 | 29 | 46 | 6.0 | 13 | HV1 | 51 | 34.6 | 3 | –34 | 7.5 | 13 | HV2 | ||
| 111 | 27.6 | 90 | –45 | 6.0 | 13 | HV2 | 13 | 34.7 | 50 | 18 | 9.0 | 15 | HV1 | ||
| 96 | 27.7 | 249 | 22 | 6.0 | 13 | HV1 | 40 | 34.7 | 77 | 12 | 7.5 | 13 | HV1 | ||
| 154 | 27.7 | 22 | 29 | 6.0 | 12 | HV1 | 3 | 34.7 | 59 | –60 | 10.5 | 18 | HV2 | ||
| 143 | 28.0 | 14 | –49 | 6.0 | 12 | HV2 | 104 | 34.8 | 263 | 0 | 6.0 | 10 | HV1 | ||
| 150 | 28.0 | 319 | –9 | 6.0 | 12 | HV1 | 112 | 35.0 | 90 | –47 | 6.0 | 10 | HV2 | ||
| 99 | 29.0 | 254 | –15 | 6.0 | 12 | HV1 | 44 | 35.4 | 65 | 10 | 7.5 | 12 | HV1 | ||
| 151 | 29.1 | 23 | –38 | 6.0 | 12 | HV2 | 75 | 35.4 | 205 | 10 | 6.0 | 10 | HV3 | ||
| 86 | 29.5 | 125 | –9 | 6.0 | 12 | 85 | 35.5 | 239 | –10 | 6.0 | 10 | HV1 | |||
| 79 | 29.7 | 204 | 6 | 6.0 | 12 | HV3 | 108 | 35.6 | 265 | 62 | 6.0 | 10 | HV1 | ||
| 8 | 30.1 | 101 | 40 | 9.0 | 17 | HV1 | 141 | 35.6 | 60 | –22 | 6.0 | 10 | HV2 | ||
| 95 | 30.5 | 252 | 11 | 6.0 | 11 | HV1 | 72 | 35.7 | 158 | 0 | 6.0 | 10 | |||
| No. | , | RA, | Dec, | , | , | Note |
|---|---|---|---|---|---|---|
| Mpc | deg | deg | Mpc | deg | ||
| (1) | (2) | (3) | (4) | (5) | (6) | (7) |
| 106 | 35.8 | 257 | –67 | 6.0 | 10 | HV1 |
| 15 | 35.9 | 324 | 10 | 9.0 | 15 | HV1 |
| 102 | 35.9 | 106 | 53 | 6.0 | 10 | HV1 |
| 145 | 35.9 | 303 | –5 | 6.0 | 10 | HV1 |
| 5 | 36.2 | 306 | 12 | 10.5 | 17 | HV1 |
| 139 | 36.7 | 294 | –10 | 6.0 | 9 | HV1 |
| 4 | 37.2 | 40 | –47 | 10.5 | 17 | HV2 |
| 105 | 37.4 | 263 | 50 | 6.0 | 9 | HV1 |
| 80 | 37.6 | 225 | 16 | 6.0 | 9 | HV3 |
| 18 | 37.6 | 152 | 31 | 7.5 | 11 | |
| 109 | 37.7 | 117 | –85 | 6.0 | 9 | HV2 |
| 11 | 37.7 | 288 | –23 | 9.0 | 14 | HV1 |
| 12 | 37.9 | 56 | 31 | 9.0 | 14 | HV1 |
| 91 | 38.0 | 210 | 71 | 6.0 | 9 | |
| 53 | 38.1 | 329 | 23 | 7.5 | 11 | HV1 |
| 126 | 38.1 | 27 | –80 | 6.0 | 9 | HV2 |
| 60 | 38.3 | 2 | –11 | 7.5 | 11 | HV2 |
| 168 | 38.3 | 0 | 31 | 6.0 | 9 | HV1 |
| 173 | 38.4 | 5 | 11 | 6.0 | 9 | |
| 97 | 38.6 | 257 | 33 | 6.0 | 9 | HV1 |
| 160 | 38.7 | 13 | –44 | 6.0 | 9 | HV2 |
| 115 | 39.0 | 84 | 67 | 6.0 | 9 | HV1 |
| 48 | 39.1 | 51 | –32 | 7.5 | 11 | HV2 |
| 74 | 39.4 | 216 | 11 | 6.0 | 9 | HV3 |
| 153 | 39.4 | 18 | –53 | 6.0 | 9 | HV2 |
| 54 | 38.5 | 39 | 13 | 7.5 | 11 | HV1 |
| 69 | 39.7 | 209 | 4 | 6.0 | 9 | HV3 |
It should be noted that the table shows only 89 voids, ranked according to the distance from the observer up to 40 Mpc, from the total number of 179.444The whole list of 179 voids can be obtained upon request to the first author. We have excluded from the list a half of the most distant voids based on the following reasoning. The distribution of the integral number of voids depending on the distance of their centers shows that near the far border of the considered volume in the range of – Mpc, there is approximately a double excess of voids, as compared with the homogeneous distribution . This excess is due to the decrease of the number density of galaxies with measured radial velocities in the most distant parts of the Local Universe. In addition, the lack of data on the galaxies outside the radius of 48 Mpc increases the probability of finding an empty volume and “adhesion” of these excessive voids on the far boundary.
3mm 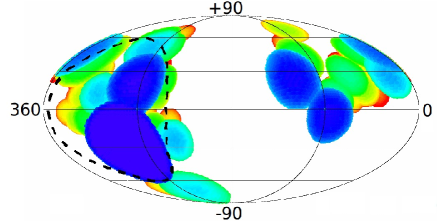
As follows from the last column of Table 1, 83 of 89 voids overlap with each other, forming three groups of hypervoids: HV1, HV2 and HV3 with 56, 22 and 5 spherical voids, respectively. Some parameters of these hypervoids: the total volume, the minimum and maximum distance of the hypervoid surface to the observer, the distance to the centroid of the hypervoid and its position in the sky are listed in Table 2. The nearest hypervoid HV1 is actually an extended and curved bunch of empty spherical volumes, which starts just beyond the boundary of the Local Group ( Mpc). The top panel of Fig. 2 represents the sky distribution of 56 voids, contained in HV1. The sizes of circles correspond to the angular scales of the spherical voids. Not to overshadow the other voids, the contour of the nearest void No. 38 (the front part of the Tully Local Void [8]) is described by a thick dashed line.
The HV1 hypervoid, starting from the Local Group in the Hercules–Aquila region, reaches the boundary of the considered volume and, passes round the Local Volume in a horseshoe shape, and approaches it from Gemini–Leo. The horseshoe shape of the low-density regions, covering the Virgo cluster is clearly visible in Fig. 6 of Courtois et al. [24].
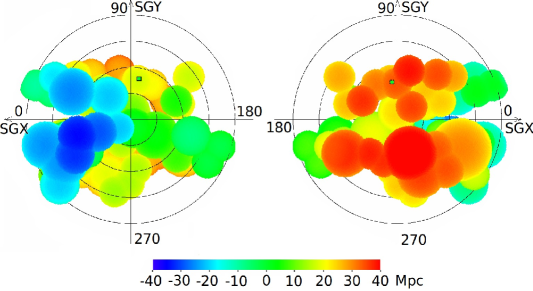
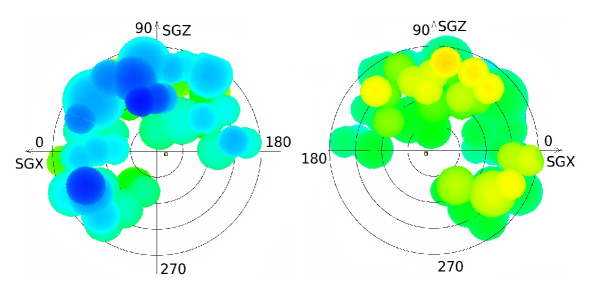
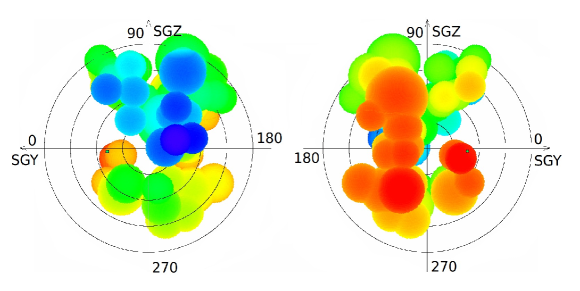
Fig. 3 shows the HV1 in more detail in three projections with respect to the supergalactic plane. Since the hypervoid has a complex structure, we show it from the direction of negative and positive axes perpendicular to the considered plane, in the left and right panels of the figure, respectively. The distances to the particular plane are characterized by the scale under the figure. The upper, middle and bottom panels show the projection on the SGX–SGY, SGX–SGZ, SGY–SGZ planes, respectively. Concentric circles have an increment of 10 Mpc. We can see that HV1 departs from the supergalactic plane quite far away, up to 40 Mpc. In the SGX–SGZ and SGY–SGZ projections we can clearly see that the hypervoid envelopes the Local Group. Comparing the projections of the HV1 hypervoid in Fig. 3 with the corresponding maps of the Local and Virgo voids from Courtois et al. [24], we can conclude that about 2/3 of the HV1 volume coincide with the total volume of Local and Virgo voids.
| Hypervoids | |||
| HV1 | HV2 | HV3 | |
| Number of voids | 56 | 22 | 5 |
| Volume, Mpc3 | 68469 | 23767 | 3440 |
| , Mpc | 1.4 | 19.4 | 23.8 |
| , Mpc | 13.8 | 30.5 | 35.8 |
| , Mpc | 46.9 | 47.6 | 45.6 |
| , deg | 22.2 | 2.4 | 14.2 |
| , deg | |||
| Sky region | Pegasus | Eridanus | Bootes |
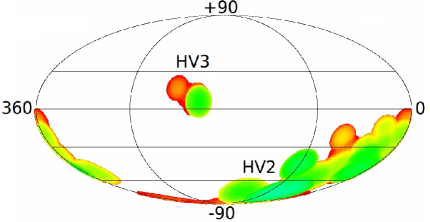
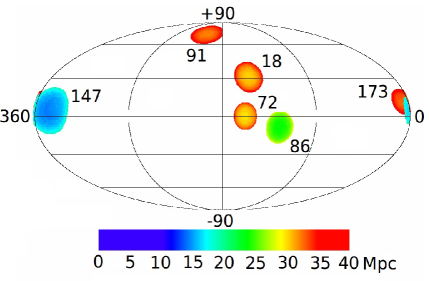
The middle panel of Fig. 2 reproduces the sky distribution of 22 spherical voids, merging into the HV2 hypervoid in the region of the Eridanus and 5 voids, belonging to a more compact HV3 hypervoid in the Bootes constellation. The bottom panel of Fig. 2 presents six separate spherical voids, the surfaces of which are not in contact with other empty volumes, identified by our algorithm. It is appropriate to recall here that we have restricted ourselves to the search for voids with linear radii of at least 6 Mpc. We can assume that there are plenty of small voids that overlap with the already identified voids, thus increasing their total volume.
5 DWARF POPULATION OF NEARBY VOIDS
Summing up the volume of voids presented in Table 1, we deduce that they occupy about 30% of the considered volume of the Local Universe within 40 Mpc. This estimate takes into account the fact that the spherical voids belonging to hypervoids overlap. Searching for nearby voids we have excluded from consideration 2906 dwarf galaxies. If this population was homogeneously distributed in the volume of the Local Universe, the expected number of dwarf galaxies in the voids would amount to about 1000. Their real number, which is within 40 Mpc and within 48 Mpc does not reach even a tenth of expected. This means that the empty volumes, devoid of galaxies with normal luminosity remain almost empty when considering the dwarf galaxies as well.
The list of dwarf galaxies, which are located inside of 89 voids we have identified, is presented in Table 3. The columns of the table contain the following information about the galaxies: (1) the name of the galaxy, or its presence in the SDSS, 6dF, 2MASX, KUG, HIPASS, APMUKS sky surveys; (2) the equatorial coordinates for the epoch J 2000.0; (3) the line-of-sight velocity relative to the centroid of the Local Group (km/s), used to determine the distance at the parameter km/s/Mpc; (4) morphological type; (5) apparent -band magnitude; (6) apparent ultraviolet magnitude , ( Å, Å) according to GALEX [27, 28]; (7) the flux logarithm in the line of neutral hydrogen ( in the Jykm/s units); (8) absolute magnitude; (9) the logarithm of the hydrogen mass , where is the distance in Mpc; (10) the logarithm of the star formation rate in the /yr units, where is the UV value, corrected for absorption [29], and the distance is expressed in Mpc; (11) the depth of bedding of the galaxy below the surface of the hypervoid (in Mpc); a dash in this column indicates that the galaxy is on the far edge of the considered volume ( Mpc), where different edge effects become significant; (12) notes: the crosses () mark the galaxies from the Catalog of Nearby Isolated Galaxies LOG [25], the pluses () mark the galaxies from the list of isolated dwarf galaxies in the Local supercluster [26]. The analysis of the data presented in Table 3 allows us to make the following conclusions.
a) The distribution of galaxies in the voids based on morphological types is distinctly shifted towards the latest types: Im, BCD, Ir, as compared to the samples of dwarfs in groups and general field. The dwarf galaxies of the Im, BCD, and Ir types make up about 65%, and along with Sm—up to 85% of the Table 3 sample. Note that among the very isolated galaxies of the LOG catalog [25] the irregular, BCD, and Sm objects represent about 51%. Only in two galaxies, J 0817+24 (dEn type) and J 1518–24 (Sb? type), their yellowish color indicates the dominance of the old stellar population. Both of them are located near the void surfaces and have neighbors with similar line-of-sight velocity values, i.e. they are members of diffuse groups, adjoining the voids. The excess of irregular blue galaxies and isolated galaxies among the samples of galaxies in the voids was also noted in [30, 31, 32].
b) Among 60 dwarf galaxies in the nearby voids, observed with the GALEX, the -fluxes were not detected in only four of them. Two of these galaxies were mentioned above as the group members and two others are projected on the center of a rich Coma cluster ( Abell 1656). The remaining objects of our sample follow a fairly clear correlation between
0mm
| Name | J 2000.0 | Type | Depth | Notes | |||||||
|---|---|---|---|---|---|---|---|---|---|---|---|
| (1) | (2) | (3) | (4) | (5) | (6) | (7) | (8) | (9) | (10) | (11) | (12) |
| ESO149–018 | 000714.5–523712 | 1744 | Sdm | 15.9 | 17.51 | 0.74 | –16.04 | 8.87 | –1.43 | 0.5 | |
| KK261 | 004058.7–261605 | 2726 | Ir | 17.6 | 18.20 | 0.42 | –15.31 | 8.94 | –1.32 | 1.1 | |
| LSBCF682–01 | 005731.9+102148 | 2936 | SBm | 17.9 | 19.47 | 0.40 | –15.40 | 8.98 | –1.58 | – | |
| ESO541–005 | 005918.1–203444 | 2006 | Sdm | 15.8 | 17.39 | 0.91 | –16.49 | 9.16 | –1.23 | 0.4 | |
| UGC00655 | 010401.2+415035 | 1084 | Sd | 14.4 | 16.30 | 1.21 | –16.75 | 8.93 | –1.17 | 0.6 | |
| LSBGF352–021 | 012658.6–350542 | 2068 | BCD | 17.5 | 19.18 | 0.36 | –14.85 | 8.63 | –1.92 | 4.3 | |
| UGC01038 | 012747.4+431506 | 1473 | Sm | 17.0 | 18.67 | 0.14 | –14.79 | 8.12 | –1.87 | 0.6 | |
| SDSS | 013708.1–003354 | 3044 | Sm | 17.1 | 18.68 | 0.00 | –16.12 | –1.36 | – | ||
| ESO355–005 | 021839.7–363152 | 2399 | Sm | 17.2 | 18.45 | 0.58 | –15.46 | 8.98 | –1.50 | 0.5 | |
| ESO298–033 | 022128.7–384814 | 2142 | Im | 16.8 | 18.53 | 0.51 | –15.62 | 8.81 | –1.64 | 0.2 | |
| LCRS | 025224.5–411633 | 3470 | BCD | 18.1 | 19.33 | –15.37 | –1.54 | – | |||
| 6dF | 051556.2–364418 | 1867 | Ir | 16.7 | 18.30 | 0.14 | –15.51 | 8.33 | –1.59 | 0.3 | |
| ESO306–010 | 053415.6–391010 | 1921 | Sm | 16.7 | 17.91 | 0.76 | –15.54 | 8.97 | –1.44 | 2.4 | |
| ESO554–017 | 053557.2–211451 | 1385 | Sd | 16.7 | – | –14.83 | – | 0.6 | |||
| UGC03672 | 070627.6+301919 | 964 | Im | 15.4 | 17.23 | 1.23 | –15.52 | 8.84 | –1.62 | 1.6 | |
| UGC03876 | 072917.5+275358 | 811 | Scd | 13.7 | – | 1.06 | –16.72 | 8.52 | – | 0.3 | |
| SDSS | 080158.9+212219 | 1343 | Ir | 17.7 | 19.69 | –13.84 | –2.40 | 6.1 | |||
| LCSBS1123P | 081715.9+245357 | 1832 | dEn | 17.3 | 23 | 0.38 | –14.88 | 8.55 | –3.48 | 0.5 | |
| SDSS | 082712.8+265127 | 1779 | Im | 17.4 | – | – | –14.76 | – | – | 0.7 | |
| SDSS | 083641.1+051625 | 2933 | BCD | 17.8 | 18.94 | –15.34 | –1.50 | – | |||
| 2MASX | 083735.5+074831 | 1280 | BCD | 16.7 | 17.93 | 0.43 | –14.66 | 8.29 | –1.80 | 1.3 | ∗ |
| CAM0840+1044 | 084236.6+103314 | 3437 | BCD | 17.6 | 19.21 | –15.98 | –1.39 | – | |||
| SDSS | 091001.7+325660 | 1388 | Ir | 17.1 | 18.95 | – | –14.39 | – | –2.17 | 1.0 | |
| 2MASX | 091448.8+330115 | 1446 | BCD | 16.8 | 18.52 | – | –14.76 | – | –1.97 | 0.5 | |
| KUG1028+412 | 103118.4+410226 | 2568 | BCD | 17.6 | – | – | –15.18 | – | – | 0.4 | |
| SDSS | 103950.9+564403 | 1216 | Ir | 17.5 | 17.87 | – | –13.64 | – | –1.90 | – | |
| HS1059+3934 | 110209.9+391846 | 3267 | BCD | 17.7 | 18.51 | – | –15.63 | – | –1.26 | – | |
| APMUKS | 110541.0–000602 | 3160 | Sm | 18.0 | 19.47 | –15.42 | –1.55 | – | ∗∗ | ||
| SDSS | 112149.2+585434 | 1596 | Ir | 17.0 | 18.65 | – | –14.73 | – | –1.98 | – | |
| SDSS | 124459.3+525203 | 2808 | BCD | 18.4 | 19.45 | – | –14.59 | – | –1.78 | – | |
| ABELL1656:3237 | 125941.3+275015 | 3224 | BCD | 19.7 | 23 | – | –13.57 | – | –3.10 | – | |
| ABELL1656:2538 | 130040.1+274851 | 3495 | BCD | 20.3 | 23 | – | –13.14 | – | –3.03 | – | |
| SDSS | 130905.4+134819 | 3223 | Ir | 18.0 | 20.16 | –0.38 | –15.32 | 8.28 | –1.92 | – | |
| SDSS | 131011.7+135116 | 3279 | BCD | 18.1 | 20.51 | –0.25 | –15.26 | 8.42 | –2.04 | – | |
| SDSS | 133753.5+635510 | 2813 | BCD | 17.8 | 20.52 | – | –15.21 | – | –2.19 | 1.0 | |
| SDSS | 135031.2–013758 | 2366 | Im | 19.0 | 19.80 | –13.80 | –1.93 | 0.8 | |||
| KKR2 | 140626.9+092133 | 3213 | Sm | 17.6 | 19.17 | 0.26 | –15.74 | 8.92 | –1.51 | 0.6 | |
| SDSS | 151454.6+341439 | 2910 | Im | 18.3 | 19.66 | – | –14.79 | – | –1.81 | – | |
| 2MASX | 151844.7–241051 | 1881 | Sb? | 16.6 | 23 | – | –16.13 | – | –3.08 | 0.9 | |
| SDSS | 151939.3+385255 | 3122 | BCD | 17.5 | 19.44 | – | –15.73 | – | –1.68 | – | |
| SDSS | 152013.6+400301 | 2823 | BCD | 17.8 | 19.55 | – | –15.22 | – | –1.80 | – | |
| SDSS | 152644.5+403448 | 2890 | BCD | 17.8 | 20.16 | – | –15.26 | – | –2.03 | – | |
| KKR26 | 161644.6+160509 | 2347 | Im | 17.8 | 19.03 | 0.45 | –14.93 | 8.83 | –1.67 | 0.8 | |
| LSBCF585–V01 | 162558.6+203949 | 2106 | Ir | 17.9 | 18.98 | 0.11 | –14.65 | 8.40 | –1.70 | 4.1 | |
| SDSS | 163424.7+245741 | 1131 | BCD | 18.1 | 20.40 | –13.03 | –2.86 | 0.4 | |||
| SDSS | 170517.4+355222 | 1184 | Im | 17.5 | 18.69 | – | –13.65 | – | –2.20 | 0.7 | |
| HIPASS1752–59 | 175251.4–594049 | 2596 | Ir | 17.2 | – | 0.52 | –15.89 | 8.99 | – | 0.6 | |
| UGC11109 | 180414.0+464414 | 1820 | Sm | 17.2 | 18.25 | 0.72 | –14.97 | 8.88 | –1.58 | 3.9 | |
| UGC11220 | 182325.5+405643 | 1706 | Sm | 16.7 | 17.00 | 0.98 | –15.34 | 9.08 | –1.13 | 1.7 | |
| HIPASS1926–74 | 192727.1–740458 | 2444 | BCD | 17.0 | – | 0.36 | –15.91 | 8.78 | – | 2.4 | |
| KK246 | 200357.4–314054 | 572 | Ir | 17.1 | 20.01 | 0.90 | –13.70 | 8.06 | –2.43 | 4.5 | ∗∗∗ |
| 6dF | 210804.9–471941 | 832 | BCD | 15.9 | 18.12 | –14.53 | –2.24 | 0.8 | |||
| LSBCF743–01 | 211845.4+082202 | 3203 | Sm | 17.5 | 18.13 | 0.46 | –16.00 | 9.11 | –0.96 | 0.6 | |
| CGCG426–040 | 212006.0+115506 | 1415 | BCD | 16.4 | 18.64 | 0.34 | –15.41 | 8.28 | –1.82 | 1.7 | |
| SDSS | 212202.3+095311 | 3237 | BCD | 17.7 | – | –15.77 | – | 0.4 | |||
| ESO531–001 | 213152.0–235632 | 2668 | Sm | 17.1 | 18.47 | 0.09 | –15.92 | 8.59 | –1.32 | – | |
| UGC11771 | 213527.5+232805 | 1951 | Sd | 16.4 | 18.60 | 0.64 | –16.17 | 8.86 | –1.47 | 0.5 | |
| UGC11813 | 214731.1+220951 | 2124 | Sm | 17.3 | 19.07 | 0.71 | –15.51 | 9.01 | –1.54 | 1.5 | |
| SDSS | 223036.8–000637 | 1758 | BCD | 17.4 | – | –0.22 | –14.81 | 7.92 | – | 0.4 | |
| ADBS | 225558.3+261011 | 2930 | BCD | 17.7 | 19.21 | 0.35 | –15.79 | 8.93 | –1.33 | 0.9 | |
| LSBCF469–02 | 225721.5+275852 | 3233 | Sm | 18.3 | 18.25 | 0.46 | –15.21 | 9.12 | –1.01 | – | |
| SDSS | 230511.2+140346 | 1801 | BCD | 17.3 | 19.38 | –15.52 | –1.52 | 0.3 | |||
| 6dF | 231803.9–485936 | 2275 | BCD | 16.9 | 18.42 | –15.62 | –1.56 | 3.8 | |||
| KKR75 | 232011.2+103723 | 1703 | Ir | 18.0 | 19.48 | 0.54 | –14.05 | 8.65 | –2.11 | 1.9 | |
| LSBCF750–04 | 234420.2+100705 | 1726 | Sd | 17.3 | 18.62 | 0.40 | –14.80 | 8.51 | –1.74 | 0.7 | |
| UGC12771 | 234532.7+171512 | 1535 | Im | 16.9 | 18.35 | 0.46 | –14.96 | 8.48 | –1.72 | 0.4 | |
| APMUKS | 234650.9–301106 | 2926 | BCD | 18.2 | 19.61 | –14.89 | –1.80 | 0.7 | |||
| LSBCF750–V01 | 235419.6+105636 | 1164 | Ir | 18.0 | 19.66 | –13.41 | –2.37 | 0.4 |
Notes:
The LEDA specifies a significant difference in the
heliocentric velocity estimates of this galaxy from the SDSS
optical data ( km/s) and from the HI measurements
in the HIPASS ( km/s). Re-processing of the optical
spectrum yields km/s, which is close to the HIPASS
estimate.
The line-of-sight velocity value of this the galaxy,
obtained in [45] needs to
be confirmed.
Column (3) indicates the formal value of the line-of-sight
velocity, corresponding to the distance of the galaxy
7.83 Mpc [9] and the parameter
km/s/Mpc. Having the line-of-sight velocity of
km/s, this galaxy is moving to us from the depth of the void with
the peculiar velocity of –130 km/s.
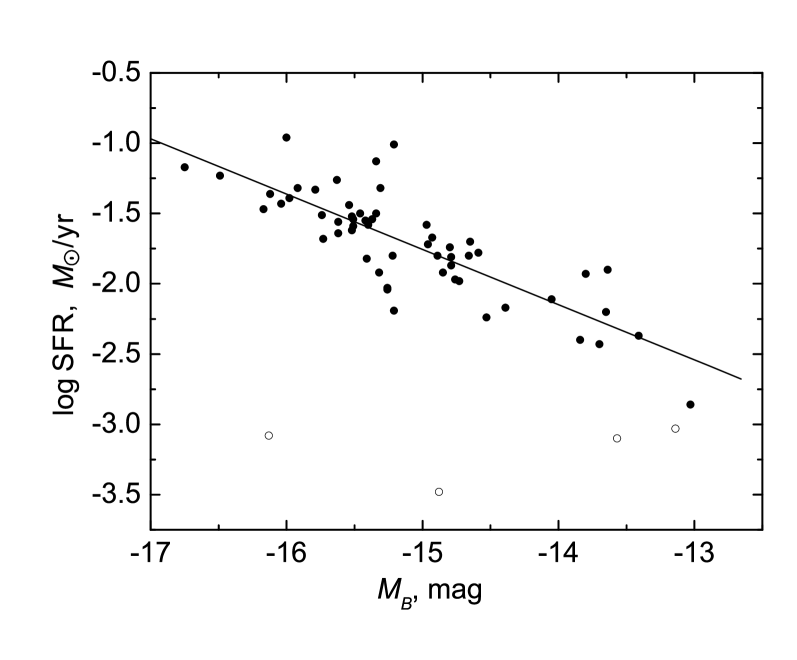
and absolute magnitude of the galaxy (see Fig. 4) with the correlation coefficient and the median value of the specific star formation rate yr, typical of the late-type dwarfs in the Local Volume [33].
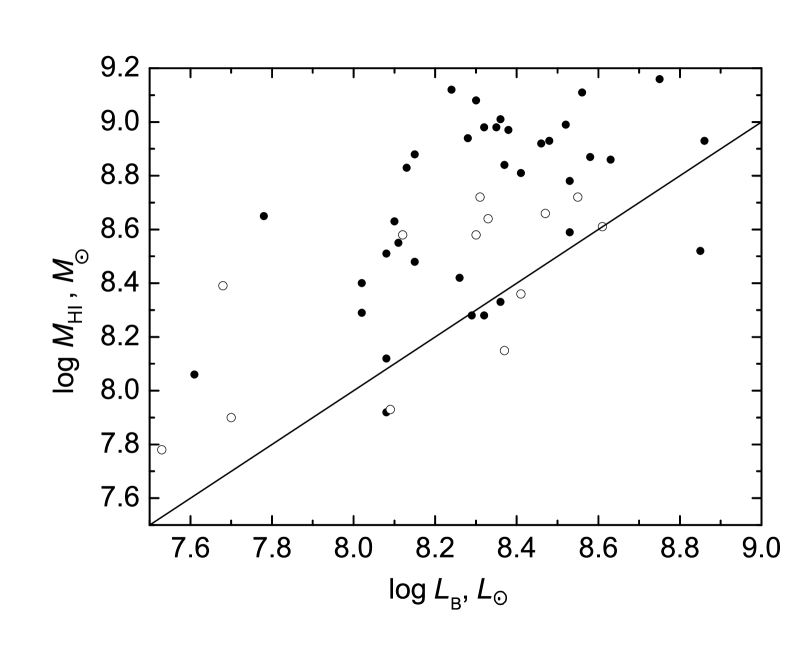
c) The distribution of dwarf galaxies in the voids based on the hydrogen mass logarithm and -luminosity is shown in Fig. 5 by the solid circles. The upper limits of the hydrogen mass estimates are shown by unfilled circles. As follows from these data, the dwarfs in the voids have a high hydrogen abundance per luminosity unit. The median value for them, proves to be approximately three times higher than for the Ir, Im, and BCD galaxies in the groups and general field [34]. In other words, dwarf galaxies in the voids possess increased gas reserves compared to the galaxies of the same type located in denser environments, what was repeatedly mentioned by different authors [17, 26, 35, 36, 37, 43, 44]. Possessing normal star formation rates (SFR) per luminosity unit, , the dwarfs in the voids are able to maintain the observed SFR on the scale of about 20–30 Gyr. At the same time, the studies [31, 38] considering the properties of galaxies in the voids in much larger volumes () demonstrate that although in general the void galaxies are bluer and fainter than the cluster galaxies, however, in the same luminosity range no differences in colors or SFRs are observed.
d) Figure 6 shows the distribution of 48 galaxies in the nearby ( Mpc) voids by the absolute magnitude and the depth of bedding under the hypervoid’s surface. We can see that only a quarter of these galaxies are located in the voids at depths exceeding 1.5 Mpc. Recall that in our algorithm the accuracy with which the position of the spherical void center was determined was exactly 1.5 Mpc. Consequently, plenty of dwarf galaxies in this boundary layer can be located outside the voids. In any case, the population of dwarf galaxies in the cores of voids ( Mpc) is represented literally by single objects, such as their nearest and most famous representative KK 246 [39, 40, 41]. Note that only 4 out of 13 galaxies that are located in the middle of voids are “new”. The nine remaining objects are specified as isolated in the lists of [25, 26]. Since the selection criteria in this and the two above studies were completely different, we have to expect that these nine galaxies are very isolated objects. In Fig. 6 and Table 3 all the galaxies, identified with the objects from the lists of [25, 26] are marked by the corresponding signs.

Despite the poor statistics, note a certain tendency of declining dwarf galaxy luminosity with increasing depth below the hypervoid surface. The same feature was noted earlier by Chengalur and Pustilnik [42]. From general considerations we may assume that such objects have record low metallicities. This makes them interesting for the spectral observations.
e) All the dwarf galaxies we have discovered in the nearby voids have absolute magnitudes brighter than . Their distribution by distance and absolute magnitude in Fig. 7 shows that this limit may be due to the distance selection effect. However, the nature of the data in Fig. 7 does not contradict the assumption about the existence of a luminosity threshold, in the dwarf population of voids. This circumstance may have a vital importance for understanding the nature of empty cosmic volumes.
6 CONCLUDING REMARKS
To search for empty volumes in the Local Universe, we used an algorithm similar to the approach of Patiri et al. [14], only with a much more stringent restriction on the luminosity of galaxies, evading the voids. As a result we have obtained a list of nearby spherical voids with the typical diameter of 15 Mpc, which is about three times smaller than that in [14]. However, the total volume of our voids is about 30% of the volume of the Local Universe within 40 Mpc. The distribution of the centers of spherical voids proved to be very far from the Poisson distribution. More than 90% of the voids overlap, forming three hypervoids composed of 56, 22 and 5 initial voids, respectively. The closest and most populated hypervoid HV1 comprises the Tully Local Void and extends in a horseshoe shape, covering the central region of the Local Supercluster of galaxies.

Eighty-nine voids we have identified with the center distances within Mpc from us contain 48 late-type dwarf galaxies with absolute magnitudes in the range of . These galaxies have active star formations and gas reserves per luminosity unit by about 2–3 times higher than those in the dwarf galaxies of the same type, located in denser environments. The abundance of neutral hydrogen in void galaxies was repeatedly noted by different authors [17, 26, 35, 36, 37, 43, 44]. The void dwarfs reveal a tendency of evading the depths of the voids and hypervoids. In fact, the central regions of voids are devoid of not only normal, but also dwarf galaxies. According to a rough estimate, in the hearts of the voids having the sizes of about a half of the diameter, the average stellar mass density is two orders lower than the average cosmological density.
We should note here the following important fact. We have defined the contours of the nearby voids and identified the dwarf population there in the space of radial velocities rather than that of actual distances. The presence of collective motions of galaxies with the amplitudes of 300 km/s can lead to a significant distortion of void shapes and the global pattern of their distribution. Obviously, this situation will gradually become clearer as more and more data is obtained on the individual distances of galaxies.
As we can see from Table 3, about one-third of dwarf galaxies in
the nearby voids ensue from the photometric and spectral sky
survey SDSS [13]. An extension of this fruitful
survey to the other remaining regions of the northern sky, as well
as a prospective similar mass survey in the southern sky will soon
allow us to better understand the characteristics of the dwarf
population of voids, in particular, to find out whether there
exist any ultra-faint dwarf objects with luminosities fainter
than and hydrogen masses lower than
in the empty cosmic volumes.
Acknowledgments
The present study has made use of the SDSS (http://www.sdss.org), HyperLeda
(http://leda.univ-lyon1.fr) and NED (http://nedwww.ipac.caltech.edu) databases. This study was made
owing to the support of the following grants: the grants of the
Russian Foundation for Basic Research (project nos.
12-02-91338-NNIO, 11-02-00639,
11-02-90449-Ukr-f-f, the State Foundation for Basic
Research of the Ukraine F40.2/49, the Cosmomicrophysics program of
the National Academy of Sciences of the Ukraine, as well as by the
Ministry Education and Science of the Russian Federation (state
contract no. 14.740.11.0901) and project
2012-1.5-12-000-1011-004.
References
- [1] M. Joeveer, J. Einasto, and E. Tago, MNRAS, 185, 357 (1978).
- [2] S. A. Gregory and L. A. Thompson, ApJ, 222, 784 (1978).
- [3] R. P. Kirshner, A. Oemler, P. L. Schechter, and S. A. Shectman, ApJ, 248, L57 (1981).
- [4] U. Lindner, J. Einasto, M. Einasto, et al., A&A, 301, 329 (1995).
- [5] A. V. Tikhonov and I. D. Karachentsev, ApJ, 653, 969 (2006).
- [6] R. van de Weygaert and E. Platen, arXiv:0912.2997 (2009).
- [7] P. J. E. Peebles, ApJ, 557, 495 (2001).
- [8] R. B. Tully and J. R. Fisher, Nearby Galaxies Atlas, (Cambridge Univ. Press, Cambridge, 1987).
- [9] I. D. Karachentsev, A. E. Dolphin, R. B. Tully, et al., AJ, 131, 1361 (2006).
- [10] T. P. McIntyre, R. F. Mibchin, E. Momjian, et al., ApJ. 739, 26 (2011).
- [11] O. G. Nasonova and I. D. Karachentsev, Astrophysics, 54, 1 (2011).
- [12] M. Colless, G. Dalton, S. Maddox, et al., MNRAS, 328, 1039 (2001).
- [13] K. N. Abazajian, J. K. Adelman-McCarthy, M. A. Aqueros, et al., ApJ Supplement, 182, 543 (2009).
- [14] S. G. Patiri, J. Betancort-Rijo, F. Prada, et al., MNRAS, 369, 335 (2006).
- [15] F. Hoyle, M. S. Vogeley, and D. Pan, arXiv:1205.1843 (2012).
- [16] A. Fairall, Large-Scale Structures in the Universe (Wiley, New York, 1998).
- [17] S. A. Pustilnik and A. L. Tepliakova, MNRAS, 415, 1188 (2011).
- [18] A. Saintonge, R. Giovanelli, M. P. Haynes, et al., AJ, 135, 588 (2008).
- [19] R. Giovanelli, M. P. Haynes, B. R. Kent, et al., AJ, 130, 2598 (2005).
- [20] I. D. Karachentsev, V. E. Karachentseva, O. V. Melnyk, et al., Astrophysical Bulletin, 67, 353 (2012).
- [21] G. Paturel, C. Petit, P. Prugniel, et al., A&A, 412, 45 (2003).
- [22] T. N. Jarrett, T. Chester, R. Cutri, et al., AJ, 119, 2498 (2000).
- [23] S. Tavasoli, K. Vasei, and R. Mohayaee, arXiv:1210.2432; submited to MNRAS.
- [24] H. M. Courtois, Y. Hoffman, R. B. Tully, and S. Gottloeber, ApJ, 744, 43 (2012).
- [25] I. D. Karachentsev, D. I. Makarov, V. E. Karachentseva, and O. V. Melnyk, Astrophysical Bulletin, 66, 1 (2011).
- [26] V. E. Karachentseva, I. D. Karachentsev, and M. E. Sharina, Astrophysics 53, 462 (2010).
- [27] D. C. Martin, J. Fanson, D. Schiminovich, et al., ApJ, 619, L1 (2005).
- [28] Gil de Paz A., S. Boissier, B. F. Madore, et al., ApJ Supplement, 173, 185 (2007).
- [29] J. C. Lee, A. Gil de Paz, R. C. Kennicutt, et al., ApJ Supplement, 192, 6 (2011).
- [30] F. Hoyle, R. R. Randall, M. S. Vogeley, and J. Brinkmann, ApJ Supplement, 620, 618 (2005).
- [31] S. G. Patiri, F. Prada, J. Holtzman, et al., ApJ Supplement, 372, 1710 (2006).
- [32] I. B. Vavilova, O. V. Melnyk, and A. A. Elyiv, Astron. Nachr. 330, 1004 (2009).
- [33] I. D. Karachentsev, D. I. Makarov, and E. I. Kaisina, submitted to ApJ Supplement.
- [34] I. D. Karachentsev, V. E. Karachentseva, W. K. Huchtmeier, and D. I. Makarov, AJ, 127, 2031 (2004).
- [35] W. K. Huchtmeier, U. Hopp, and B. Kuhn, A&A 319, 67 (1997).
- [36] S. A. Pustilnik, J. M. Martin, W. K. Huchtmeier, et al., A&A 389, 405, (2002).
- [37] S. A. Pustilnik, J. M. Martin, A. L. Tepliakova, and A. Y. Kniazev, MNRAS, 417, 1335 (2011).
- [38] G. Sorrentino, V. Antonuccio-Delogu, and A. Rifatto, A&A 460, 673 (2006).
- [39] A. Begum, J. N. Chengalur, I.D. Karachentsev, et al., MNRAS, 386, 1667 (2008).
- [40] K. Kreckel, P. J. E. Peebles, J. H. van Gorkom, et al., AJ, 141, 204 (2011).
- [41] G. Gentile, G. V. Angus, and B. Famaey et al., A&A, 543, A47 (2012).
- [42] J. N. Chengalur and S. A. Pustilnik, MNRAS, (in press).
- [43] R. Stanonik, E. Platen, M. A. Aragon-Calvo, et al., Astronom. Soc. Pacific Conf. 421, 107 (2010).
- [44] K. Kreckel, E. Platen, M. A. Aragon-Calvo, et al., AJ, 144, 16 (2012).
- [45] C. Impey, V. Burkholder, and D. Sprayberry, AJ, 131, 2341 (2001).