ON THE STATISTICAL DESCRIPTION OF THE INBOUND AIR TRAFFIC OVER HEATROW AIRPORT
Abstract
We present a model to describe the inbound air traffic over a congested hub. We show that this model gives a very accurate description of the traffic by the comparison of our theoretical distribution of the queue with the actual distribution observed over Heathrow airport. We discuss also the robustness of our model.
1 Introduction
Airport congestion is a persistent phenomena in air traffic. Air traffic congestion is significant
even if the principal airports in Western and Central Europe are
treated as “fully coordinated”111In the U.S., scheduling
limits are applied only to New York
region airports, Washington/Reagan, and Chicago/O’Hare airport,
under the High Density Rule (HDR).,
meaning essentially that the number of flights that can be
scheduled there per hour (or other unit of time) is not allowed to
exceed the “declared capacity” of the airports [6]. In
2011, the average additional Arrival Sequencing and Metering
Area (ASMA) time222 The Arrival Sequencing and Metering Area (ASMA) is
the airspace within a radius of 40NM around an airport. The ASMA
additional time is a proxy for the average arrival runway queuing
time on the inbound traffic flow, during times when the airport is
congested.
at the top 30 european airports amounted to 2.9 minutes per arrival increasing
by +5% with respect to the previous year. On this statistic, London
Heathrow is a clear outlier, having by far the highest level of
additional time within the last 40NM with 8.2 minutes per arrival,
followed by Frankfurt and Madrid [9]. Similar situations occur
in the US [4].
Quoting the 2011 Performance Review Report: “Airports are key
nodes of the aviation network and airport capacity is considered to be
one of the main challenges to future air traffic growth. This requires
an increased focus on the integration of airports in the ATM network
and the optimisation of operations at and around airports”.
Several approaches have been proposed to mitigate congestion and
resolve demand-capacity imbalances. At operational level
(short-term), these approaches consider the operational adjustment of
air traffic flows to match available capacity. So far, the most popular
approach in resolving these short-term periods of congestion
has shown to be the allocation of ground delays [15]. The Ground
Holding Problem considers the development of strategies for allocating
ground delays to aircraft, and has received considerable
attention [16, 7, 3, 1].
However, these air traffic
flow management strategies might be suboptimal because they do not
capture the inherent unpredictability of arrivals at
airports. [4] showed that changes in the current
practice
for setting airport arrival rates can lead to significant benefits in
terms of additional ASMA times.
In view of the current situation, it is extremely important to have a reliable tool to measure and forecast congestion in the Air Traffic System. However, in developing such a tool there are some issues to address. First of all, the stochastic models developed so far to describe air traffic congestion are not reliable.
The interarrival times between two consecutive arrivals at an airport seem to be distributed exponentially, leading to the hypothesis that the arrivals are Poissonian [17]. Nonetheless, the results of the classical queueing theory with Poisson arrivals do not fit with the observed data; see Figure 3 below.
A second issue regards the validation of the stochastic processes. In fact, it is not easy to quantify the amount of congestion, because it is difficult to evaluate the number of aircrafts in queue.
In this paper we propose a straightforward description of the queueing process at a very congested airport. We study the inbound air traffic at Heathrow airport. We compute the time spent in queue calculating the difference between the actual and the minimal time spent in the vicinities of the airport. The extra time is considered to be time spent in queue (the details of this simple computation are in Section 3). This procedure solves the problem of evaluating the distribution of the queue in this very congested case.
We present a quite natural mathematical model for the arrival process of the aircraft, that is very different from the Poisson process but has a distribution of the interarrival times very close to the exponential. The idea of the process, that will be described in details in the next section, is easy: we start with a deterministic schedule, organized in such a way that the aircraft should arrive in a deterministic and homogeneous way (say with a constant interarrival time similar to the time needed for a landing), and then we add an independent random variable to each of this scheduled arrivals. The resulting list of times of arrival is then mixed up by the random delay. The process obtained in this way has a long history [13]. It is easy to study numerically but quite difficult to treat from a mathematical point of view, though significative progresses have been recently made [11, 10].
The simulations we present in this paper show the following facts:
-
1.
The fit with the real data over Heathrow airport is really excellent, and it is incomparably better than the analogous calculation assuming Poissonian arrivals. This will be the subject of the discussion presented in Section 4.
-
2.
The distribution of the random delays added to each arrival time has a very small impact on the distribution of the queue. The only relevant parameter is the variance of the random delays. In order to have a reliable forecast of the traffic over a congested hub one can use the simplest distribution, e.g. the uniform one. This point will be discussed in details in Section 5.
2 Description of the arrival process
The Pre-Scheduled Random Arrivals (PSRA) process is defined as follows. Denoting with the expected interarrival time between two consecutive aircrafts, the actual arrival time of the -th aircraft () is defined by
| (1) |
where ’s are i.i.d. continuous random variables with probability density and variance . Without loss of generality we can assume , as affects only the initial configuration of the system.
When is large the process defined in (1) weakly converges to the Poisson process, in particular it is possible to prove that its generating function tends pointwise to the generating function of the Poisson process [11]. This property also holds for a variant of the PSRA process that takes into account the possibility of flights’ cancellation as in [4]. This variant is an independent thinning version of this process, i.e. a process in which each arrival has an independent probability to be cancelled (and the complementary probability to be a true arrival). In Air Traffic Management (ATM) contexts it is natural to couple a PSRA arrival process with a deterministic service process with expected service rate . In this case the traffic intensity of the thinned process is clearly .
Although both the PSRA process and its thinned version are very similar to the Poisson process for large , they present a crucial difference with the latter: as soon as remains finite, the PSRA process is negatively autocorrelated. The covariance between the number of arrivals at two consecutive time periods and , where is the number of arrivals in and is the number of arrivals in , is given by
where is the probability that the -th aircraft arrives in the interval ; for details, see [11]. A negative covariance means that and are inversely correlated, thus a congested time slot is likely to be followed or preceded by a slot with less-than-expected arrivals. Moreover, this proves that the hypothesis of independence for and , numbers of arrivals in different time slots, is not correct, unless we are in the limit .
Simulations show that if we neglect this correlation and we try to describe a queueing system with independent interarrival times, we obtain a gross overestimate for the average length of the queue. This error is particularly rough when the system is congested (traffic intensity near to ), see Figure 3 below.
3 Real data from London Heathrow airport
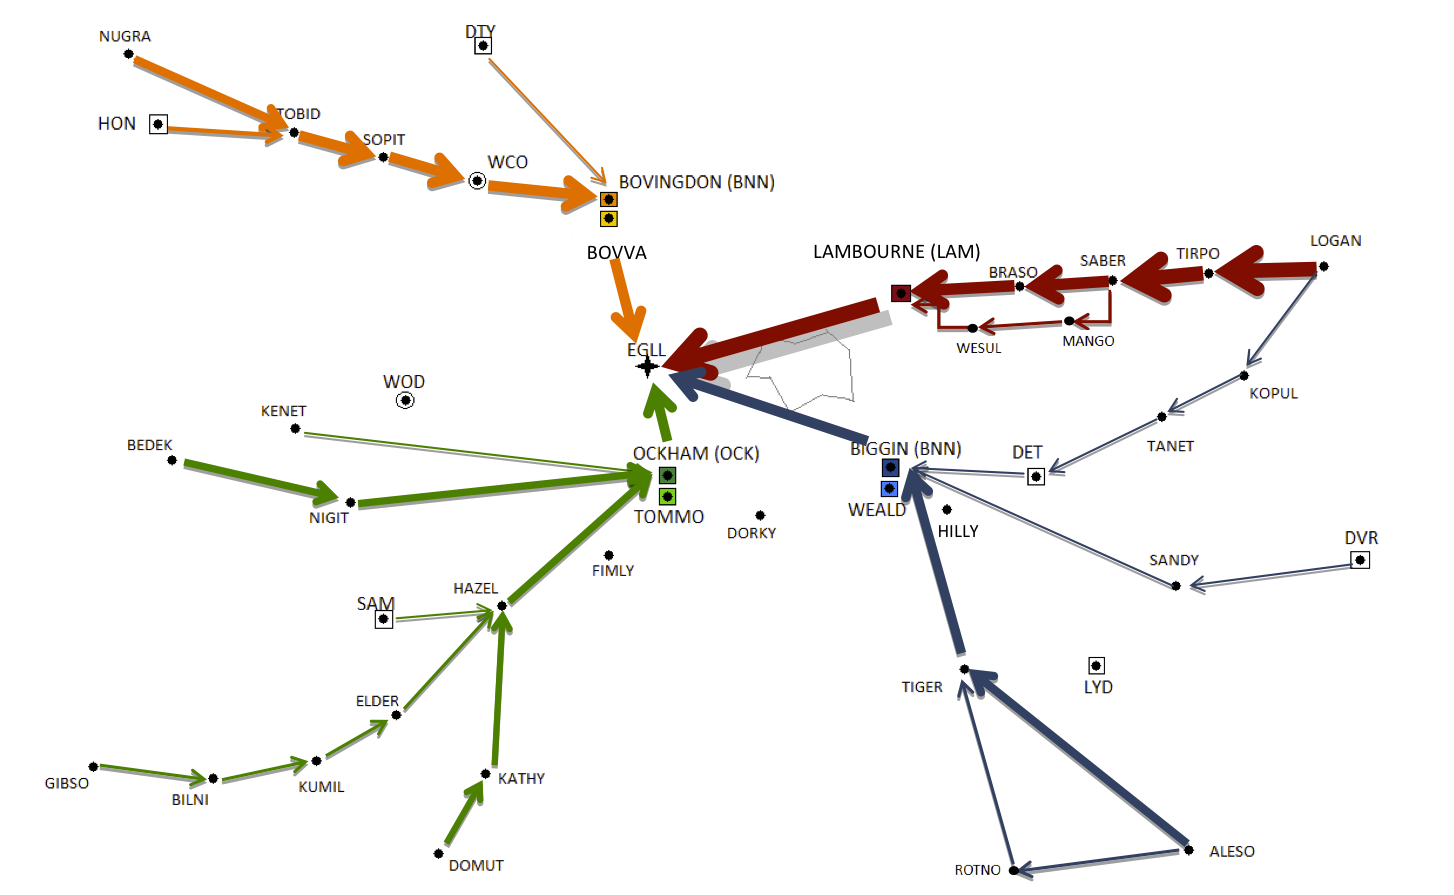
The London Heathrow airport is served by two parallel independent runways. The runways are used in a separate mode, meaning that one runway is used only for departures and the other is used only for arrivals. Aircraft occasionally are cleared to land on the departure runway to minimise delay subject to certain delay criteria. According to the ICAO Standard Arrival Chart, Heathrow has 28 STAR (standard arrival route) starting from 11 entry points; see Figure 1.

In the intent of this analysis, actual data are used ranging from July 20 to July 30, 2010. This big database include 7,140 flights. A first analysis of these data shows that most of the flights (about 70%) enter from three entry points: LOGAN, ALESO and NUGRA and pass on STAR LAM 3A, BIG 3B and BNN 1B, respectively. Figure 2 shows a qualitative layout of the incoming air traffic in the aforesaid lapse of time.
We limited ourselves to the three entry points mentioned above, and starting from this restricted database we observed that the traffic intensity of the system was not completely constant during the day but in the two slots from 6:00 a.m. to 10:30 a.m. and from 4:00 p.m. to 8:00 p.m. For each flight landing in one of these two time intervals the entrance time in the system has been subtracted to the landing time. Let us call this difference approaching time. To obtain the amount of time each flight has been waiting in queue, we subtract from the approaching time of any aircraft entering from a given entry point the minimun approaching time from the same entry point. Note that the service time is nearly deterministic. This implies that the length of the queue that a given aircraft had to wait is proportional to the time spent in queue by that aircraft. Hence, the empirical distribution of the time spent in queue is equivalent to that of the queue lenght. Eventually, we have gathered the data from the three distinct queues and we have normalized the resulting histogram, which can be seen in Figure 3. All in all, the final number of flights considered was 4139.
From the data we could also see that in the period above the average number of flights entering in the airport fly area per hour is 40, while the maximum number of flights landing on a single runway is 41 per hour. Therefore, in this analysis we will take the following measured value for the traffic intensity ,
4 Simulations of PSRA and comparison with Heathrow data
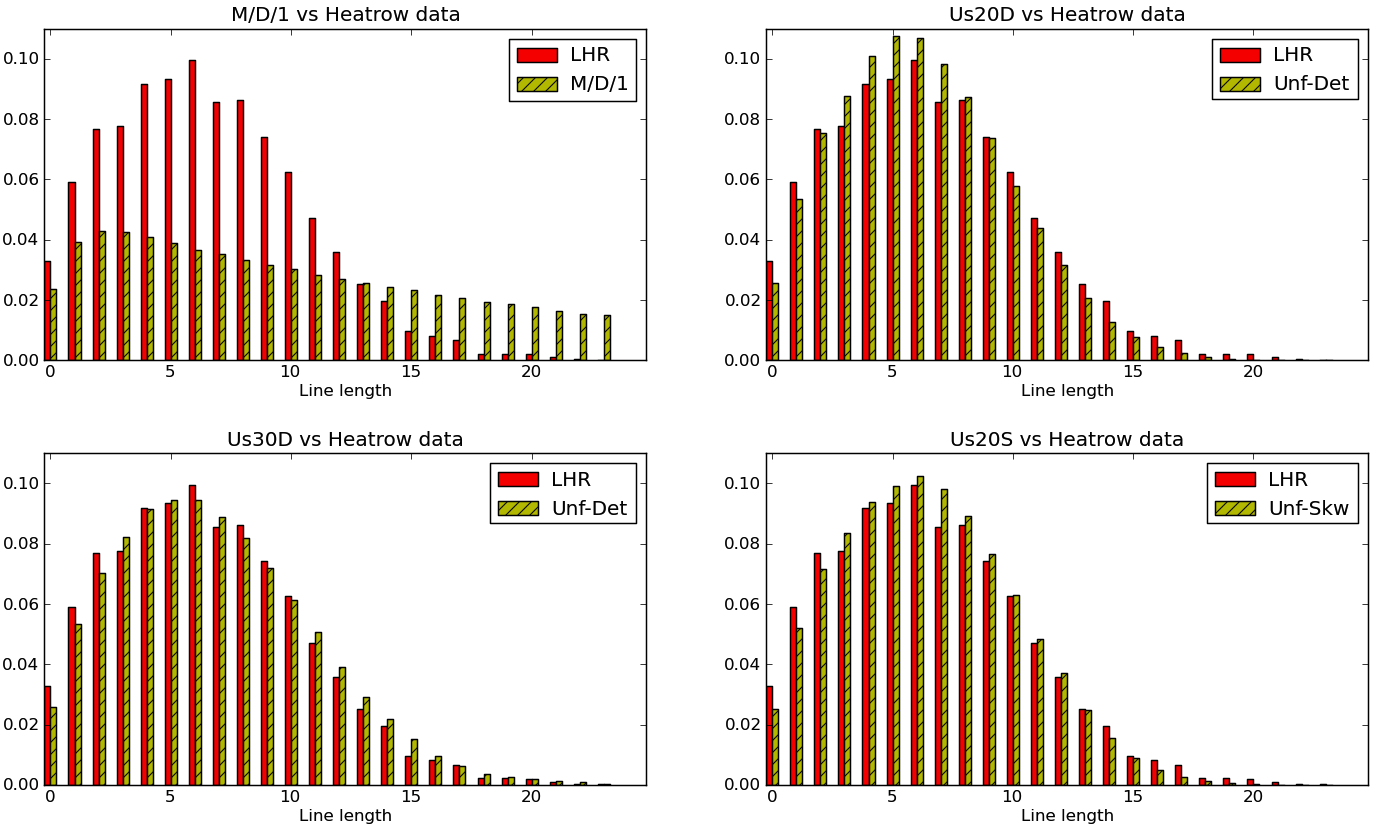
The data discussed in Section 3 may be used to get an idea of the high reliability of the PSRA model. In Figure 3a–3d the empirical distribution derived from actual data is compared with the empirical distribution obtained by simulation of models of interest. Subfigures a to d are displayed clockwise starting top left.
Figure 3a refers to the M/D/1 case. Poissonian arrivals are de facto a standard assumption in many works and studies in the ATM field [2, 5, 8, 14, 17] but they give not a satisfactory prediction of the tail of the queue distribution whatsoever. Figure 3b and 3d refer to the PSRA with and , respectively. These values are reasonable guesses of the order of the actual standard deviation. We would need more data to validate this claim. Anyway, we clearly see that the PSRA model gives a very good accordance with empirical data, but to go one better and match what actually happens in real life operations we tried to introduce some randomness on the service time, modeled as a triangular random variable with mean and mode . The introduction of a such small source of randomness is completely legitimate by the need of the service providers to adjust the sequence of the arrivals on demand. The variant of PSRA obtained this way is shown in Figure 3c. We want to outline here that the simulations have been performed using a straightforward Python code. This is an important features of this model: it can be easily simulated.
In Table 1 we show a measure of the accordance of the observed data with the simulated ones using Total Variation and Hellinger distance. Note that the distance in the case of memoryless arrivals is an order of magnitude larger than the distances obtained by PSRA arrivals.
| Model | Total Variation distance | Hellinger distance |
|---|---|---|
| M/D/1 | 0.41067 | 0.43903 |
| Uniform Delays333 and deterministic service time | 0.07516 | 0.08133 |
| Uniform Delays444 and deterministic service time | 0.03938 | 0.04565 |
| Uniform Delays555 and service times modeled as triangular random variable with mean and mode | 0.05723 | 0.05814 |
5 Robustness of the result
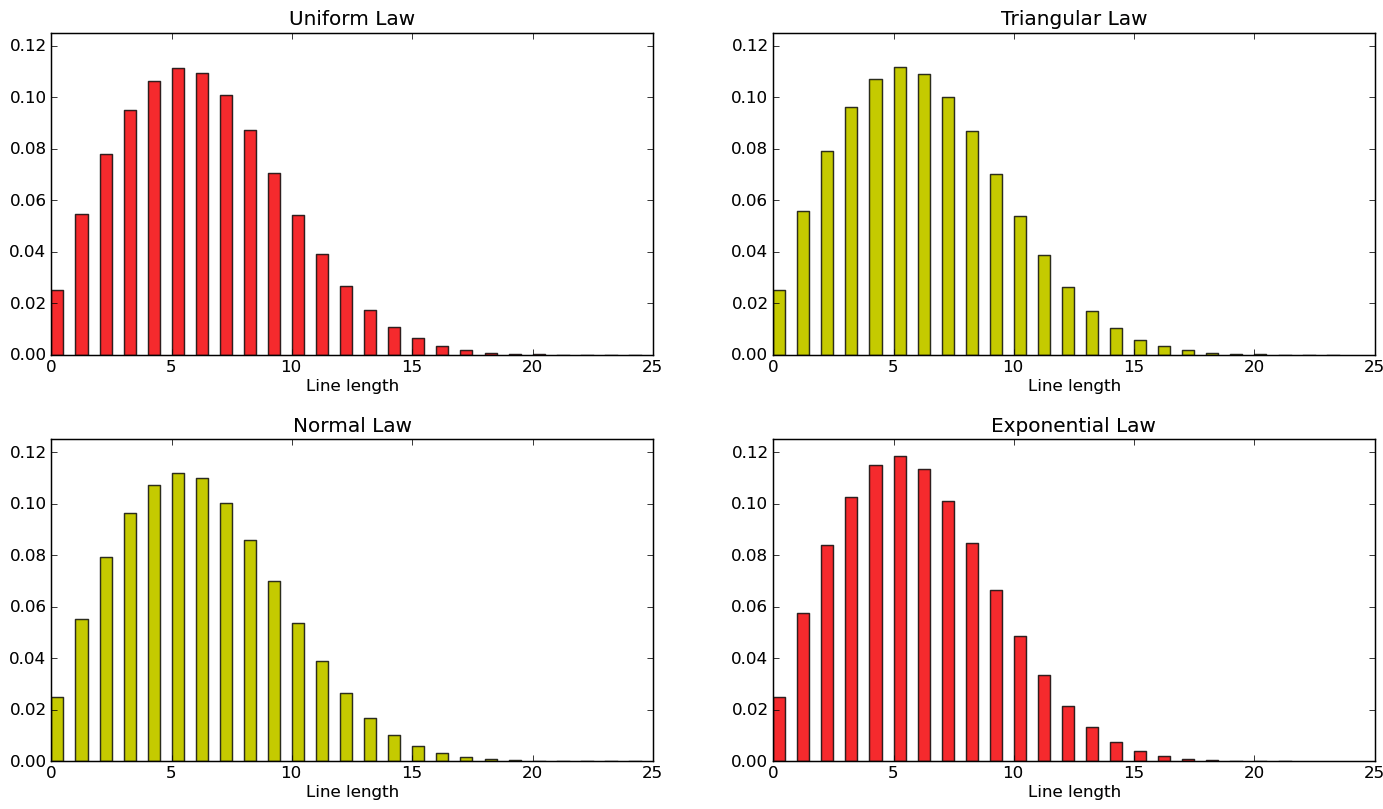
Simulations were also used to study the robustness of the PSRA with respect to the choice of the probability law of the delays. We considered delays of different type, namely uniform, triangular, normal and exponential, with zero mean and fixed standard deviation .
Figure 4 suggests that the standard deviation of the delay is the actual parameter of the model and that the resulting queue distribution is insensitive of the nature of the delays. For symmetrical probability laws such as uniform, triangular and normal the histograms in Figure 4 present an astonishing resemblance and differ for only small fluctuations.
Even more surprisingly, we obtain the same layout with a skew probability law, like the exponential distribution. Figure 4 clearly shows that the queue distribution obtained using exponentially delayed arrivals is qualitatively the same as the uniformly delayed case. This circumstance is of extreme interest for applications, for the exact solution of the model can be obtained for the case of exponential delays. In [10] a PSRA model with exponentially distributed ’s is considered and an iterative method to derive the explicit expression of the generating function is provided. In the same paper it can be seen via simulations of the model that the empirical and theoretical distributions completely agree.
6 Conclusions
In this paper, we present a model to describe the inbound air traffic over a congested hub. The model can be also used to study the possible effects of the application of future technologies to the Air Traffic Control [12].
This work is a preliminary attempt to study this important problem, as such it should motivate further studies about the PSRA and its performance analysis. Hopefully, the features of this arrival process may give also an insight in the equally crucial problem of congestion reduction in complex systems.
References
- [1] G. Andreatta, P. Dell’Olmo, and G. Lulli, An aggregate stochastic programming model for air traffic flow management, European Journal of Operational Research, 215 (2011), pp. 697–704.
- [2] H. Balakrishnan and B. Chandran, Scheduling aircraft landings under constrained position shifting, in AIAA Guidance, Navigation and Control Conference and Exhibit, Citeseer, 2006.
- [3] M. Ball, R. Hoffman, and A. Mukherjee, Ground delay program planning under uncertainty based on the ration-by-distance principle, Transportation Science, 44 (2010), pp. 1–14.
- [4] M. Ball, T. Vossen, and R. Hoffman, Analysis of demand uncertainty effects in ground delay programs, in 4th USA/Europe Air Traffic Management R&D Seminar, 2001, pp. 51–60.
- [5] N. Bäuerle, O. Engelhardt-Funke, and M. Kolonko, On the waiting time of arriving aircrafts and the capacity of airports with one or two runways, European Journal of Operational Research, 177 (2007), pp. 1180–1196.
- [6] R. de Neufville and A. Odoni, Airport Systems: Planning, Design and Management, McGraw-Hill, 2003.
- [7] P. Dell’Olmo and G. Lulli, A dynamic programming approach for the airport capacity allocation problem, IMA Journal of Management Mathematics, 14 (2003), pp. 235–249.
- [8] W. Dunlay, Stochastic properties of enroute air traffic- an empirical investigation, Journal of Aircraft, 13 (1976), pp. 376–381.
- [9] EUROCONTROL, Performance review report on european air traffic management performance in 2011. http://www.eurocontrol.int/documents/performance-review-report-european-air-traffic-management-performance-2011, May 2012.
- [10] G. Guadagni, C. Lancia, S. Ndreca, and B. Scoppola, Queueing systems with Exponentially Delayed Arrivals, In preparation, (2012).
- [11] G. Guadagni, S. Ndreca, and B. Scoppola, Queueing systems with pre-scheduled random arrivals, Mathematical methods of operations research, 73 (2011), pp. 1–18.
- [12] A. Iovanella, B. Scoppola, S. Pozzi, and A. Tedeschi, The impact of 4D trajectories on arrival delays in mixed traffic scenarios, Journal of Aerospace Operations (Submitted), (2011).
- [13] D. Kendall, Some recent work and further problems in the theory of queues, Theory of Probability & Its Applications, 9 (1964), pp. 1–13.
- [14] V. Marianov and D. Serra, Location models for airline hubs behaving as M/D/c queues, Computers & Operations Research, 30 (2003), pp. 983–1003.
- [15] A. Odoni, The flow management problem in air traffic control, in Flow Control of Congested Networks, A. Odoni and G. Szego, eds., Springer-Verlag, 1987, pp. 269–288.
- [16] O. Richetta and A. Odoni, Dynamic solution to the ground-holding problem in air traffic control, Transportation research. Part A, Policy and practice, 28 (1994), pp. 167–185.
- [17] T. Willemain, H. Fan, and H. Ma, Statistical analysis of intervals between projected airport arrivals, tech. rep., Citeseer, 2004.