Variable dust formation by the colliding-wind Wolf-Rayet system HD 36402 in the Large Magellanic Cloud
Abstract
Infrared photometry of the probable triple WC4(+O?)+O8I: Wolf-Rayet system HD 36402 (= BAT99–38) in the Large Magellanic Cloud (LMC) shows emission characteristic of heated dust. The dust emission is variable on a time-scale of years, with a period near 4.7 yr, possibly associated with orbital motion of the O8 supergiant and the inner -d WC4+O binary. The phase of maximum dust emission is close to that of the X-ray minimum, consistent with both processes being tied to colliding wind effects in an elliptical binary orbit. It is evident that Wolf-Rayet dust formation occurs also in metal-poor environments.
keywords:
stars: individual: HD 36402 – stars: Wolf-Rayet – stars: winds, outflows – X-rays: binaries – infrared: stars1 Introduction
Population I Wolf–Rayet (WR) stars lose mass at prodigious rates (M⊙yr-1) in dense, fast stellar winds giving the stars their characteristic emission-line spectra: they represent the last stable stage in the evolution of massive stars. Their high luminosities and conspicuous spectra facilitate identification in external galaxies, while the stellar winds have a profound influence on the local interstellar medium, enriching it with nuclear-processed material and frequently forming bubbles. When WR stars are members of binary systems with other luminous stars possessing stellar winds, the collision of the two stellar winds can result in shock-heating of stellar wind material and particle acceleration, observable in X-ray and non-thermal radio emission. Some colliding-wind binaries (CWBs) incorporating WC type WR stars also form carbon dust in their winds, observable by its conspicuous infrared (IR) emission. These phenomena often vary periodically, especially if the stars move in an elliptic orbit and their separation varies so that the wind-collision region (WCR) moves periodically between denser or rarer regions of the stellar winds. Also, depending on the inclination of the system, our line of sight to the WCR passes through varying amounts of stellar wind as the orbit progresses, causing variations in the free-free and photoionization extinction to the observed radio and X-ray emission. The prototype is WR 140 (= HD 193793), whose IR, radio and X-ray variations were linked to the motion of its WC7 and O5 components in their 7.94-yr orbit by Williams et al. (1990). This system has continued to attract observations in all wavelength domains – for a recent summary, see Williams (2011a) – as a laboratory of particle acceleration (e.g. Pittard & Dougherty 2006) and led to the identification of other variable dust-making WR CWBs in the Galaxy. The observation of rotating dust ‘pinwheels’ around some of the WR systems which show persistent dust emission (e.g. WR 104, by Tuthill et al. 2008) associates these with CWBs too. The persistent dust makers are nearly all WC9 stars and their locations show a strong preference for the metal-rich region of our Galaxy, generally towards the Galactic Centre. On the other hand, the variable and episodic WR dust makers have spectral types ranging from WC5 to WC8 and a less concentrated galactic distribution – but all of them are located within the Solar circle. This suggests a strong influence of environmental metallicity on the phenomenon of dust formation by WR systems.
In the lower metallicity environments of the Magellanic Clouds, the fractions of WR/O stars and distributions of WR spectral subtypes are very different from those in our Galaxy. In particular, of the 24 WC/WO stars in the LMC, 23 are of type WC4 and one a WO3 (Moffat 2008). The question arises: do any of these make carbon dust? This can be tackled by a survey of their spectral energy distributions (SEDs) or a search for variability in the IR characteristic of the variable or episodic dust-makers like WR 140. To begin, we examined the -band photometry of the LMC WC4 stars measured in the Deep Near Infrared Survey of the Southern Sky (DENIS; Epchtein et al. 1999, Cioni et al. 2002), Two Micron All Sky Survey (2MASS, Skrutskie et al. 2006) including the 6X w/LMC/SMC Point Source Working Database, and InfraRed Survey Facility (IRSF) Magellanic Cloud (Kato et al. 2007) surveys for evidence of variability. Of the 21 LMC WC4 stars with at least three observations, the best candidate for variability, after discounting stars with uncertain data or lying in very crowded regions where close companions could be included in the apertures of some but not other surveys, was HD 36402 (= BAT99–38, Breysacher, Azzopardi & Testor 1999). It would certainly be worth repeating the search for variability when the VISTA Magellanic Clouds Survey (Cioni et al. 2011), with its higher resolution and homogeneity, is complete. The case for HD 36402 being a WR dust maker was strengthened by its mid-IR (3.6–8 m) photometry in the SPITZER SAGE LMC survey (Bonanos et al. 2009), where it was identified as the reddest WR star. A preliminary account of the present study was presented at the 2010 LIAC (Williams 2011b, Paper I), where it was shown that the 2–8 m SED was characteristic of of WR dust, but that at wavelengths beyond 10 m, the emission from the WR star could not easily be resolved from that by two nearby luminous young stellar objects (YSOs) discovered by Chu et al. (2005) and that the 70- and 160-m fluxes tentatively ascribed to a ring nebula associated with HD 36402 by Bonanos et al. came entirely from the YSOs.
Independently, Boyer et al. (2010) came to a similar conclusion in their study of the far-IR emission from three dust-making evolved stars in the LMC with Herschel instrumentation. They presented the SEDs of HD 36402 and of a strong far-IR source, HD 36402 IR1 immediately to the west of the WR star, having 64 and 8 K. They considered the possibility that IR1 could be heated by the stellar flux from HD 36402 but concluded that it was more likely to be the YSOs embedded in a molecular cloud.
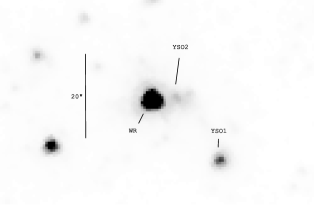
The field is certainly crowded at longer wavelengths, making interpretation of long-wavelength observations with smaller instruments (e.g. IRAS or MSX) with their larger beam sizes difficult, but there is no confusion in the IRAC bands – even at 8 m, HD 36402 is 1.7 mag. brighter than the closer YSO (YSO-2, 7 arcsec to the W of the WR star). At this wavelength, the IRAC beam (Fazio et al. 2004) is smaller than 2 arcsec full width half maximum (FWHM), so we consider YSO-2 to be well separated from HD 36402 in all IRAC bands as the magnitude differences are greater at shorter wavelengths. The field near HD 36402 at 3.6 m is shown in Fig. 1.
The spectrum and orbit of HD 36402 were studied by Moffat, Niemela & Marraco (1990), who derived an orbit from the WR emission lines having a period of 3.03269 d and radial velocity (RV) amplitude km s-1. The absorption-line RV amplitude was not significantly different from zero ( km s-1), suggesting that the O8 supergaint did not participate in the 3-d orbit and that HD 36402 was a triple system like Mus (= WR 48) or R 130 in the LMC. From five high-resolution IUE spectra, Konigsberger, Moffat & Auer (2003) measured RVs of photospheric absorption lines which fitted a sinusoidal variation in anti-phase with the emission-line spectrum, suggesting formation in the close companion to the WC star, but more probably produced by the superposition of the stationary absorption lines from the O8 supergiant and rotationally broadened absorption lines produced in the close companion. In their study of HD 193793 (WR 140), Fitzpatrick, Savage & Sitko (1982) compared its IUE spectrum with that of HD 36402. The 1550 C iv profile in HD 36402 showed narrow interstellar lines from both the Milky Way and the LMC and two sets of circumstellar absorption lines. The broader set was shifted km s-1 relative to the LMC interstellar lines and the narrower pair by km s-1. The same features, at the same velocities and strengths, were seen in another IUE spectrum taken three months earlier, ruling out their formation in a transient event. Niedzielski & Skórzyński (2002) used the IUE high-resolution spectra to determine a terminal velocity of km s-1, comparable to those of other WC4 stars in the LMC and our Galaxy. It seems reasonable to attribute the km s-1 absorption to the O8I component; it is in line with the range of terminal velocities (955–2186 km s-1) measured for O8 supergaints by Prinja, Barlow & Howarth (1990).
In this paper, we present new observations of HD 36402 from images taken for the N51D study by Chu et al. and post-cryo observations extracted from the Spitzer Heritage Archive. Recently, additional mid-IR observations have become available from the AKARI LMC (Kato et al. 2012) and WISE (Wright et al. 2010) surveys. We use these data to re-examine the IR variability of HD 36402 and derive a period, and consider its status as a dust-making WR CWB.
2 Observations
2.1 IR Photometry of HD 36402 from Surveys
| Survey or source | Date | |||
|---|---|---|---|---|
| DENIS strip 4963 | 1996.92 | 11.63 | 10.55 | 0.02 |
| DENIS shifted | 11.73 | 10.69 | 0.02 | |
| 2MASS all-sky | 2000.08 | 11.76 | 10.97 | 0.02 |
| 2MASS 6X PSWDB | 2000.98 | 11.73 | 10.82 | 0.02 |
| 2MASS 6X PSWDB | 2001.09 | 11.69 | 10.73 | 0.02 |
| IRSF LMC0525-6720A | 2002.88 | 11.80 | 11.22 | 0.01 |
| N51D study (ISPI) | 2006.85 | 11.73 | 10.75 | 0.05 |
| Date | mpro | [3.6] | [4.5] | mpro | [5.8] | [8.0] | / | Source | ||
|---|---|---|---|---|---|---|---|---|---|---|
| (3.2 m) | (3.35 m) | (3.55 m) | (4.44 m) | (4.60 m) | (5.58 m) | (7.0 m) | (7.76 m) | (11 m) | ||
| 2004.96 | 9.710.05 | 8.990.04 | 8.540.04 | 7.910.03 | N51D | |||||
| 2005.55 | 9.300.05 | 8.700.04 | 8.210.03 | 7.810.02 | SAGE1 | |||||
| 2005.82 | 9.180.05 | 8.500.04 | 8.110.03 | 7.670.03 | SAGE2 | |||||
| 2007.42 | 9.680.04 | 7.700.02 | 7.110.02 | LMCC | ||||||
| 2009.77 | 8.960.05 | IRAC | ||||||||
| 2009.91 | 9.510.05 | IRAC | ||||||||
| 2010.41 | 9.440.02 | 8.570.02 | 7.150.02 | WISE | ||||||
| 2010.91 | 9.200.03 | 8.310.02 | WISE |
Near-IR photometry and dates of observation of HD 36402 extracted from the DENIS, 2MASS and IRSF Magellanic Cloud surveys are collected in Table LABEL:TnIR and plotted in Fig. 2. For an object having the colour of HD 36402, the difference between the IRSF and 2MASS magnitudes is not expected to exceed 0.02 mag. (Kato et al. 2007, table 10). The differences between DENIS and 2MASS magnitude scales are, however, greater. Delmotte et al. (2001) measured systematic shifts between the and scales of the two catalogues, finding means = –0.10 () and –0.14 () in the sense DENIS minus 2MASS, but with significant variation from DENIS strip to strip. These differences are applied to the data in Table LABEL:TnIR and Fig. 2 to align the DENIS and 2MASS magnitudes.

Mid-IR photometry of HD 36402 is available from the Spitzer, AKARI and WISE missions. Magnitudes of HD 36402 in the Spitzer SAGE survey of the Magellanic Clouds (Meixner et al. 2006) extracted from the NASA/IPAC Infrared Science Archive are given in Table LABEL:TmidIR and the [3.6] and [4.5] magnitudes are plotted against date of observation in Fig. 2.
HD 36402 was observed in the AKARI LMC Survey (Kato et al. 2012) in the ( 3.2-m), ( 7.0-m) and ( 11-m) bands as AKARI-LMCC J052603.96-672956.7 on 2007 June 2–3. The data are included in Table LABEL:TmidIR.
Owing to its high ecliptic latitude (87), HD 36402 was observed very frequently by WISE in both the All-sky and Post-Cryo surveys. It was flagged as having a high probability of variability in the All-Sky survey, so we examined this using the 173 ‘A’-quality (profile-fitted, 3.4-m) magnitudes extracted from the WISE All-Sky Single Exposure (L1b) Source Table. The data covered 21 days (MJD 55335–356 in 2010 May-June) and we began by searching for periodicity using the clean algorithm (Roberts, Lehár & Dreher 1987) as implemented in the Starlink111The Starlink software suite is currently maintained and distributed by the Joint Astronomy Centre, Hilo, Hawaii. period package (Dhillon, Privett & Duffey 2001). We found a peak at 5.990.04 d but the false alarm probability (FAP) calculated from 250 random permutations of the data was 0.056 ( = 0.015), so the period is only marginally significant. We repeated the period search on the 202 magnitudes observed during MJD 55522–539 (2010 November – 2011 January from the WISE Preliminary Post-Cryo Single Exposure (L1b) Source Table, but found no significant period, so we discount that suggested by the All-Sky data. We also examined the data for a trend and found the magnitudes to be brightening at 0.00230.0007 mag d-1 during the 21 days of observations in the All-Sky survey. This is consistent with the brightening in and magnitudes between the All-Sky and post-cryo surveys (Table LABEL:TmidIR and Fig. 2), where the dates used are the average dates derived from the Source Tables. These show brightening at an average rate of 0.00130.0002 mag d-1, comparable to the rates of the IRAC 3.6- and 4.5-m fluxes.
At 11-m the beams of the AKARI and WISE magnitudes are 5.5 and 6.5 arcsec FWHM respectively and we hestitated to use these data for HD 36402 in case of possible contamination from YSO2, whose spectrum is rising in these relatively wide (4.6 and 8 m respectively) filter pass-bands while that of HD 36402 is expected to be falling. But, as seen from the consistency of these fluxes with the SEDs fitted to the shorter wavelength data in Section 3.2 below, most if not all of the flux measured in the and bands can be attributed to the WR star.
2.2 New photometry of HD 36402
In their observation of the N51D region, Chu et al. (2005) drew attention to the bright image of HD 36402 close to YSOs they reported. As the IRAC observations for this study were taken on 2004 December 12, before the SAGE observations, we measured the flux from HD 36402 in the IRAC images to extend knowledge of its variability. The results are included in Table LABEL:TmidIR.
The region was observed in the near-IR with the Cerro Tololo Inter-American Observatory (CTIO) Blanco 4.0-m Infrared Side Port Imager (ISPI) on 2006 November 7. Three fields including HD 36402 were observed and the photometric calibration was tied to 2MASS observations of stars in the fields. The mean and magntudes are included in Table LABEL:TnIR.
Thirdly, the Spitzer Heritage Archive was searched for images of fields including HD 36402. Twelve observations in [4.5] during 2009 October 3–15 and eleven in [3.6] between 2009 November 16 and December 14 were retrieved and magnitudes of HD 36402 measured. The WR star was generally near the edge of the field, very close to the edge in the case of the [3.6] observations, making sky estimation difficult. Both bands show brightening during the observation sequences but not at statistically significant rates. The average magnitude and date for each of the two runs is given in Table LABEL:TmidIR and plotted in Fig. 2.
3 Results
3.1 Light curves and periodicity

It is evident from the IR observations plotted in Fig 2 that the amplitude of variation increases with wavelength. This is characteristic of varying circumstellar dust emission by WR stars, which peaks in the 3–4 m region, and reflects the increasing contribution of the dust emission with wavelength, which can be seen in the SED (Fig.4, Paper 1, and Boyer et al.).
Variation in the dust emission can arise from variation in the stellar flux heating the dust or in the amount of circumstellar dust. We observe very little variation in ( = 0.04 mag., Fig.2) because the dust contributes little to the flux at this wavelength. The near constancy also suggests that the stellar radiation dominating the -band flux is not significantly variable. There is some dispersion in the visible photometry of HD 36402 – e.g. = 11.44 (Feitzinger & Isserstedt 1983), 11.6180.098 (Zaritsky et al. 2004) – but a concerted search for variability by Seggewiss, Moffat & Lamontagne (1991) showed no variation greater than the photometric uncertainties. We therefore deduce that the variation in the IR comes mostly or wholly from changes in the amount of dust in the wind rather than the stellar radiation heating it. The dust forms in the shock-compressed stellar wind and inherits its velocity, moving away from the stars as seen in the pinwheels made by systems like WR 104, whose winds are relatively slow, or the expanding splash made by WR 140 (Williams et al. 2009), whose wind is 2–3 times faster. As the dust moves further from the stars, the stellar radiation heating it is progressively diluted and the grains cool, so that their emission fades. Therefore, if a system is observed to show constant IR emission, the dissipating dust must be constantly being replenished by the condensation of new dust grains – the observed IR SED is a consequence of the balance of these two processes. The growth of IR emission by HD 36402 in 2004–05 and 2009–10 indicates that the rate of dust formation must have been increasing for over a year in each case. Between these events, the rate of condensation must have fallen below the rate needed to replenish the dissipation to account for the fade in emission between the two rises.
The similarity of the rates of brightening in 2004–05 and 2009–10 suggests that the variation is periodic. To facilitate comparison of the WISE and IRAC data, we interpolated [3.6] and [4.5] magnitudes from the WISE (3.4-m) and (4.6-m) magnitudes by fitting black bodies to the and fluxes, calculating fluxes at 3.6 and 4.5 m, and converting them to magnitudes. Comparison of these with the IRAC observations shows an interval of 4.70.2 yr between the two rises. The uncertainty was estimated from inspection of trial fits, allowing for the spreads in epochs of the WISE observations, and is probably conservative. In Fig. 3, we show the , [3.6] and [4.5] magnitudes phased to the period of 4.7 yr, with zero phase arbitrarily set to the epoch of the DENIS observation. The 2000–01 2MASS photometry fitted to this ephemeris shows a brightening towards a possible maximum near the time of the DENIS observation parallelling that seen in the mid-IR, supporting the interpretation of the 4.7-yr shift as a period in the variations as the 2MASS data come from an earlier cycle than the mid-IR data.
The IRAC and WISE data can also be fit by the first harmonic (2.35 yr) of this period, but the [3.6] and [4.5] magnitudes determined from interpolating the AKARI and observations by fitting a black body to them do not fit, so we discount this possibility. Higher harmomics are ruled out by introduction of scatter in the phased near-IR data or sequence of the IRAC data, so we conclude that the variations are best fit with a period near 4.7 yr.
For the present discussion, we adopt a preliminary ephemeris for the near-IR maximum of
Further near-IR photometry is needed is define the light curves, including fading, the minimum and especially the rise to the next maximum expected in 2015.7 to confirm the period.
The phase of the AKARI-derived [3.6] and [4.5] magnitudes, also plotted in Fig 3, places them on the falling branch of the light curve. Also, the phase of the 2006 ISPI magnitude fits the fade to the faint observed by IRSF. Whether the IRSF point represents the true minimum is not certain: the IRSF – colour (0.58) is close to the mean – (0.550.07) observed for other LMC WC4 systems, so there may be no dust contribution at that phase. This would imply that condensation of new dust grains would have ceased some time earlier to have allowed the existing dust to have dissipated and its emission to have faded sufficiently.
The light curves are not yet well defined but it is evident that the rise to maximum takes at least 1.5 yr. In this respect, HD 36402 more closely resembles the Galactic WC7+O9 dust maker, WR 137 (HD 192641), whose IR flux takes about 3 yr to rise to maximum (Williams et al. 2001), than the prototype, WR 140, which shows a much faster rise (less than two months in , Williams et al. 2009). Better definition of the IR maximum from further observations will show if it occurs later at longer wavelengths owing to the effects of grain growth after condensation (cf. WR 140).
3.2 Spectral energy distributions (SEDs)
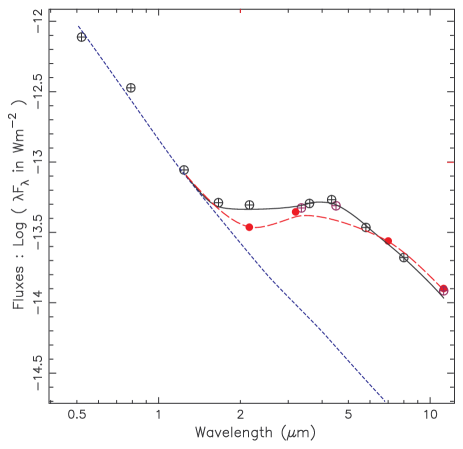
To study the SED of HD 36402, we need observations over a wavelength interval wide enough to cover the flux maximum, essentially contemporaneous near- and mid-IR photometry. We do not have such data, but note that the interval between the 2005.82 IRAC and 2001.09 2MASS observations was 4.73 yr, and that between the 2010.41 and the same 2MASS observations was 9.32 yr, close to our proposed period or double it. Assuming that the SED repeated with this period, we formed a SED combining these data to represent the system near phase 0.9 and present it in Fig. 4. For a 4.7-yr period, the two sets of mid-IR data straddle the near-IR data; when the period is revised with more near-IR data, it should be possible to select more closely matched mid- and near-IR data. Owing to the breadth of the filter, the colour correction for calibration of monochromatic flux from the in-band magnitude can be significant and we adopted that for a 800-K black body from Wright et al. (2010, table 1); those for the other filters are less than 2 per cent.
For the shorter wavelengths, we used the narrow-band observed by Smith (1968), which avoids the strong WC emission lines falling in the band, and from the DENIS survey. Smith also derived a colour excess of , which seems low considering the location of HD 36402, but is consistent with the reddening, , derived by Morris et al. (1993) from nulling the 2200-Å interstellar absorption feature. We de-reddened the photometry using Smith’s , equivalent to , and a standard reddening law, but the effects are too small to influence the results significantly. For the stellar plus wind continuum, we noted that the SED of the LMC WC4+O5–6 system HD 35517 (BAT99-28) defined by the 2MASS, IRAC and WISE data has a power-law form, with no evidence of dust emision. We shifted this to fit the short-wavelength photometry to provide the wind SED shown in Fig. 4. The difference between the phase 0.9 and wind SEDs can be fit by a black body – not as a physical model, but as a simple characterisation of the dust emission. A least-squares fit gave K, with r.m.s. residuals of 0.07 mag. The error would be greater if the near- and mid-IR photometry did not match, i.e. if the system does not repeat with a period of 4.7 yr.
As noted above, we were hesitant to include the 11-m data in case of contamination from YSO2. The modelling was therefore made with and without the magnitude. The difference in fitted was less than 20 K, showing that the datum is consistent with the SED determined at shorter wavelengths and that most, if not all, of the measured flux comes from the WR star.
To examine the maximum dust emission observed, we formed a composite SED from the DENIS (shifted as above) and 2010.91 WISE observations, which were taken 2.98 cycles apart. This lies a little above the SED in Fig. 4, but is omitted for clarity. From it we measure the dust luminosity to be W m-2. We can compare this with the total luminosity of the three stars heating the dust. For the O8I star we adopt following Martins, Schaerer & Hillier (2005). We note the unseen companion to the WC4 star in the 3-d orbit would have a luminosity comparable to that of the O8 supergiant if it were an O4 main-sequence star, but would be mag fainter in the visible – thereby accounting for its not being observed in the spectra taken for RV study by Moffat et al. For the WC4 star, we assume the mean luminosity from the study of LMC WC4 stars by Crowther et al. (2002): . This gives a system luminosity .
Assuming 48 kpc for the distance of the LMC, the dust luminosity is then only 0.004 of the stellar luminosity. Consequently, the emission is optically thin and the grain temperature is determined by its thermal equilibrium in the stellar radiation field. For grains having optical properties of amorphous carbon grains, the equilibrium temperature falls off with distance, , from the stars as (e.g. Williams et al. 2009). In the optically thin case, the flux observed at our distance from the system is simply proportional to the products of the grain opacity and Planck functions, , weighted according to the radial mass distribution . The last is determined by the past history of dust formation: in the simplest case of constant dust formation, it would take the form , but in the case of our SEDs on the rise to maximum, the gradient would be steeper, with relatively more hot dust nearer the stars. We therefore defer modelling the SEDs until we have a more complete picture of the dust formation history from near-IR data, together with sets of mid-IR and near-IR data more certainly at the same phase.
To sample the fading branch of the light curve, we formed a SED from the AKARI , and data, observed near phase 0.2 on our ephemeris. Colour corrections for deriving monochromatic fluxes from the in-band and magnitudes can be significant owing to the widths of the filters and we used those for a 800-K black body given by Lorente et al. (2008, table 4.8.11). There are no near-IR data at this photometric phase, so we interpolated and from the ISPI and IRSF observations and show the resulting SED in Fig. 4. The black body fitted to the difference between this and the wind SED has K with r.m.s. residual 0.05 mag. A fit without the data gives the same temperature, so we are confident in assigning the flux to the WR star. Realistic modelling of this SED would require a radial dust density distribution to reflect the varying rate of dust formation in the preceeding months but it is evident from the black-body fits that the characteristic temperature of the dust is now significantly cooler than that of the phase 0.9 SED, as expected from observations on the fading branch of the light curve.
4 Discussion
Although the IR light curves need strengthening with further observations, they provide enough evidence for us to consider HD 36402 as a variable dust-making CWB like WR 137. The orbit of WR 137 (Lefèvre et al. 2005) has periastron passage yr before near-IR maximum (Williams et al. 2001), which is when the condensation of new grains ceased, or at least fell below the rate needed to replenish the dust being carried away in the stellar wind. This puts periastron in WR 137 close to the middle of its 3-yr dust formation episode. The dust formation by HD 36402, with condensation beginning some time before IR phase 0.7 (cf. Fig. 3) and ending some time near phase 0.0, looks very similar and suggests dust formation formed in a CWB having an elliptical orbit with periastron passage near our IR phase 0.85. The candidate CWB comprises the O8I supergaint in an ‘outer’ orbit with the ‘inner’, 3.03-d WC4+O? binary, whose orbit was determined by Moffat et al. (1990). They found that the absorption lines attributed to the O8I supergaint did not share the motion of the WC4 star, suggesting that it was a third, more distant member of the system. We re-examined the absorption-line RVs measured by Moffat et al., noting that they were observed in three widely spaced runs each spanning 3–8 d. We determined the average RV from each run to be 2835, 2998 and 2417 km s-1 at IR phases 0.17, 0.41 and 0.83 respectively. To test whether these represented orbital motion of the O8I star about the ‘inner’ WC4+O? binary, we examined the corresponding emission-line RVs measured by Moffat et al., adopting their orbital elements apart from the velocities as givens, and solving for the mean velocity for each run to look for motion of the inner binary as a single object. The mean velocities for the three runs also showed significant dispersion, but not in anti-phase with the absorption-line velocities as one would expect from orbital motion, so orbital motion of the O8I star has yet to be determined. Further spectroscopic observations on a time-scale of years are needed to search for search for motion and derive an orbit, but here we will continue on the basis that one exists.
To estimate the properties of the ‘outer’ (4.7-yr) CWB, we use the velocities from the IUE study by Fitzpatrick et al. as terminal velocities () and adopt mass-loss rates for the WC4 and O8I components of and M⊙ y-1 from those of WC4 and O8I stars given by Crowther et al. (2002) and Markova et al. (2004) respectively. These give a wind-momentum ratio . Consequently, the distance between the stagnation point, where the dynamical pressures of the winds balance, and the O8I component will be about one-quarter () that of the separation of the O8I and WC4 stars. This places the WCR close to the O8 supergaint and far from the ‘inner’ binary, probably accounting for the lack of modulation of the dust emission in the WISE data (Section 2.1 above) with the 3.03-d period of the latter.
| Obs ID | Date | Exp | Count rate | IR | |
|---|---|---|---|---|---|
| ks | ks-1 | erg s-1 | |||
| rp000054a00 | 1991.33 | 4.33 | 3.151.03 | 1.5e34 | 0.81 |
| rp400154n00 | 1992.19 | 6.35 | -0.170.57 | 0.99 | |
| rp500093n00 | 1992.19 | 8.48 | -0.210.49 | 0.99 | |
| rp500054a01 | 1992.28 | 3.32 | 5.811.67 | 2.8e34 | 0.01 |
| rh400355n00 | 1994.20 | 4.51 | 3.511.31 | 5.0e34 | 0.42 |
| rh400353n00 | 1994.21 | 3.48 | 3.981.49 | 5.7e34 | 0.42 |
| rh400353a01 | 1994.37 | 4.41 | 2.801.21 | 4.0e34 | 0.46 |
| 0071940101 | 2001.83 | 27.57 | 15.90.9 | 3.0e34 | 0.04 |
Bomans et al. (2002) drew attention to the high X-ray luminosity ( erg s-1 of HD 36402 measured with XMM-Newton, but noted also the softness of the spectral index (), which argued against its being caused soley by collision of the stellar winds. X-ray emission by HD 36402 was also observed using the ROSAT Position Sensitive Proportional Counter (PSPC) and High Resolution Imager (HRI) with 0.5–7.0 keV luminosities of erg s-1 and erg s-1 respectively (Guerrero & Chu 2008). The individual ROSAT observations were recovered and are given in Table 3. To facilitate comparison, luminosities were derived from the ROSAT count rates using web pimms and adopting the absorption column cm-2 and keV derived from the XMM-Newton spectral fit, i.e. folding all the variability into the ‘absorbed luminosities’ .
It is apparent that the X-ray flux observed from HD 36402 is variable. Most striking are the non-detections in the 1992 ROSAT PSCP observations in 1992.19 although the integration times were longer than those before and afterwards, in which HD 36402 was detected. The 1992.19 observations occurred close to zero IR phase, and perhaps after periastron passage in the 4.7-yr binary believed to be responsible for the variable dust formation. The non-detection of X-ray emission from HD 36402 followed by its quick recovery invites comparison with the narrow minimum in the X-ray light curves of WR 140, which occurs just after periastron passage (e.g. Pollock et al. 2005).
The X-ray flux observed from a CWB depends on both the intrinscic emission measure and the photoionization extinction through the stellar winds, especially the heavier wind of the WC star. The source is expected to lie close to the stagnation point between the WC4+O? and O8I winds and, as seen above, much closer to the O8I star. The circumstellar extinction varies as the orbit progresses and the source moves through the WC4 wind according to the orbital elements – expressions are given by Williams et al. (1990) – and is usually greatest near periastron, when the source is most deeply buried in the WR stellar wind, or conjunction, when the source passes behind the WR star. The non-detection of X-ray emission from HD 36402 at phase 0.99 and relative weakness at phase 0.81 are consistent with this picture but modelling the X-ray variations requires knowlege of the ‘outer’ orbit. The intrinsic emission measure is also expected to vary round the orbit, as where is the separation of the stars, for an adiabatic WCR (Stevens, Blondin & Pollock 1992). This would make the intrinsic emission measure somewhat greater at periastron, but without more spectroscopy or at least measures of the hardness ratio around the orbit, we cannot tell at this stage.
The relatively wide separation of the outer binary implied by its period should allow non-thermal radio emission from the WCR to emerge (cf. Dougherty & Williams 2000), at least away from periastron, but the distance of the LMC would make this a challenging observation with current instrumentation – e.g. the maximum 6-cm flux density of WR 140 shifted to the distance of the LMC would be 30 Jy.
The demonstration that one of the WR systems in the LMC is an episodic dust-maker like those in the Galaxy suggests that there are more to be found. Other candidate dust-variables include HD 32125 (BAT99–9) and HD 38448 (BAT99–125). In the case of HD 32125, most of dispersion in comes from the DENIS observation, which has a relatively large uncertainty ( 0.22 mag), so it would be premature to consider it a episodic dust-maker and both stars need re-examination for variability when photometry from the VMC survey becomes available. If episodic dust formation is possible in the low metallicity environment of the LMC, what about persistent dust formation, like that observed from some WC8–9 stars observed in the inner regions of the Galaxy? One candidate amongst the LMC WR systems is BAT99–121, which has anomalously red – colours in both the 2MASS and IRSF MC surveys. This star is in a difficult field and will be discussed elsewhere. In any event, HD 36402 has posed the question: why has dust formation not been observed from Galactic WR systems outside the solar circle, where the overall metallicity is lower? A second question is what is the lowest metallicity environment in which WR systems can make and contribute dust to the ISM?
Acknowledgements
This work is based in part on observations made with the Spitzer Space Telescope, which is operated by the Jet Propulsion Laboratory, California Institute of Technology under a contract with National Aeronautics and Space Administration (NASA). This work also makes use of data products from the AKARI mission, a JAXA project with the participation of ESA, and the Wide-field Infrared Survey Explorer, which is a joint project of the University of California, Los Angeles, and the Jet Propulsion Laboratory/California Institute of Technology, funded by the National Aeronautics and Space Administration. This research has made use of the NASA/IPAC Infrared Science Archive, which is operated by the Jet Propulsion Laboratory, California Institute of Technology, under contract with the NASA; the Vizier database, operated by the CDS, Strasbourg, and the DARTS archive developed and maintained by C-SODA at ISAS/JAXA. PMW is grateful to the Institute for Astronomy and UK Astronomy Technology Centre for continued hospitality and access to the facilities of the Royal Observatory Edinburgh.
References
- [N51DXMM] Bomans D. J., Rossa J., Weis K., Dennerl K., 2002, in: van der Hucht K. A., Herrero A., Esteban C., eds, Proc. IAU Symp. No. 212, A Massive Star Odyssey from Main Sequence to Supernova, Astron. Soc. Pacific, San Francisco, p. 637
- [SAGE] Bonanos A. Z., et al., 2009, AJ, 138, 1003
- [dustLMC] Boyer M. L., 2010, A&A, 518, L142
- [BAT99] Breysacher J., Azzopardi M., Testor G., 1999, A&A Supp, 137, 117 (BAT99-)
- [MCS] Cioni M.-R. et al., 2000, A&AS, 144, 235
- [VMC_I] Cioni M.-R. L. et al. 2011, A&A, 527, A116
- [N51D_YSOs] Chu Y.-H., et al., 2005 ApJL, 634, L189
- [LMC_WC4] Crowther P. A., Dessart L., Hillier D. J., Abbott J. B., Fullerton A. W., 2002, A&A, 392, 653
- [DENIS2MASS] Delmotte N., Egret D., Loup C., Cioni M. R., 2001, Proc SPIE 4477, 301
- [PERIOD] Dhillon V. S., Privett G. J., Duffey D., 2001, Starlink User Note 167.6, Rutherford Appleton Laboratory.
- [Bins4nT] Dougherty S. M., Williams P. M., 2000, 319, 1005
- [DENIS] Epchtein N., et al. 1999, A&A, 349, 236
- [IRAC] Fazio G. G., et al., 2004, ApJ Supp, 154, 10
- [IUE140] Fitzpatrick E. L., Savage B. D., Sitko M. L., 1982, ApJ, 256, 578
- [ROSAT] Guerrero M. A., Chu Y.-H., 2008, ApJS, 177, 238
- [AKARILMC1] Ita Y., et al., 2008, PASJ, 60, S435
- [IRSFMC] Kato D., et al., 2007, PASJ, 59, 615
- [AKARILMC2] Kato D., et al., 2012, AJ, 144, 179
- [UVspec] Koenigsberger G., Moffat A. F. J., Auer L. H., 2003, RMAA, 39, 213
- [Orbit137] Lefèvre L., et al. 2005, MNRAS, 360, 141
- [IRCUM14] Lorente R., et al., 2008, AKARI IRC Data User’s Manual v. 1.4, http://www.ir.isas.jaxa.jp/AKARI/Observation
- [Ostars] Markova N., Puls J., Repolust T., Markov H., 2004, A&A, 413, 693
- [Ostars] Martins F., Schaerer D., Hillier D. J., 2005, A&A 436, 1049
- [WRbinsMC] Moffat A. F. J., 2008, RMAA (SC) 33, 95
- [Orbit] Moffat A. F. J., Niemela V. S., Marraco H. G., 1990, ApJ, 348, 232
- [cont] Morris P. W., Brownsberger K. R., Conti P. S., Massey P., Vacca W. D., 1993, ApJ, 412, 327
- [V_inf] Niedzielski A., Skórzyński W., 2002, Acta Astron. 52, 81
- [] Pittard J. M., Dougherty S. M., 2006, MNRAS, 372, 801
- [v_inf] Prinja R. K., Barlow M. J., Howarth I. D., 1990, ApJ, 361, 607
- [CLEAN] Roberts D. H., Lehár J., Dreher J. W., 1987, AJ, 93, 968
- [WCstars] Sander A., Hamann W.-R., Todt H., 2012, A&A 540, A144
- [var] Seggewiss W., Moffat A. F. J., Lamontagne R., 1991, A&A Supp, 89, 105
- [2MASS] Skrutskie M. F., et al., 2006, AJ, 131, 1163
- [WRphot] Smith L. F., 1968, MNRAS, 140, 409
- [CWBth] Stevens I. R., Blondin J. M., Pollock A. M. T., 1992, ApJ, 386, 265
- [Suzaku] Suguwara Y., et al., 2011, BSRSL, 80, 724
- [pinwh] Tuthill, P. G., Monnier, J. D., Danchi, W. C., 1999, Nature, 398, 487
- [LIAC140] Williams P., 2011a, BSRSL, 595, 595
- [LIAC_LMC] Williams P. M., 2011b, BSRSL, 80, 195 (Paper I)
- [WR140] Williams P. M., van der Hucht, K. A., Pollock, A. M. T., Florkowski, D. R., van der Woerd, H., Wamsteker, W. M., 1990, MNRAS, 243, 662
- [WR137ii] Williams P. M., et al., 2001, MNRAS, 324, 156
- [dust140] Williams P. M., et al., 2009, MNRAS, 395, 1749
- [WISE] Wright E. L., et al. 2010, AJ, 140, 1868
- [UBV] Zaritsky D., Harris J., Thompson I.B., Grebel E.K., 2004, AJ, 128, 1606