X-ray behaviour of GRBs detected by INTEGRAL/JEM-X
Abstract:
INTEGRAL’s JEM-X instrument offers a very rare opportunity to observe the full prompt X-ray emission from GRBs and the transition to the afterglow phase. A study of prompt X-ray flares in some bursts from the INTEGRAL GRB sample and the early X-ray post-GRB emission from 3–35 keV is presented here. Significant post-GRB emission above 10 keV is observed for GRB 041219A and GRB 081003A.
1 Introduction
Gamma-ray bursts (GRBs) can be classified based on their durations as long GRBs ( 2 s) and short GRBs ( 2 s). However, the duration of a GRB, typically measured by the T90 duration, strongly depends on the sensitivity of the instrument and the energy range over which the burst has been detected [1]. GRB pulses tend to be wider at lower energies [2], so their durations tend to be considerably longer at lower energies than at higher energies.
The launch of Swift brought a major improvement in the study of early X-ray afterglows of GRBs thanks to its fast and autonomous re-pointing of the X-ray (and optical) instrument on board. The typical delay of the Swift X-ray observations is 70 s, and thus, for long GRBs it is possible to obtain late prompt emission simultaneously in the X-ray and -ray bands. However, due to the very small field of view of the XRT instrument, X-ray observations of the whole prompt emission phase are highly unlikely.
Since its launch, INTEGRAL has observed 22 GRBs (out of 90 GRBs localised by IBIS) with an off-axis angle equal to or smaller than 5∘. GRBs at such small off-axis angles can be observed, during their prompt emission, by the JEM-X (3–35 keV) instrument on board INTEGRAL, providing additional spectral information for the prompt emission and the transition to the afterglow phase. The availability of simultaneous X-ray data for some INTEGRAL bursts motivated a search for X-ray afterglow emission in the sample of 22 GRBs detected by JEM-X. Post-GRB emission in this context is defined as emission occurring after the T90 burst duration in the –ray band (20–200 keV). A rapid decline in the X-ray light curve is expected after the prompt emission, based on the canonical X-ray afterglow behaviour, with the possibility of X-ray flares at times T0+100–1000 s, where T0 is the trigger time [3]. The total energy in the early X-ray flares can, in some cases, be comparable to the burst itself [4]. These flares are currently associated with internal shocks (as in the prompt phase) rather than the external shocks associated with the afterglow emission.
X-ray afterglows are typically observed in the 0.3–10 keV energy range (XMM-Newton, Chandra, and Swift). To date, few GRB afterglows have been seen at energies higher than 10 keV. Emission up to 60 keV was seen, for the first time, in GRB 990123 using BeppoSAX [5]. INTEGRAL has previously detected hard X-ray afterglow emission, up to 100 keV, with its instrument IBIS/ISGRI, for GRB 060428C for about 20 s after the prompt emission had finished [6]. Thus, JEM-X’s sensitivity up to 35 keV provides a window to study the afterglow emission at energies higher than 10 keV and could be used to close the energy gap between Swift/XRT (0.3–10 keV) and IBIS/ISGRI (20–1000 keV) in those cases with simultaneous Swift and INTEGRAL data.
2 Data sample
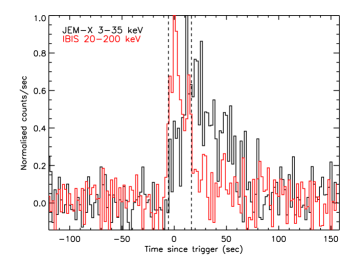
All 22 GRBs that have been triggered by IBIS/ISGRI within 5∘ are detected by JEM-X. These GRBs are long and in most of the cases weak (peak flux 0.7 ph cm-2 s-1 in the 20–200 keV energy range). Due to the sensitivity limit of JEM-X, this results in poor quality light curves in most of the 22 cases, with a lot of background noise and low resolution spectra. In order to usefully study the transition between the prompt and afterglow emission, this sample must be further reduced to those cases where good quality observations have been obtained with the JEM-X instrument. Thus, three conditions were imposed on the original sample: a peak flux 1.5 ph cm-2 s-1 in the 3–35 keV energy range, a fluence 2.5 10-7 erg cm-2 in the 3–35 keV band, and X-ray hardness, measured as the fluence ratio between the energy bands 3–10 keV and 10–35 keV, to be close to 1. These conservative criteria result in a subsample of 5 GRBs (GRB 041219A, GRB 050520, GRB 051105B, GRB 081003A, and GRB 090817). A good example of a GRB with long-lasting emission in its X-ray light curve is shown in Fig. 1. In this case, GRB 081003a, the X-ray emission is clearly seen well after the -ray emission (red curve) is finished.
To create X-ray spectra, the X-ray light curves of the GRB candidates for X-ray afterglow emission were re-binned until each point had a signal-to-noise ratio of at least 5 above the background level. The spectrum generated for each interval was then fit by a simple power-law model. The analysis of the data was carried out using OSAv9 and XSPECv12.7.
3 X-ray flares in the late prompt emission
About 5% of Swift/BAT GRBs have soft pulses at 100–300 s after the burst trigger, consistent with the times of the X-ray flares commonly observed by Swift/XRT. Both the temporal and spectral properties of these soft pulses resemble those of the “standard” X-ray flares. Thus, if these pulses are attributed to X-ray flares, the T90 measurements of this 5% GRBs would be overestimated.
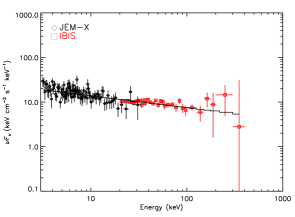
The INTEGRAL GRB sample, shows similar behaviour in 4% of its bursts. Two of these bursts (GRB 041219A and GRB 090817) are also in the JEM-X set of 5 GRBs meeting the selection criteria. Fig. 2 shows the soft X-ray light curve of GRB 041219A [7] during the first 200 s after the trigger i.e. before the main pulse of the prompt emission starts at T0 + 230 s (indicated by the vertical dotted line). The first vertical dashed line represents the end of the -ray emission (20–200 keV) of the precursor. After peaking in X-rays, the precursor light curve declines with a power-law decay of index = -2.74 0.21. This value is commonly seen in the early afterglows of GRBs exhibiting strong flares. Therefore, if the soft flare detected at T0 + 80 s, is part of the afterglow, its flux should return to the expected value marked by the precursor decay (solid line in Fig. 2). The beginning of the intense prompt emission (dotted line), limits the length of the good time interval, GTI, which can be used to find this value. It has been typically seen that with GTIs of 50 s (maximum length allowed in this interval), fluxes 5 10-10 ergs cm-2 s-1 can be detected. No detection is made during the interval after the flare, which indicates that the flux is rapidly decaying with time. The power-law fit of the decaying phase of the soft flare results in a power-law index of = -8.4 0.8 (dashed-dotted line). The projection of this decay with the one measured before the flare is also shown in Fig. 2. Both precursor and soft flare decays would cross each other at 230 s after the trigger. The spectrum of the flare (right panel Fig. 2) is well fit by a single power-law with photon index of = 2.26 0.02.

4 Transition from prompt to afterglow emission
Fig. 3 shows the X-ray GRB emission for two GRBs from the JEM-X sample considered in this analysis (GRB 051105B and GRB 081003A, in the left and right panel respectively). As shown in these two examples, the transition and the early afterglow seen in the JEM-X data can be quite different from case to case.


In the case of GRB 051105B (left panel Fig. 3), the X-ray decay differs from the observed temporal shape seen at hard X-rays with IBIS/ISGRI, where the burst ends more abruptly. The X-ray decay phase is observed up to T0+50 s with =-2.4 0.1. This value agrees with the average decay seen in FRED GRB tails of 2.44 [8].
GRB 081003A shows post-GRB emission with different decaying phases (right panel Fig. 3). The early post-burst X-ray emission, from T0+22 s to T0+70 s, decays as a power-law of slope -0.980.05. Thereafter the decay slope steepens to a value of -3.880.11 until T0+271 s, consistent with high latitude emission. Later observations (T0+104 s) by Swift indicate that the X-ray light curve must flatten out sometime after T0+271 s. A lower limit on the slope of -0.800.14 is derived, assuming the flattening starts at T0+250 s. The early shallow phase lasting 50 s can be attributed to pure prompt emission, where the pulse at lower energies is wider than the one seen at higher energies. However, the duration between the X-ray and -ray bands is greater than usually seen. The second scenario attributes this phase to afterglow emission with strong long-lasting energy injection from the central engine. At T0+70 s the high latitude emission starts to dominate, however, the fact that another shallow phase seems to be required to accommodate the Swift data might imply that the central engine does not switch off completely.
5 Post-GRB emission above 10 keV
Post-GRB emission above 10 keV is found in two of the 5 GRBs studied (GRB 041219A and GRB 081003A). For GRB 041219A, X-ray emission is detected at the 3.5 level at T0+734125 s (250 s integration time). A power-law model gives the best fit to the spectrum in this interval, with = 2.20.7 and a flux of 2.9 10-10 ergs cm-2 s-1 in the 3–35 keV energy range. Most of the detected emission comes from the soft band (3–10 keV), with 20% of the measured flux detected in the 10–35 keV band.
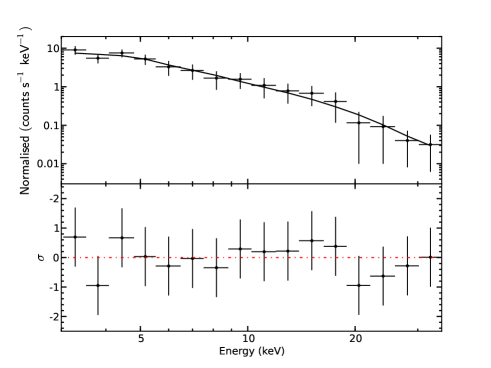
In the case of GRB 081003A, hard X-ray emission is observed during the shallow decay phase. The spectrum is well fit by a single power-law model with a photon index of = 2.250.24 with a flux of 7.4 10-9 ergs cm-2 s-1 in the 3–35 keV band (Fig. 4). Around 43% of this flux comes from radiation above 10 keV. This percentage of hard X-ray emission decreases sharply to 20% at T0+63.5 s, right before the start of the high latitude emission, becoming negligible afterwards.
Acknowledgements
This research is based on observations with INTEGRAL, an ESA project with instruments and science data centre funded by ESA member states (especially the PI countries: Denmark, France, Germany, Italy, Switzerland, Spain), Poland and with the participation of Russia and the USA. AMC and LH acknowledge support from Science Foundation Ireland under grant 09/RFP/AST/2400.
References
- [1] Sakamoto, T., Barthelmy, S., Baumgartner, W., et al. 2011, ApJS, 195, 2
- [2] Fenimore, E., E. 1999, Nuclear Physics B (Proc. Suppl.), 69, 635
- [3] Zhang, B., Fan, Y. Z., Dyks, J., et al. 2006, ApJ, 642, 354
- [4] Falcone, A. D., Burrows, D. N., Lazzati, D., et al. 2006, ApJ, 641, 1010
- [5] Maiorano, E., Masetti, N., Palazzi, E., et al. 2005 A&A, 438, 821
- [6] Grebenev, S. A. & Chelovekov, I. V. 2007, AL, 33, 789
- [7] McBreen, S., Hanlon, L., McGlynn, S., et al. 2006, 455, 433
- [8] Kocevski, D., Ryde, F. & Lian, E. 2003, ApJ, 596, 389