Anomalous roughening in competitive growth models with time-decreasing rates of correlated dynamics
Abstract
Lattice growth models where uncorrelated random deposition competes with some aggregation dynamics that generates correlations are studied with rates of the correlated component decreasing as a power law. These models have anomalous roughening, with anomalous exponents related to the normal exponents of the correlated dynamics, to an exponent characterizing the aggregation mechanism and to that power law exponent. This is shown by a scaling approach extending the Family-Vicsek relation previously derived for the models with time-independent rates, thus providing a connection of normal and anomalous growth models. Simulation results for several models support those conclusions. Remarkable anomalous effects are observed even for slowly decreasing rates of the correlated component, which may correspond to feasible temperature changes in systems with activated dynamics. The scaling exponents of the correlated component can be obtained only from the estimates of three anomalous exponents, without knowledge of the aggregation mechanism, and a possible application is discussed. For some models, the corresponding Edwards-Wilkinson and Kardar-Parisi-Zhang equations are also discussed.
pacs:
PACS numbers: 81.15Aa, 05.40.-a, 05.50.+q, 68.35.Ct, 68.55.-aI Introduction
The technological interest in thin films, multilayers and related nanostructures motivated the study of continuous and atomistic growth models and kinetic roughening theories mbe ; barabasi ; krug . In the simplest cases, surface fluctuations follow the standard Family-Vicsek (FV) scaling relation barabasi ; fv . The amplitudes of fluctuation modes saturate at times increasing with the wavelength and the global roughness saturates when the largest excited mode is of the order of the substrate size. Local and global surface fluctuations scale with the same exponents. This is called normal roughening. On the other hand, a large number of systems show anomalous roughening huo ; saitou ; hasan ; schwarzacher ; auger ; fu ; lafouresse , where local slopes continuously increase and local exponents differ from the global ones schwarzacher ; lopez . Theoretical approaches have shown various conditions, such as symmetries and conservation laws, where anomalous scaling (AS) is expected lopezPRL2005 ; pradas .
With the advance in deposition techniques, changing physico-chemical conditions during the growth of a film is possible. In vapor methods, this can be achieved by varying pressure or temperature. In electrodeposition, the evolution of surface morphology changes the electric field distribution and, consequently, the local reaction rates may change. Thus, local growth is a competition between different dynamic processes (adsorption, reaction, surface diffusion) with time-dependent rates. As a simple illustration, one may consider a constant flux of atoms or molecules and time-varying rates of surface processes (responsible for fluctuation correlations). These features may have significant effects on roughness scaling. For instance, in Ref. chou , it was shown that a sudden change in growth conditions of an Edwards-Wilkinson ew model may lead to power-law relaxation between different growth regimes. Moreover, Ref. pradas shows that stochastic growth equation models with time-dependent couplings have AS under certain conditions.
Those findings motivate the present investigation of lattice models with competition of two aggregation dynamics with time-dependent rates. We consider limited mobility models where uncorrelated random deposition competes with some type of correlated component whose rate decreases in time as a power-law. These systems show AS, in contrast to the normal scaling observed in the original models with constant rates rdcor . The anomalous exponents are related to the (normal) exponents of the correlated growth dynamics and to the exponent of the time-decreasing rate. Those relations are obtained by direct substitution of the time-dependent rate in the FV relation of the model with time-independent rates, which provides a connection between scaling relations of normal and anomalous models. Those conclusions are supported by simulation results. Remarkable anomalous effects are observed even for slowly decreasing rates, which may correspond e. g. to small changes of temperature in systems with activated dynamics. For some models, the general forms of the corresponding Edwards-Wilkinson (EW) ew and Kardar-Parisi-Zhang kpz equations are also discussed.
The hydrodynamic equations associated to our growth models have time-dependent couplings, thus the existence of AS is predicted by the approach of Ref. pradas . However, the aim of work is not discussing conditions for AS, but to explore details of a class of lattice models with realistic dynamics showing that feature, with a simple connection of normal and anomalous roughnening and an important role of the aggregation mechanism. A possible application of our model is discussed, as well as systems where it is certainly not applicable.
The rest of this work is organized as follows. In Sec. II, we review the scaling concepts for competitive models with correlated and uncorrelated components and extend the approach to the FV relation of the height-height correlation function. In Sec. III, we extend that approach to competitive models with time-decreasing rates of the correlated component and calculate their anomalous exponents. Sec. IV shows simulation results of some models in two-dimensional substrates, confirming the theoretical predictions. In Sec. V, we discuss the EW equations (in all dimensions) and KPZ equations (in dimensions) associated to some of those models. In Sec. VI, we discuss the relation with experimental work and the reliability of our models. Sec. VII summarizes our results and conclusions.
II Lattice models with competition of correlated and uncorrelated deposition
In these models, cubic particles of size are sequentially deposited on randomly chosen columns of a -dimensional substrate of lateral size , in a direction perpendicular to the substrate. The time interval for deposition of one layer of atoms [ atoms] is . Each incident particle has two possibilities: (1) permanently stick at the top of the column of incidence, with probability (uncorrelated deposition - UD); (2) execute some movement (diffusion, desorption, or eventually stick at some point of the column of incidence) according to an aggregation rule that takes into account the neighboring column heights, with probability . This second component generates correlations of the column heights and is hereafter called correlated deposition (CD).
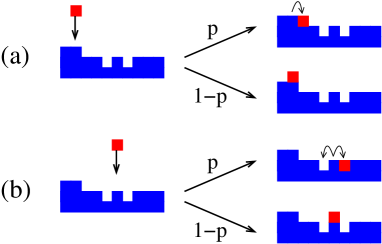
Fig. 1 illustrates the model where the correlated component is random deposition with surface relaxation (RDSR) family . In RDSR, the particle sticks at the top of the column of incidence if no neighboring column has a smaller height, otherwise it sticks at the top of the column with the smallest height among the neighbors (in case of a draw, one of the columns with the smallest height is randomly chosen). The competitive model UD-RDSR and another one involving UD and ballistic deposition (BD) vold were introduced by Albano and co-workers albano1 ; albano2 .
In this section, we consider the case where the probability is kept constant during the film growth.
The global roughness of the film surface is defined as the rms fluctuation of the height around its average position :
| (1) |
where the overbars indicate spatial averages and the angular brackets indicate configurational averages. At short times, UD dominates, thus the roughness increases as
| (2) |
After a crossover time , the CD determines the universality class of the process, characterized by a set of exponents hereafter indexed with . The roughness follows Family-Vicsek (FV) scaling fv as
| (3) |
where is the roughness exponent, is a scaling function such that in the regime of roughness saturation () and is the characteristic time of crossover to saturation, which scales as
| (4) |
where is the dynamic exponent. For (but ), the roughness scales as
| (5) |
where is the growth exponent. In this growth regime, in Eq. (3).
The exponents , and depend on the basic symmetries of the CD, but the amplitudes , and are model-dependent. For small , they scale as
| (6) |
| (7) |
and
| (8) |
where the convention of crossover exponents of Albano and co-workers albano1 was used. FV scaling implies albano1
| (9) |
Different scaling approaches have already explained the values of the exponents obtained in simulations of lattice models rdcor ; albanordcor . Below we review the scaling approach of Ref. rdcor for the global roughness and extend it to the height-height correlation function (HHCF) and the local roughness.
For , most deposited atoms attach to the top of the randomly chosen column (UD). Thus, the height difference of neighboring columns, , is of order after a time interval (as Eq. 2). On the other hand, the average time for a CD event (probability ) to take place at a given column is .
If CD is BD, that event immediately creates correlations between the neighboring columns. Thus, the time of crossover from UD to correlated growth is
| (10) |
This applies to other BD-like models, as discussed e. g. in Ref. bbdflavio .
However, if CD is a solid-on-solid (SOS) model, such as RDSR, a single correlated event does not cancel the random fluctuation of neighboring column heights . Instead, that fluctuation is cancelled only when the number of correlated events is of order . At the crossover time , that number is . Thus
| (11) |
In both cases, all time scales of the purely correlated system () are also changed by the scaling factor , such as the saturation time (Eq. 4). Thus we have for BD-like models and for SOS models in Eq. (7), independently of the class of the CD and substrate dimension (this improves the picture that emerged from a former work lam , which restricted to KPZ and to EW).
The average height difference between neighboring columns saturates at , which is of order both for BD-like and SOS models. This is the scaling factor for global height fluctuations (Eqs. 3 and 6), consequently
| (12) |
It gives for BD-like models and for SOS models. For this reason, a single exponent () fully characterizes the UD-CD crossover.
If one is interested in comparison with experimental data, two other quantities are more useful. The first one is the local roughness , which is averaged over windows of size gliding through the surface. The second one, which will be the focus of most of our calculations, is the HHCF of columns at distance :
| (13) |
Here, the configurational averages (angular brackets) are taken over different initial positions , different orientations of and different deposits. The local roughness and the HHCF have the same scaling properties.
For the competitive models analyzed here, the HHCF in the regime of thin film growth () scales as
| (14) |
The constants and scale as the corresponding ones for the global roughness (Eqs. 6 and 7) and is a scaling function. An alternative form that helps connection to anomalous scaling relations lopez is
| (15) |
where
| (16) |
For small distances (), the HHCF is hereafter called local HHCF and scales as
| (17) |
This quantity is time-independent in systems with normal FV scaling, but time-dependent with anomalous scaling. For large distances, the HHCF is hereafter called saturation HHCF and scales as
| (18) |
Note that for any type of CD with normal scaling, thus the exponent is always negative.
III Competitive models with decreasing rates of correlated components
We consider competitive models whose correlated component has time decreasing probability as
| (19) |
where is positive. Eq. (19) is properly defined for lattice models, so that at all deposition events are correlated (). For long times (), we have
| (20) |
The local HHCF scales with time and distance as
| (21) |
This quantity has the same scaling of the local roughness in small box sizes. Thus, the local roughness exponent is the same of the correlated component, , and the local slope exponent is
| (22) |
This exponent represents the degree of anomaly of the system ( for normal growth). It depends not only on the exponent of the time-decreasing rate but also on the aggregation conditions (BD-like or SOS) through the exponent . However, it does not depend on the universal exponents characterizing the class of the CD.
In theoretical works, is sometimes called the local anomalous growth exponent lopezPRE1996 ; auger . In experimental works, it is frequently called (local growth exponent) huo , but some authors give a different definition for auger . For these reasons, we keep the notation close to that of Ref. lopez , consistently with Eqs. (21) and (22).
The saturation HHCF scales as
| (23) |
This quantity has the same scaling of the local roughness in large box sizes. Here, the global growth exponent is larger than the growth exponent of the CD. In some works, that exponent is denoted as the sum of and auger .
The crossover between growth and saturation regimes of the HHCF occurs when (Eq. 15). This gives the characteristic time as
| (24) |
This shows that the anomalous dynamical exponent is also larger than that of the CD, reflecting the decreasing rate of propagation of correlations. The expected relation
| (25) |
is observed in all cases.
Due to the continuously decreasing role of the correlated dynamics, the global roughness (Eq. 1) does not saturate, but continuously increase (i. e. there is not steady state). This can be shown by direct substitution of the time-dependent form of (Eq. 19) in the FV relation (3), with the predicted forms of the scaling function and of the -dependent amplitudes.
IV Numerical results
Three applications illustrate the remarkable effect of time-decreasing , even in cases where is still of order after deposition of many layers. In all simulations, two-dimensional substrates () are considered.
First, we consider RDSR (also known as Family model - Fig. 1) family as the correlated component. This model is in the EW class, thus and , both corresponding to logarithmic increase of the roughness in time and size, and (diffusive dynamics) ew . Since it is an SOS model, we have , thus Eqs. (23) and (24) give and .
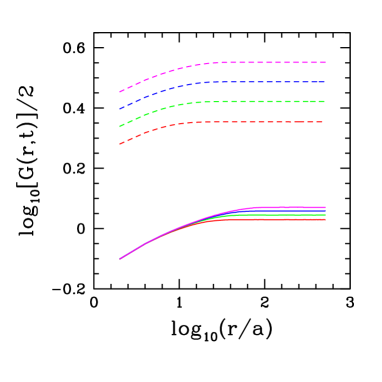
Simulations of the UD-RDSR model were performed with and in substrates of size up to . In Fig. 2, we show the HHCF for and for the pure Family model (, ) at several times. The split of the curves for small box size is a clear signature of anomalous scaling for .
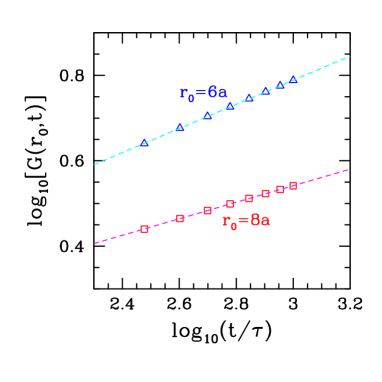
Fig. 3 shows the time evolution of the local correlation function (fixed ) for two values of : for and for . The power-law increase is clear in both cases and the linear fits give estimates of the exponent slightly larger than the prediction of Eq. (22) for . However, exponents calculated from local roughness or correlation function in short-time simulations of lattice models frequently deviate from the expected values of the model class localwidth , thus the deviation in Fig. 3 is not unexpected.
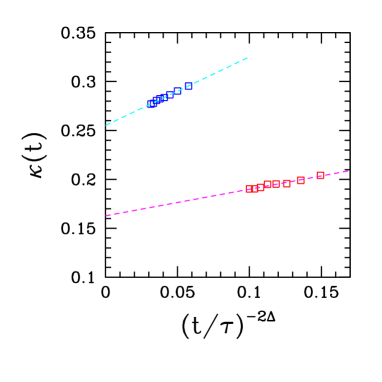
Very accurate estimates of are obtained from the effective exponents
| (26) |
which tend to as , with fixed . We assume that the leading correction to scaling of (not of its square root) is a constant term, in analogy to the intrinsic width in the context of roughness scaling (see e. g. Ref. kpz2d and references therein). Using Eqs. (21) and (22) with , this assumption gives with a correction term proportional to . In Fig. 4, we plot as a function of using the same data of Fig. 3 with . The linear fits give asymptotic estimates for and for , in excellent agreement with the theoretical prediction .
Now we consider BD as the correlated component. In BD, the incident particle attaches to the site where it has a nearest neighbor occupied site (at the sides or below it) barabasi ; vold , creating a porous deposit due to lateral aggregation. The model is in the KPZ class kpz , where , , and marinari ; colaiori ; kpz2d . Using for the competitive model, Eqs. (23) and (24) give and .
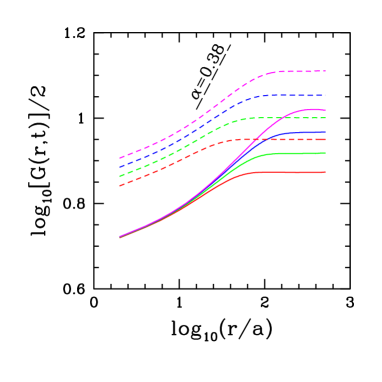
Simulations of the UD-BD model were performed in two-dimensional substrates of size up to , again for and . Fig. 5 shows the HHCF for and for the pure BD model (, ) at several times. Comparison with Fig. 2 shows a smaller split of the curves for small , which is expected for the smaller exponent (Eq. 21).
An interesting effect shown in Fig. 5 is the small slope of the curves in the scaling region, which gives local roughness exponents much smaller than the expected . The apparent roughness exponent is even smaller in the competitive model. However, large discrepancies between exponents from simulations of BD-like models and KPZ values are frequent sigma , thus the deviations in Fig. 5 are not a particular feature of models with AS.
A third model used to illustrate our results has the restricted SOS (RSOS) model kk as the correlated component. The condition for aggregation of a particle at the column of incidence is that the height difference between all neighboring columns cannot exceed one lattice unit, otherwise the aggregation attempt is rejected. This means that the aggregation is accepted only if the height of the column of incidence is smaller than or equal to the heights of all neighbors (this rule is used in the extension to the competitive model). The RSOS model also belongs to the KPZ class and usually shows small scaling corrections. Using for the competitive model and estimates of KPZ exponents marinari ; colaiori ; kpz2d , Eqs. (23) and (24) give and .
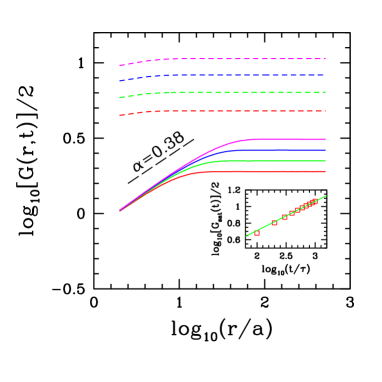
Simulations of the UD-RSOS model are performed in two-dimensional substrates under the same conditions of the previous ones. Fig. 6 shows the HHCF for at times between and . Again, AS is clearly shown by the split of the curves for small , in contrast to the case of time-independent rates.
The inset of Fig. 6 shows the time scaling of for the competitive model, which gives for the longer times. This is in good agreement with the theoretical prediction . Again, extrapolation of effective exponents (not shown) provide estimates much closer to the theoretical prediction.
A strinking feature of this model is the small slope of the curves for small , caused by the large height fluctuation produced by UD, in comparison with the typically small roughness of the RSOS model. This feature masks the asymptotic scaling for small in the model with AS.
V EW and KPZ equations
For competitive models such as UD-RDSR, the general form of the associated EW equation can be derived, with coefficients related to and scaling exponents related to . Consider, for instance, the case in two-dimensional substrates (). The surface tension term of the EW equation ew is expected to decrease in time, thus we propose
| (27) |
where is the height at the position in the -dimensional substrate at time , and are constants, and is a Gaussian noise barabasi ; kpz with zero mean and co-variance .
A complete representation of the lattice model would require calculation of the constants and , as well as the coefficients of higher-order derivatives not shown in Eq. (27). However, that form is sufficient for calculation of scaling exponents. Indeed, scaling arguments following the same lines of Ref. barabasi lead to and global roughness exponent ( lopez ). Since and for the normal EW equation (with coefficients not changing in time) and (SOS model), comparison with Eq. (24) leads to . Equivalently, the full surface tension coefficient is (as predicted in Ref. lam in dimensions). Similar result is obtained for lattice models in the EW class in any other substrate dimension.
On the other hand, the KPZ equation kpz corresponding to such competitive models can be constructed only in :
| (28) |
The roughness amplitudes of Eqs. (3) and (4) scale with the coefficients of the linear and nonlinear terms as and af . Using Eqs. (6), (7), and (19), for BD-like models, we have and . However, for SOS models () in the KPZ class, such as UD-RSOS, we have and . Again, a complete representation of the lattice model by a stochastic equation would require calculation of coefficients of the terms in Eq. (28) (not only their scaling properties) and of higher-order terms not shown there.
VI Discussion
The results for show that anomalous scaling can be observed in competitive growth models even with very slow changes of the rates and far from the crossover region . At (Figs. 2, 4 and 5), we have , i. e. there is a significant contribution of the correlated process. For comparison, numerical work on competitive models with fixed usually focus the regime albano1 ; albano2 ; rdcor . Thus, the time-dependence of the competitive dynamics is the main ingredient for the AS, independently of approaching the crossover region.
Although the competitive models presented here are drastic simplifications of a real thin film growth process, their assumptions are not far from experimentally feasible conditions. If one assumes that the correlated aggregation is an activated process, then the decrease of the probability may be a consequence of decreasing the temperature during the film growth. In the case of an EW or KPZ model, that assumption suggests an Ahrrenius form for the surface tension coefficient as , which gives ( or ). If other processes produce correlations (e. g. surface diffusion), then the coefficients of the corresponding growth equation will also have the Ahrrenius form. Now, assuming that , a temperature decrease from to gives a ratio of probabilities for . For comparison, in Figs. 2, 4 and 5 (), the probability decreases by a factor from to .
Experimental measurement of anomalous exponents , and allows testing the hypothesis of a competition of uncorrelated and correlated deposition. From Eqs. (22), (23), and (24), their values provide estimates of the scaling exponents of the correlated component as
| (29) |
The estimates of and can be compared with existing theories of interface growth. Note that they are measured independently of the exponent , thus it is not necessary a priori knowledge of the aggregation mechanism.
Applications of this model are not expected when is very close to . For instance, if , we obtain and , i. e. the anomalous exponents are much larger than those of theories of normal scaling (the difference is frequently referred as in experimental works). For this reason, the AS with large observed in metal electrodeposition by some authors has to be explained by other approaches huo ; saitou . Other systems showing AS with large values of hasan ; auger ; fu , as well as experiments on metal dissolution cordobaPRL2009 ; cordobaPRE2008 , will also give unreliable estimates of and/or if our competitive model is applied.
On the other hand, the work on electrodeposition by Lafouresse et al lafouresse suggests an application. At the early stages of growth and for low potential values, the exponents , and are obtained. Using our model, we find and . These values are very close to the exponents and of the linear fourth-order stochastic growth equation
| (30) |
(Mullins-Herring class barabasi ; mh ), which represents growth dominated by surface diffusion. Consequently, a possible interpretation of the experiment under those conditions is that the role of the surface diffusion is continuously decreasing in time due to a competition with an uncorrelated random growth.
The results for lattice models shown in Figs. 4 and 5 also suggest that deviations in the small scaling are frequent. Consequently, when experimental data is analyzed and compared to our model, one should consider that a disagreement in the values of may not represent a failure of the model. Instead, this is an expected feature at short times / small thicknesses localwidth .
VII Conclusion
We studied lattice models with competition of correlated and uncorrelated mechanisms for aggregation of deposited particles and where the rate of the correlated component decrease in time as a power-law. The Family-Vicsek scaling relation derived for the case of constant rates is extended by direct substitution of the time-dependent rate, giving anomalous scaling relations that are supported by simulation data. The anomalous exponents are related to the exponents of the correlated growth dynamics and to the exponent of the time-decreasing rate. The EW and KPZ equations corresponding to some models are discussed.
Even with a slow decay of the correlated component, which may correspond to small temperature changes in systems with activated dynamics, a remarkable anomaly is found. Indeed, application of the model is expected only for systems with small anomaly exponent ( or in some works). This excludes most electrodeposition works, but a case of thin films electrodeposited at low potential values shows a possible application of growth dominated by surface diffusion. Since our scaling relations provide exponents of the correlated component depending only on anomalous exponents that can be measured experimentally (independenly of the exponents of the time-decreasing rate and of the aggregation mechanism), the test in other real systems is simple and may eventually help to understand their basic physical mechanisms.
Acknowledgements.
This work was partially supported by CNPq and FAPERJ (Brazilian agencies).References
- (1) Frontiers in Surface and Interface Science, edited by Charles B. Duke and E. Ward Plummer (Elsevier, Amsterdam, 2002).
- (2) A.-L. Barabási and H. E. Stanley, Fractal Concepts in Surface Growth (Cambridge University Press, New York, 1995).
- (3) J. Krug, Adv. Phys. 46, 139 (1997).
- (4) F. Family and T. Vicsek, J. Phys. A 18, L75 (1985).
- (5) S. Huo and W. Schwarzacher, Phys. Rev. Lett. 86, 256 (2001).
- (6) M. Saitou, Phys. Rev. B 66, 073416 (2002).
- (7) N. M. Hasan, J. J. Mallett, S. G. dos Santos Filho, A. A. Pasa, and W. Schwarzacher, Phys. Rev. B 67, 081401(R) (2003).
- (8) W. Schwarzacher, J. Phys. Condensed Matter 16, R859 (2004).
- (9) M. A. Auger, L. Vázquez, R. Cuerno, M. Castro, M. Jergel, and O. Sánchez, Phys. Rev. B 73, 045436 (2006).
- (10) M. C. Lafouresse, P. J. Heard, and W. Schwarzacher, Phys. Rev. Lett. 98, 236101 (2007).
- (11) T. Fu and Y. G. Shen, Physica B 403, 2306 (2008).
- (12) J. M. López, Phys. Rev. Lett. 83, 4594 (1999).
- (13) J. M. López, M. Castro, and R. Gallego, Phys. Rev. Lett. 94, 166103 (2005).
- (14) M. Pradas, J. M. López, and A. Hernández-Machado, Phys. Rev. E 76, 010102(R) (2007).
- (15) Y.-L. Chou, M. Pleimling, and R. K. P. Zia, Phys. Rev. E 80, 061602 (2009).
- (16) S.F. Edwards and D.R. Wilkinson, Proc. R. Soc. London 381, 17 (1982).
- (17) F. D. A. Aarão Reis, Phys. Rev. E 73, 021605 (2006).
- (18) M. Kardar, G. Parisi and Y.-C. Zhang, Phys. Rev. Lett. 56, 889 (1986).
- (19) F. Family, J. Phys. A 19, L441 (1986).
- (20) M. J. Vold, J. Coll. Sci. 14, 168 (1959); J. Phys. Chem. 63, 1608 (1959).
- (21) C. M. Horowitz, R.A. Monetti, E.V. Albano, Phys. Rev. E 63, 66132 (2001).
- (22) C. M. Horowitz and E. V. Albano, J. Phys. A: Math. Gen. 34, 357 (2001).
- (23) C. M. Horowitz and E. V. Albano, Phys. Rev. E 73, 031111 (2006).
- (24) F. A. Silveira and F. D. A. Aarão Reis, Phys. Rev. E 75, 061608 (2007).
- (25) J. M. López and M. A. Rodríguez, Phys. Rev. E 54, R2189 (1996).
- (26) L. A. Braunstein and C.-H. Lam, Phys. Rev. E 72, 026128 (2005).
- (27) A. Chame and F. D. A. Aarão Reis, Surf. Sci. 553, 145 (2004).
- (28) F. D. A. Aarão Reis, Phys. Rev. E 69, 021610 (2004).
- (29) E. Marinari, A. Pagnani and G. Parisi, J. Phys. A 33, 8181 (2000).
- (30) F. Colaiori and M. A. Moore, Phys. Rev. Lett. 86, 3946 (2001).
- (31) F. D. A. Aarão Reis, Physica A 364, 190 (2006).
- (32) J. M. Kim and J. M. Kosterlitz, Phys. Rev. Lett. 62, 2289 (1989).
- (33) J.G. Amar and F. Family, Phys. Rev. A 45, R3373 (1992).
- (34) P. Córdoba-Torres, T. J. Mesquita, I. N. Bastos, and R. P. Nogueira, Phys. Rev. Lett. 102, 055504 (2009).
- (35) P. Córdoba-Torres, I. N. Bastos, and R. P. Nogueira, Phys. Rev. E 77, 031602 (2008).
- (36) W. W. Mullins, J. Appl. Phys. 28, 333 (1957); C. Herring, in The Physics of Powder Metallurgy, ed. W. E. Kingston (McGraw-Hill, New York, 1951).