Anomalous diffusion of proteins in sheared lipid membranes
Abstract
We use coarse grained molecular dynamics simulations to investigate diffusion properties of sheared lipid membranes with embedded transmembrane proteins. In membranes without proteins, we find normal in-plane diffusion of lipids in all flow conditions. Protein embedded membranes behave quite differently: by imposing a simple shear flow and sliding the monolayers of the membrane over each other, the motion of protein clusters becomes strongly superdiffusive in the shear direction. In such a circumstance, subdiffusion regime is predominant perpendicular to the flow. We show that superdiffusion is a result of accelerated chaotic motions of protein–lipid complexes within the membrane voids, which are generated by hydrophobic mismatch or the transport of lipids by proteins.
pacs:
87.16.dj, 87.15.Vv, 87.14.ep, 82.20.WtI Introduction
Lipid bilayers are the essential parts of any living cell. They constitute the main body of the cell membrane while being found in different organelles inside the cell. The cell membrane hosts collections of proteins and lipid rafts and it is crowded with a variety of biomolecules. In such non-homogenous and diverse environments, the diffusion of protein molecules in lipid bilayers plays a vital role in different biological processes like cell signaling. The diffusion of lipids and proteins is not a distinct phenomenon and depends on the environment and neighboring molecules Dix and Verkman (2008), and even changes from cell to cell Wieser et al. (2009). Transmembrane proteins diffuse as dynamic complexes with lipids Niemelä et al. (2010); Prasad et al. (2007), and their interactions with lipid molecules mediates traffic in cell membranes. Experiments show that the hydrophobic mismatch between proteins and lipids controls the diffusion coefficient of molecules inside a bilayer Ramadurai et al. (2010); Gambin et al. (2010).
Anomalous sub- and super-diffusion processes are more efficient scenarios for finding a nearby target than normal diffusion Guigas and Weiss (2008); Bartumeus et al. (2002), and they enhance the formation of protein complexes and signal propagation. According to experiments, the mean square displacement (MSD) of membrane channel proteins of human kidney cell exhibits subdiffusion Weigel et al. (2011). The addition of cholesterols to lipid membranes Jeon et al. (2012), and the augmented area coverage of membrane proteins Ramadurai et al. (2009) also lead to subdiffusion of lipids and proteins. Superdiffusivity has been observed in several physical systems and is often associated with Lévy flights. Prominent examples are the chaotic motion of particles in a rotating laminar flow Solomon et al. (1993) with long-range flights and horizontally vibrated grains which exhibit Lévy flight with small jumps compared to their diameter Lechenault et al. (2010). Nevertheless, an active component such as molecular motor can also be the source of superdiffusivity. A recent study by Köhler et al. (2011) shows that in a gel composed of actin filaments, fascin molecules and myosin-II filaments, the diffusion of small actin and fascin clusters are superdiffusive because of the work done by molecular motors.
In many conditions membranes are under shear. When a red blood cell (RBC) migrates through vessels smaller in diameter than itself, the RBC membrane is under shear. The blood flow exerts tangential shear stresses on vascular endothelia, and initiates cellular processes like activating G protein-coupled receptors. These receptors are able to sense the fluid shear stress as an increase in the lateral membrane tension, and subsequently go through conformational changes Chachisvilis et al. (2006). The temporal and spatial changes in the membrane fluidity, in response to shear flow, have been observed experimentally Butler et al. (2001); Haidekker et al. (2000).
In this study we are
interested in the diffusivity of lipid and protein molecules in flat membranes under
shear flow, and attempt to answer three fundamental questions using molecular
dynamics (MD) simulations: (i) Do lipid molecules have different diffusion coefficients
parallel and perpendicular to flow direction? (ii) How does a simple shear flow
influence the random motions of transmembrane proteins? (iii) Is there any correlation
between the population of proteins and their diffusion in the membrane?
II Model and methods
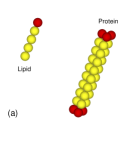
We simulate lipid membranes utilizing a flexible lipid model Goetz and Lipowsky (1998) and triple-strand rigid proteins Khoshnood et al. (2010) [Fig. 1(a)]. Although different coarse grained models have been developed over years Marrink et al. (2007), the model adopted here has the ability to mimic the physical properties of lipid membranes. The model is not a true coarse grained model but can qualitatively describe phenomena related to lipid membranes and associated transmembrane proteins as we will compare some of our results with true coarse grained and atomistic models. Our goal is to explore the effect of shear flow on the motion of lipid and protein molecules over nanosecond time scales. We perform MD simulations of an ensemble, where the number of particles , the volume and the temperature are held constant. Lees-Edwards boundary condition is employed to generate simple shear flow with the shear rate Allen and Tildesley (1991). Other boundary conditions are periodic. The temperature is set to so that the system is safely above the gel to liquid phase transition temperature of different phosphatidylcholine lipid bilayers. A detailed description of the model can be found in Khoshnood et al. (2010).
We express the position and velocity vectors of particles in the Cartesian coordinate system whose origin is located at the center of our cubic simulation box. The and axes lie in the membrane plane and the axis is perpendicular to that. MD scales of length, time, mass and energy are , , and , respectively. is the Avogadro’s number. In all simulations, the dimensions of the box along the coordinates axes, , and , are set to . The total number of particles equals , which gives a fixed number density, , and a constant average fluid pressure of for all simulations. Here, we note that isotropic pressure control is not appropriate in the simulation of lipid membranes since their volume is constant in the laboratory and biological conditions. However, a fixed number density will give a constant average pressure and physical properties of lipid membranes with different number of lipids and proteins can be compared. Physical quantities are measured using a run-time of . An important mechanical property of every membrane is the surface tension that mainly affects the diffusion of lipid molecules. We compute the tension of our model membranes from
| (1) |
where () are the components of the pressure tensor Allen and Tildesley (1991).
In this study we apply MSD to determine the diffusion properties of randomly moving particles. The diffusion coefficient is thus calculated using the Einstein expression
| (2) |
where and is the displacement due to the random motion of the th particle in the -direction. The summation in Eq. (2) is taken over the particles of the same type. From here on, we will drop the summation sign for brevity. The operator denotes the canonical average. Eq. (2) describes the regular Brownian motion when the MSD is linearly proportional to . The diffusion process is anomalous should the MSD deviate from the linear form, and obey the relation
| (3) |
where is the diffusion exponent and is the fractional diffusion coefficient. The regimes with and are subdiffusive and superdiffusive, respectively. To obtain smooth MSD curves, we evolve systems of 80 different initial conditions and report their ensemble-averaged diffusion coefficients and MSDs. The diffusion of lipids is investigated by tracing the motion of their head groups. Proteins are traced using their center of masses.
In equilibrium models without external shearing, there is no streaming in the
solvent–membrane system. Therefore, the flux of particles is associated with their random
motions, and any displacement is due to thermal fluctuations. In sheared membranes,
however, there is a combination of streaming and diffusive fluxes. We thus need to
distinguish and eliminate the streaming flux when calculating the MSD. Let us define
the actual velocity components of the th particle as
where
is the average streaming velocity, and is the peculiar velocity
whose time integral gives the displacements in Eqs. (2) and (3).
In equilibrium models, the average velocities vanish and we
obtain . With external shearing, the flow
is always imposed in the -direction. Therefore, and
are directly integrated to find the corresponding displacements. When the simulation box is
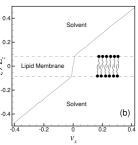
uniformly filled with one type of particles (let us says solvent particles), one readily finds
. In the presence of a lipid bilayer, the vertical velocity
profile in the -direction is no longer linear [see Fig. 1(b)]. Therefore, to obtain
the MSD of lipids, we define as the average velocity of the layer
where the head groups of phospholipds reside, and obtain
.
It is remarked that transmembrane proteins do not experience streaming movements,
, because the shear forces exerted on their end points
from the upper and lower solvent columns are equal and in opposite directions.
III Diffusion of lipids
The lateral diffusion of lipids in equilibrium conditions is enhanced as the membrane tension increases. This has been observed in simulations by atomistic Muddana et al. (2011) and coarse grained models Neder et al. (2010) and is because by stretching the membrane, the area per lipid increases and more space is provided for the free motion of lipids. Our simulations with this very simple model shows the same pattern. By turning on the shear flow, lipid molecules undergo an initial ballistic motion that transforms into an interval of subdiffusion with [Fig. 2]. The transient anomalous state has been observed in atomistic simulations Flenner et al. (2009) as well. After the transient anomalous diffusion and over longer time scales a normal diffusion with is observed [Fig. 2]. It is noted that we have found similar MSD profiles for lipid molecules in equilibrium and sheared systems, and in both cases lipids ultimately develop normal diffusion. Although Kneller et al. (2011) reported a permanent subdiffusive behavior by the atomistic simulation of lipid membranes in equilibrium, experiments support a final regular diffusion regime, as we do, even in the presence of obstacles Skaug et al. (2011). We conclude that the diffusion regime of lipid molecules is invariant with and without external shearing.
The diffusion coefficients obtained from the normal diffusion region of MSD plots,
are larger for smaller shear rates. For example, for a membrane
of lipid molecules, we find ,
and . For the same
system under a shear flow of , the membrane tension
drops to and diffusion coefficients
reduce to and .
The reason is that the membrane thickness increases for higher shear rates and the
tension decreases without any change in the area per lipid Khoshnood et al. (2010). Consequently,
the fluidity of the membrane decreases and slows down the diffusion process.
After applying the shear force, we find that drops for about while
remains almost constant with only change which is not statistically
significant since it is less than the mean standard error for diffusion coefficients
which is less than . The difference between and is indistinguishable in
Fig. 2. We speculate that the alignment of lipid chains with the flow
breaks the isotropy and yields . Atomistic simulation of lipid membrane
Muddana et al. (2011) has shown that increasing the tension of membrane, induced by altering the area
per lipid, result in larger lateral diffusion coefficients. This change is not linear with
tension and they have reported increase in lateral diffusion coefficient. Coarse grained
simulations Neder et al. (2010) showed that for larger tensions the increase in diffusion
coefficient slows down and it depends on the range of tension. In our simulation, shear flow
induces change in tension and consequently result in a different diffusion coefficient
in the flow direction. In the -direction, perpendicular to the membrane plane, our MSD
plots always show a confined motion as is expected.
IV Diffusion of proteins
We add rod-like proteins to the membrane, and simulate models with different protein concentrations that vary significantly from cell to cell. Since proteins increase the membrane tension as they perturb the distribution of lipids Khoshnood et al. (2010), we increase the number of lipids (proportional to proteins) to keep the membrane almost tensionless. In equilibrium and for a membrane with a single embedded protein with , we can measure the diffusion coefficients since the MSD of protein shows an ultimate regular diffusion. We find and , which are equivalent to with less than error. These values are larger than experimental values, by two orders of magnitude. The obvious reason is the effect of coarse graining that has reduced the interdigitation and friction between molecules, and allows for faster movements of particles. The reduced friction affects both membrane component and solvent motion and consequently decreases both solvent and membrane viscosity. Viscosity of a fluid is a determinant of mobility or diffusion in that medium. Another minor source of discrepancy is the smaller size of our model proteins compared to real integral proteins.

We note that the average diffusive behavior of lipids is unaffected by the presence of proteins. We computed the average MSD profile of lipids for the above system and found the same pattern of initial ballistic regime, transient subdiffusive region and final normal diffusion. The diffusion coefficients for our model proteins is smaller than model lipid molecules by a factor of . This is expected because of the larger size and mass of proteins compared to lipids.
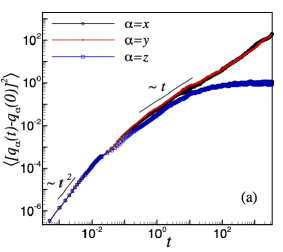
An initial ballistic motion the same as what has been observed for lipids is recovered for proteins by using time step as small as for . This regime is shared by all the systems regardless of the shear rate and the number of proteins. By putting the system under simple shear flow, proteins undergo Brownian motion when only two proteins are used [Fig. 3(a)]. One could anticipate this result, for single proteins cannot remarkably perturb the distribution of lipids, and change the diffusion properties of the membrane.
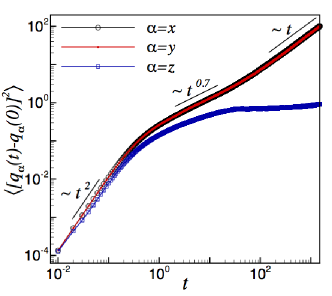
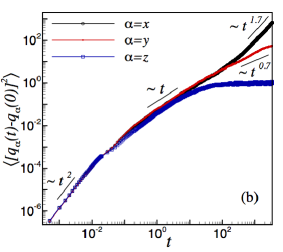
With 4 proteins, however, we observe that they form two double-protein clusters (due to the depletion force), and exhibit a strong superdiffusive motion parallel to the flow. Fig. 3(b) shows how after the normal diffusion regime transforms to strong superdiffusion with in the -direction. Interestingly, this exponent is the same as the superdiffusion exponent found by Köhler et al. (2011) for active diffusion of protein clusters by molecular motors. Because of crowding effect and increase in the concentration of proteins Dix and Verkman (2008), our results show a subdiffusive behavior along the axis with . Weigel et al. (2011) observed in experiments with channel proteins of human kidney cell, and Javanainen et al. (2013) found by molecular simulations of aggregating NaK channel proteins. For clarity, the upper parts of the MSD profiles in Figures 3(a) and 3(b) are plotted together in Fig. 3(c).
To rule out the effect of statistical errors in the development of anomalous behavior, we have divided the MSD profiles of the system with 4 proteins to smaller intervals, and separately calculated and its error over each interval using the curve fitting toolbox of MATLAB. We have then assigned the mean value to the center of the time interval and plotted the calculated diffusion exponent versus time in Fig. 4. For instance, over the initial ballistic zone, we have obtained from to , and assigned this value to . Fig. 4 shows that approaches and in the - and -directions, respectively.

To understand the physical mechanism behind the observed anomaly, we conduct the following analysis. Let us define the local concentration of the head particles of lipid and protein molecules at the position r and time as where , and is the position vector of the th head particle. denotes the total number of head particles in the monolayer, is the Heaviside step function, and is the typical size of the cross section of a protein cluster (or a protein–lipid complex). Our numerical experiments show is the best choice. We examine the trajectories of protein molecules and the spatial variation of the normalized distribution to explain the physics of observed superdiffusion. Here and are the minimum and maximum values of at a given time . Fig. 5 demonstrates contour plots of for the upper and lower monolayers at a randomly chosen time.
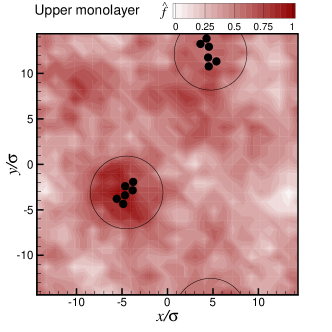
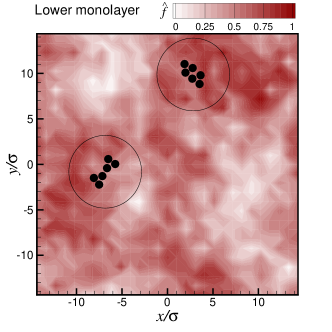
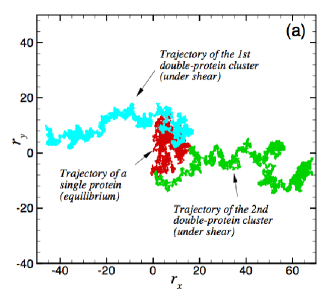
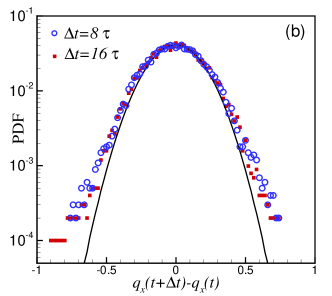
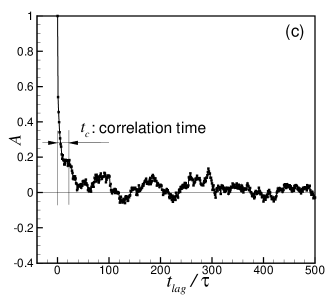
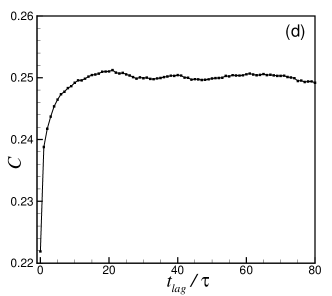
Fig. 6(a) demonstrates the trajectories of a single protein molecule and two double-protein clusters, in equilibrium and sheared systems, respectively. The equilibrium trajectory corresponds to regular diffusion because it covers a definite area. In the sheared system the trajectories are elongated and aligned with the flow direction, indicating a fractional random walk: local isotropic wanderings followed by small-step jumps mainly in the flow direction. These successive jumps can be interpreted by inspecting the contour plots of over a long duration of time. The hydrophobic mismatch between protein clusters (which have asymmetric big cross sections) and the membrane disturbs the bilayer thickness and the arrangement of nearby lipids. Moreover, proteins are able to transport their neighboring lipids with them and behave as dynamic complexes Prasad et al. (2007); Niemelä et al. (2010). These two effects collaborate to create transient voids whose distribution can be described by (light shades in Fig. 5). When the bilayer is sheared, protein–lipid groups are pushed into the voids created by themselves or other groups/complexes and experience accelerated, and therefore, superdiffusive movements. It should be noted that during our simulations, the center of mass of the membrane and embedded proteins remains almost at the center of the coordinate system.
None of our samples show long-step straight motions of protein clusters. What we have seen are small-step jumps, which are comparable with the mean distance between protein clusters and voids [compare Figs. 5 and 6(a)]. We have computed the probability distribution function (PDF) of protein displacements and plotted it in Fig. 6(b). A Gaussian function has been fitted to the data by setting its maximum to the maximum of PDF, and its variance is found using the full width at half minimum of PDF. The PDF exhibits a deviation from normal distribution and it has tails. We have also applied the Kolmogorov-Smirnov test Press et al. (2007) to confirm that the PDF is not a normal Gaussian. This is a clear indication of anomalous diffusion.
As we noted before, the ends of proteins are pulled in opposite directions by the two sheared solvent columns. An important question is why do protein clusters prefer to jump into the voids when the membrane is sheared? We have a simple explanation for this behavior: Two ends of proteins attract lipids from two different layers of the membrane. Thus, the symmetry in the distribution of the upper and lower protein-bound lipids is likely to break. Moreover, the shear force is exerted by the solvent on both the lipid and protein heads. The mentioned symmetry breaking thus leads to different force components at the upper and lower ends of protein–lipid complexes, and they will jump into a void in the direction specified by the broken symmetry. To quantify this process, we take a sample two-protein cluster and define and as the center of masses of its protein heads in the upper and lower leaflets, respectively. We then compute
| (4) |
which is proportional to the net shear force exerted on the cluster at the time step : the local effective area in contact with a solvent column is determined by the number of head particles, and the shear force is calculated by multiplying the effective contact area by the shear rate and viscosity. will be zero if the concentrations of the head particles of lipids are identical around the two heads of the cluster. Defining as the average of , the autocorrelation function
| (5) |
plotted in Fig. 6(c) carries interesting information about the shear force experienced by the cluster: the correlation time shows a sustained accelerated motion of the cluster over , independent of the initial time . Moreover, the oscillatory decaying profile of shows a random symmetry breaking in the sense of deterministic chaos (Argyris et al., 1994, §5.3.4). The existence of a correlation time can also be verified by studying the cross-correlation function
| (6) |
over one of the leaflets. Fig. 4(d) shows that of the upper leaflet steeply rises
from and peaks at , which is the earliest time span
that protein–lipid complexes need to occupy their nearest voids. This is quite consistent with
the acceleration time scale of protein clusters predicted by the autocorrelation function
. For the cross-correlation function remains
almost flat because the size of a void is always bigger than the distance that a protein
cluster travels during .
V Conclusions
In this work, we use a toy model of proteins and lipids to simulate the dynamics of cell membranes undergoing shear flow. We calculate the MSD profile of lipids and proteins in equilibrium and sheared system and compare our result with existing works in the literature. This simple model beautifully captures the basic regimes in the diffusive behavior of lipid molecules: short initial ballistic regime, transient subdiffusive regime and final Normal diffusion. All-atom MD simulations show the same diffusive regions in the MSD profile of lipid molecule Flenner et al. (2009). Moreover, we show that shear flow reduces the tension of membrane and consequently decreases the diffusion coefficient in the direction of flow. The fact that reducing membrane tension slows down lipids movement has been reported as the result of all-atom MD simulations Muddana et al. (2011) and experimental measurements Butler et al. (2001).
Since there were small number of protein molecules in the system, we did extensive MD simulations to obtain the final MSD profiles for proteins. Our C++ code, which has already been calibrated Khoshnood et al. (2010) for membranes under simple shear flow, is not parallel and allows only for small-scale simulations. We have recovered our results by LAMMPS for models in equilibrium conditions. However, LAMMPS has not the capability of imposing simple shear flow conditions and we could not use it to run our sheared systems over longer time scales. Despite these limitations, the smooth MSD profiles obtained from our numerous samples clearly show the distinction between the regular diffusion of single proteins and anomalous diffusion of protein clusters. We explain this anomaly by deliberately examine the distribution of head particles of lipids and proteins and introducing void generation mechanism. Our simulations cover timescales of order of nanoseconds.
Cell responses to stimuli are fast due to enhanced mobility of protein receptors.
Consider our findings, superdiffusion of proteins under shear flow can play a
dominant role in the process of signaling in endothelium cells, RBCs, liposomes
used for targeted drug delivery and other sheared membranes. We note that since
the length and shape of proteins and their ability in attracting neighboring lipids
controls the sizes of voids —there was no other mechanism in our models for void
generation— superdiffusion properties reported in this study are not universal
and they highly correlate with the properties of embedded proteins. Simulations
using detailed structures of lipids and proteins are needed to better assess the
superdiffusive behavior in realistic cell membranes. Experimental exploration
of our results can be done using single particle tracking Crane and Verkman (2008) which can
give the MSD of proteins directly.
Acknowledgments
We thank anonymous referees for their insightful comments that helped us to improve the presentation of our results. A.K. was partially supported by the National Elites Foundation of Iran. We express our sincere thanks to Prof. Ali Meghdari for his helpful discussions and encouragements.
References
- Dix and Verkman (2008) J. A. Dix, and A. S. Verkman, Annu. Rev. Biophys., 37, 247 (2008).
- Wieser et al. (2009) S. Wieser, J. Weghuber, M. Sams, H. Stockinger, and G. J. Schuetz, Soft Matter, 5, 3287 (2009).
- Niemelä et al. (2010) P. S. Niemelä, M. S. Miettinen, L. Monticelli, H. Hammaren, P. Bjelkmar, T. Murtola, E. Lindahl, and I. Vattulainen, J. Am. Chem. Soc., 132, 7574 (2010).
- Prasad et al. (2007) A. Prasad, J. Kondev, and H. A. Stone, Phys. Fluids, 19, 113103 (2007).
- Ramadurai et al. (2010) S. Ramadurai, A. Holt, L. V. Schafer, V. V. Krasnikov, D. T. S. Rijkers, S. J. Marrink, J. A. Killian, and B. Poolman, Biophys. J., 99, 1447 (2010).
- Gambin et al. (2010) Y. Gambin, M. Reffay, E. Sierecki, F. Homble, R. S. Hodges, N. S. Gov, N. Taulier, and W. Urbach, J. Phys. Chem. B, 114, 3559 (2010).
- Guigas and Weiss (2008) G. Guigas and M. Weiss, Biophys. J., 94, 90 (2008).
- Bartumeus et al. (2002) F. Bartumeus, J. Catalan, U. L. Fulco, M. L. Lyra, and G. M. Viswanathan, Phys. Rev. Lett., 88, 097901 (2002).
- Weigel et al. (2011) A. V. Weigel, B. Simon, M. M. Tamkun, and D. Krapf, Proc. Natl. Acad. Sci., 108, 6438 (2011).
- Jeon et al. (2012) J.-H. Jeon, H. M.-S. Monne, M. Javanainen, and R. Metzler, Phys. Rev. Lett., 109, 188103 (2012).
- Ramadurai et al. (2009) S. Ramadurai, A. Holt, V. Krasnikov, G. van den Bogaart, J. A. Killian, and B. Poolman, J. Am. Chem. Soc., 131, 12650 (2009).
- Solomon et al. (1993) T. H. Solomon, E. R. Weeks, and H. L. Swinney, Phys. Rev. Lett., 71, 3975 (1993).
- Lechenault et al. (2010) F. Lechenault, R. Candelier, O. Dauchot, J. P. Bouchaud, and G. Biroli, Soft Matter, 6, 3059 (2010).
- Köhler et al. (2011) S. Köhler, V. Schaller, and A. R. Bausch, Nat. Mater., 10, 462 (2011).
- Chachisvilis et al. (2006) M. Chachisvilis, Y. Zhang, and J. A. Frangos, Proc. Natl. Acad. Sci., 103, 15463 (2006).
- Butler et al. (2001) P. J. Butler, G. Norwich, S. Weinbaum, and S. Chien, Am. J. Physiol. Cell Physiol., 280, C962 (2001).
- Haidekker et al. (2000) M. A. Haidekker, N. L’Heureux, and J. A. Frangos, Am. J. Physiol. Heart Circ. Physiol., 278, H1401 (2000).
- Goetz and Lipowsky (1998) R. Goetz and R. Lipowsky, J. Chem. Phys., 108, 7397 (1998).
- Khoshnood et al. (2010) A. Khoshnood, H. Noguchi, and G. Gompper, J. Chem. Phys., 132, 025101 (2010).
- Marrink et al. (2007) S. J. Marrink, H. J. Risselada, S. Yefimov, D. P Tieleman, and A. H. de Vries, J. Phys. Chem. B, 111, 7812 (2007).
- Allen and Tildesley (1991) M. P. Allen, and D. J. Tildesley, Computer Simulation of Liquids, (Oxford University Press, Oxford, UK., 1991).
- Neder et al. (2010) J. Neder, B. West, P. Nielaba, and F. Schmid, J. Chem. Phys., 132, 115101 (2010).
- Muddana et al. (2011) H. S. Muddana, R. R. Gullapalli, E. Manias, and P. J. Butler, Phys. Chem. Chem. Phys., 13, 1368 (2011).
- Flenner et al. (2009) E. Flenner, J. Das, M. C. Rheinstadter, and I. Kosztin, Phys. Rev. E, 79, 011907 (2009).
- Kneller et al. (2011) G. R. Kneller, K. Baczynski, and M. Pasenkiewicz-Gierula, J. Chem. Phys., 135, 141105 (2011).
- Skaug et al. (2011) M. J. Skaug, R. Faller, and M. L. Longo, J. Chem. Phys., 134, 215101 (2011).
- Javanainen et al. (2013) M. Javanainen, H. Hammaren, L. Monticelli, J.-H. Jeon, M. S. Miettinen, H. Martinez-Seara, R. Metzler, and Ilpo Vattulainen, Faraday Discuss., (2013).
- Press et al. (2007) W. H. Press, S. A. Teukolsky, W. T. Vetterling, and B. P. Flannery, Numerical Recipes: The Art of Scientific Computing, 3rd Edition, (Cambridge University Press, 2007)
- Argyris et al. (1994) J. H. Argyris, G. Faust, and M. Haase, An exploration of chaos: an introduction for natural scientists and engineers, (North-Holland, 1994)
- Crane and Verkman (2008) J. M. Crane, and A. S. Verkman, Biophys. J., 94, 702 (2008).