Spectral properties of a sample of type 1 AGNs: influence of star formation
Abstract:
To find the spectral properties of AGNs in optical spectral band (around the H line) we constructed an Fe II template, that is covering Fe II emission from 4100 Å to 5600 Å. Using the new Fe II template we explored spectral properties of 302 type 1 AGNs. The most interesting results we found is the correlation of the H Full Width at Half Maximum (FWHM) and luminosity for a subsample of type 1 AGNs where the ratio of narrow lines indicates a significant starburst contribution.
1 Introduction
There are some indications that evolution of AGNs is probably related with starburst regions (see Lípari and Terlevich 2006; Mao et al. 2009; Sani et al. 2010). Namely, it is possible that AGNs in an earlier phase of their evolution are composed of starburst (star-forming) regions and the central engine, that is AGN, and, during evolution, the starburst contribution becomes weaker and/or negligible (Wang and Wei 2006, 2008; Mao et al. 2009). On the other hand, it is expected that Fe II strength may vary with evolution of AGNs. The optical Fe II ( 4000-5400 Å) emission arises from numerous transitions of the complex Fe II ion. Numerous lines are overlap, forming the complex shapes in 4000-5400 Å range and making one of the most interesting features in AGN spectra. It is seen in almost all type-1 AGN and it is especially strong in narrow-line Seyfert 1s (NLS1s). Origin of the optical Fe II lines, the mechanisms of their excitation and location of the Fe II emission region in AGN, are still open questions (see Kovačević et al. 2010 and references therein). There are also many correlations between Fe II emission and other AGN properties which need a physical explanation.
Lípari and Terlevich 2006 have explained some properties of AGN by an “evolutive unification model”. In this model, accretion arises from the interaction between nuclear starbursts and the supermassive black hole. Thus, young AGN have strong Fe II, BALs, weak radio emission, the NLR is compact and faint, and broad lines are relatively narrow. In contrast with this, old AGNs have weak Fe II, no BALs, strong radio emission with extended radio lobes, the NLR is extended and bright, and the broad lines have greater velocity widths.
In this paper we analyze how the presence/absence of the starburst contribution to the AGN spectra influences to the correlations between different spectral properties, specially to the Fe II emission. To investigate the iron lines, we use our model of iron template, based on the physical properties of iron region.
2 The sample and analysis
For this investigation we use the sample of 302 AGNs Type 1, selected with criteria described in Kovačević et al. (2010).
The sample has approximately an uniform redshift distribution in the range of z=0–0.7 and negligible host galaxy contribution.
As it is described in Kovačević et al. (2010), the emission lines within the 4400 – 5500 Å range are fitted with multiple Gaussians, where each Gaussian represent contribution from different emission region. The Balmer lines are fitted with three components: a narrow, an intermediate and a very broad component (H NLR, ILR and VBLR, respectively). We assumed that all narrow lines originate from the same emission region, and consequently they have the same width and shift. The H broad component is taken as the sum of the H ILR and H VBLR components, and FWHM (Full Width Half Maximum) of H line is measured only for the H broad line (see Kovačević et al. 2010). The iron lines within 4400 – 5500 Å range are fitted with template presented in Section 3.1.
The possible contribution of starbursts in AGN Type 1 spectra has been reported, using the BPT diagnostic (BPT - Baldwin, Philips & Terlevich 1981) in some investigations: Popović et al. (2009) found that in the case of NLSy1 galaxy Mrk 493, the narrow-line ratios correspond to starbursts rather than to an AGN origin. Similar result is found in paper of Mao et al. (2009) for the three AGN Type 1, which are mainly excited from starburst in narrow lines, since they belong to the H II part of BPT diagram.
Since we have complete measurements of line parameters only for the narrow H and [O III] lines in the whole sample (302 AGNs), we accepted a criteria of Rlog([O III]/H NLR) = 0.5 as an indicator of the predominant starburst emission contribution to the narrow emission lines (for details see Popović & Kovačević 2011). We divided our sample into two subsamples: R 0.5 (91 AGNs, hereafter starburst dominant) and R 0.5 (210 AGNs, hereafter AGN dominant). Then, we performed correlations between measured spectral properties for two subsamples, in order to check if there are some significant differences in correlation coefficients, which may be signature of different physical properties of emission regions.
3 Results
3.1 Fe II template
For investigation of the origin of iron lines and for analysis of their correlations with other lines, it is necessary to apply a good template which will fit well iron lines within 4000-5500 Å range. Also, precise Fe II template is needed to accurately separate the [O III] and Balmer lines, which overlap with Fe II. But, the construction of iron template is very difficult since the iron lines form the features of a complex shape.
A few empirical and theoretical templates are proposed in literature (Veron-Cetty et al. 2004, Dong et al. 2008, Bruhweiler & Verner 2008), but they can not explain very well all varieties of the Fe II emission. Namely, in the case of some AGN spectra, specially when the blue bump of Fe II emission (4400-4700 Å) has higher strength than red one (5100-5600 Å), these models can not enable a good fit (see Appendix B in Kovačević et al. 2010).
We calculated the Fe II template, using 67 Fe II emission lines, identified as the strongest within the 4100-5600 Å range. The 52 of them are separated in the five line groups according to their lower level of transition: , , , and (in further text , , , and group of lines). A simplified scheme of those transitions is shown in Fig 1.
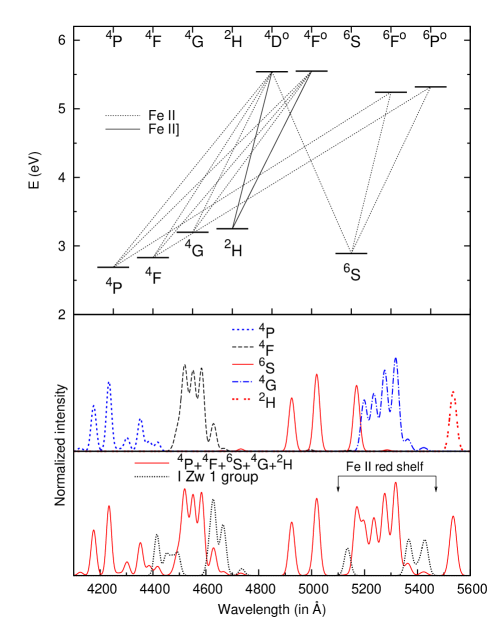
The lines from five line groups describe about 85% of Fe II emission in the observed range (4000-5600 Å), but about 15% of the Fe II emission can not be explained with permitted lines which excitation energies are close to these of lines from the five line groups. The missing parts are around 4450 Å, 4630 Å, 5130 Å and 5370 Å.
There are some indications that the process of fluorescence (self-fluorescences, continuum-fluorescences or Ly and Ly pumping) may have a role in appearing of some Fe II lines (Verner et al. 1999, Hartman & Johansson 2000). They could supply enough energy for exciting the Fe II lines with high energy of excitation, which could be one of the explanation for emission in these wavelengths.
In order to complete the template for missing 15%, we selected 15 lines, which probably arise with some of these mechanisms, from Kurutcz database111http://kurucz.harvard.edu/linelists.html. The selected lines have wavelengths on missing parts, strong oscillator strength and their energy of excitation goes up to 11 eV. Relative intensities of these 15 lines are addopted from I Zw 1 spectrum by making the best fit together with Fe II lines from three line groups. The table of selected lines and their relative intensities are given in Kovačević et al 2010) and Shapovalova et al. (2012).
We have assumed that each of lines can be represented with a Gaussian, described by width (W), shift (d) and intensity (I). Since all Fe II lines from the template probably originate in the same region, with the same kinematical properties, values of d and W are the same for all Fe II lines in the case of one AGN, but intensities are assumed to be different. We suppose that relative intensities between the lines within one line group (, , , or ) can be obtained as (Popović et al. 2009, Kovačević et al. 2010):
| (1) |
where and are intensities of the lines with the same lower level of the transition, and are transition wavelengths, and are statistical weights for the upper energy level of the corresponding transition, and and are oscillator strengths, and are energies of the upper level of transitions, is the Boltzman constant and is the excitation temperature. The list of 52 selected lines from three line groups, their oscillator strengths and calculated relative intensities for different excitation temperatures are given in Kovačević et al. (2010) and Shapovalova et al. (2012).
Finally, the template of Fe II is described by 9 free parameters in fit: width, shift, six parameters of intensity - for , , , and line groups and for lines with relative intensities obtained from I Zw 1. The 9th parameter is excitation temperature included in the calculation of relative intensities within line groups.
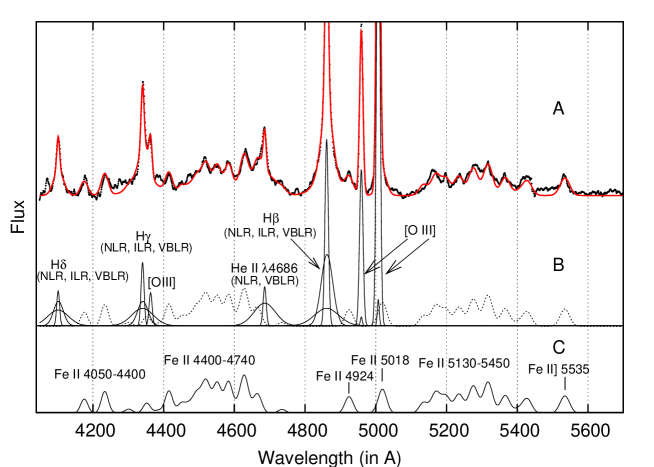
The fit of the Fe II template is shown in Fig 2. We apply this template on large sample of AGNs (302) from SDSS database, and we found that the template fits well Fe II emission. The Fe II template, as well as web application for fitting Fe II lines in AGN spectra with this model, are given at: http://servo.aob.rs/FeII_AGN/, as a part of Serbian Virtual Observatory.
3.2 Influence of starbursts to spectral properties
We performed correlations between Fe II lines and other spectral properties (continuum luminosity, broad and narrow line widths, equivalent widths of lines) for two subsamples, AGN and starburst dominant. We found significant differences in some correlations for these two groups of objects.
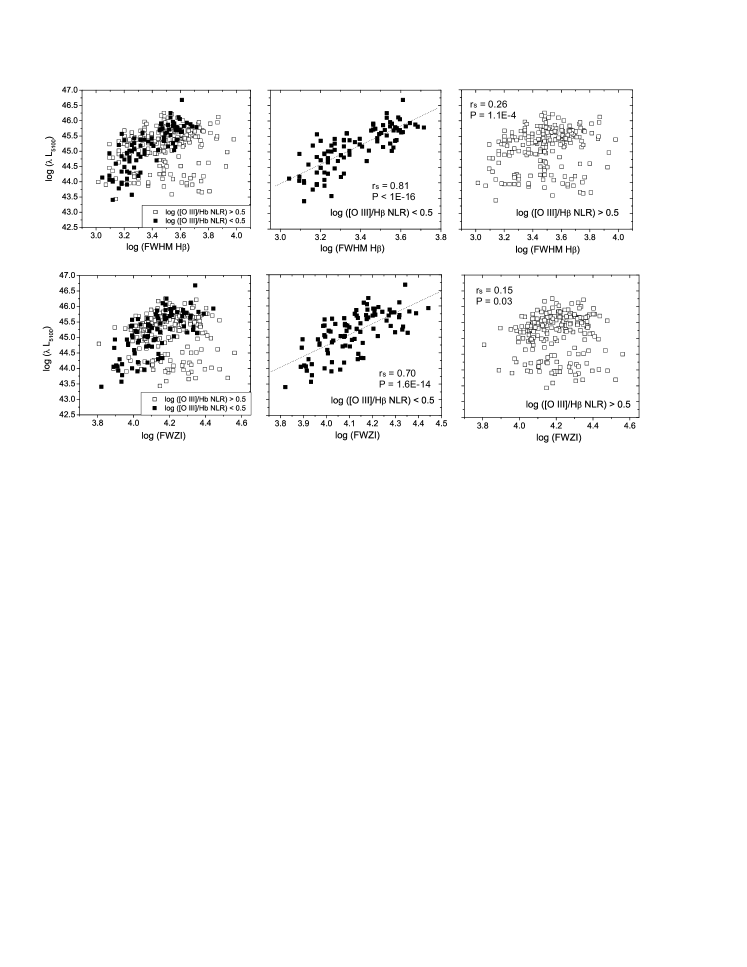
We found that the width of the broad H is in a significant correlation with the continuum luminosity (L5100) for the starburst dominant subsample, while there are no any correlations between these parameters for the AGN dominant subsample (see Fig 3).
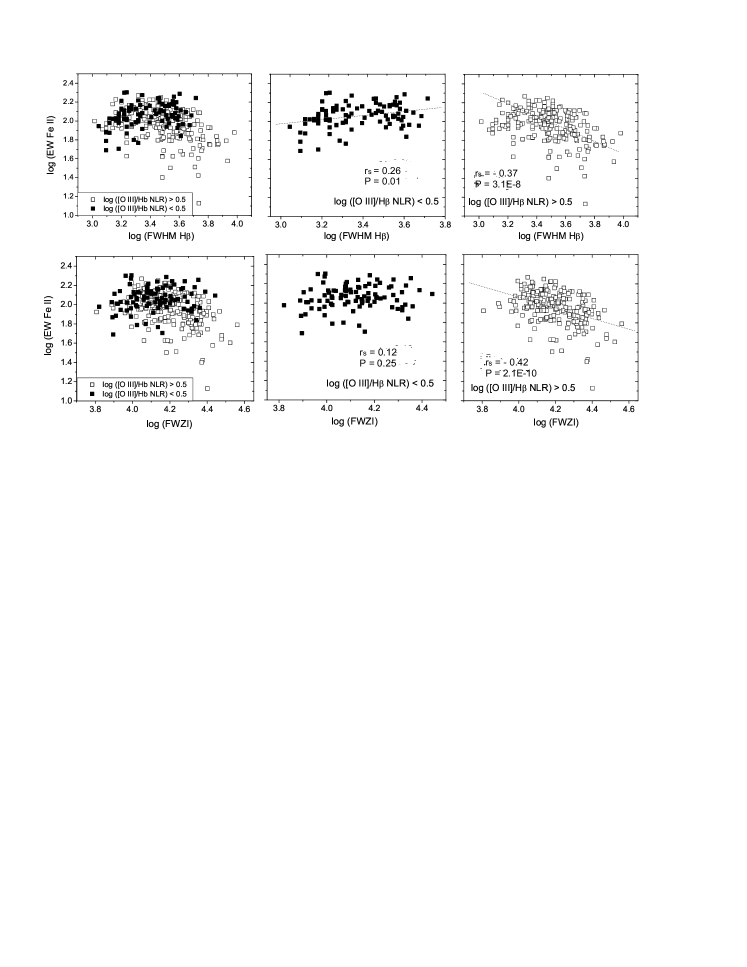
The relation between EW Fe II and FWHM (FWZI) H is also different for the starburst dominant and AGN dominant subsamples (see Fig. 4, Table 1). Namely, the well known anticorrelation EW Fe II and FWHM H, which is part of EV1 correlations from paper Boroson and Green 1992 (BG92), is noticed only for AGN dominant subsample (=-0.37, P=3.1E-8), while starburst dominant subsample shows even opposite, but statistically not significant trend (=0.26, P=0.01). Note here that Grupe (2004) also found positive correlation between EW Fe II and FWHM H for NLSy1 objects, and the negative correlation for BLSy1s. It is the same case for EW [O III] vs. EW Fe II anticorrelation, which is also part of BG92 EV1 correlations. Namely it is stronger in AGN dominant subsample (=-0.38, P=8E-9) than in starburst dominant (=-0.27, P=0.01). Fe II lines show significant inverse Baldwin effect (see Baldwin 1977) in the AGN dominant subsample (= 0.29, P=2.4E-5), while in other subsample (=0.26, P=0.01) there is no correlation.
As it can be seen in Table 1, there are weak correlations between EW Fe II and the EW of some narrow lines (NLR H and [O III]) only for AGN subsample. Contrary, the correlation between EW Fe II and EW broad H is present only for starburst subsample (=0.49, P=9.4E-7), while for AGN subsample, no correlation is found (=0.04, P=0.57).
In principle, the Fe II emission is sligthly stronger (in average) in starburst dominant subsample than in AGN dominant. Average EW Fe II for AGN dominant subsample is: 97 Å, and for starburst dominant: 119 Å).
| log() | log(FWHM H) | log(EW [O III]) | log(EW H NLR) | log(EW H broad) | log(FWMI10%H) | |||||||||
|---|---|---|---|---|---|---|---|---|---|---|---|---|---|---|
| r | P | r | P | r | P | r | P | r | P | r | P | |||
| all | 0.27 | 1.6E-6 | -0.24 | 2.3E-5 | -0.41 | 6.8E-14 | -0.01 | 0.80 | 0.07 | 0.23 | -0.26 | 6.3E-6 | ||
| log(EW Fe II) | (1) | 0.29 | 2.4E-5 | -0.37 | 3.2E-8 | -0.38 | 7.9E-9 | -0.28 | 3.9E-5 | 0.04 | 0.57 | -0.38 | 1.4E-8 | |
| (2) | 0.26 | 0.01 | 0.26 | 0.01 | -0.27 | 0.01 | -0.04 | 0.67 | 0.49 | 9.4E-7 | 0.27 | 0.01 | ||
4 Conclusions
In this paper we performed correlations between Fe II lines and other spectral properties in the sample of 302 type 1 AGNs. We devided the sample in two subsamples, AGN dominant and starburst dominant, in order to analyze how the presence/absence of the starburst contribution to the AGN spectra influences to the correlations between Fe II and spectral properties.
We found significant difference between all analyzed correlations for different subsamples, which reflex different physics and geometry of emission region caused by presence/absence of the starbursts. However, there is no big difference in Fe II emission, except that Fe II in starburst dominant subsample tends to be stronger. The most interesting correlation is between FWHM and luminosity in the subsample of type 1 AGNs where the ratio of narrow lines indicates presence of the star-froming regions. This may be explained by two possibilities: 1) a non conventional BLR or 2) that AGNs for this subsample are accreating with the similar rate. More detailed discussion can be found in Popović & Kovačević (2011).
References
- [1] Baldwin, J. A. 1977, ApJ, 214, 679.
- [2] Baldwin, J. A., Philips, M. M. & Terlevich, R. J., 1999, PASP, 93, 5.
- [3] Boroson, T.A. & Green, R.F. 1992, ApJS, 80, 109.
- [4] Bruhweiler, F. & Verner, E. 2008, ApJ, 675, 83.
- [5] Grupe D. 2004, AJ, 127, 1799.
- [6] Dong, X., Wang, T., Wang, J., Yuan, W., Zhou, H., Dai, H. and Zhang, K. 2008, MNRAS, 383, 581.
- [7] Hartman, H. & Johansson, S. 2000, A&A, 359, 627.
- [8] Kovačević, J., Popović, L. Č., Dimitrijević, M.S. 2010, ApJS, 189, 15.
- [9] Lipari, S.L. & Terlevich, R.J. 2006, MNRAS, 368, 1001.
- [10] Mao, Y-F. Wang, J., Wei, J.-Y. 2009, Res. A&A, 9, 529.
- [11] Popović & Kovačević, 2011, ApJ, 738, 68.
- [12] Popović, L.Č., Smirnova, A., Kovačević, J., Moiseev, A. & Afanasiev, V. 2009, AJ, 137, 3548.
- [13] Sani, E., Lutz, D., Risaliti, G., Netzer, H., Gallo, L. C., Trakhtenbrot, B., Sturm, E., Boller, T. 2010, MNRAS, 403, 1246.
- [14] Shapovalova, A. I., Popović, L. Č., Burenkov, A. N., Chavushyan, V. H., Ilić, D., Kovačević, A., Kollatschny, W. et al., 2012, ApJS, 202, 10.
- [15] Veron-Cetty, M.-P., Joly, M., Veron, P. 2004, A&A, 417, 515.
- [16] Verner, E.M., Verner, D.A., Korista, K.T., Ferguson, J.W., Hamann, F. and Ferland, G.J. 1999, ApJS, 120, 101.
- [17] Wang, J., Wei, J. 2006, ApJ, 648, 158.
- [18] Wang, J., Wei, J. 2008, ApJ, 679, 86.