Helioseismology with PICARD
Abstract
PICARD is a CNES micro-satellite launched in June 2010 [17]. Its main goal is to measure the solar shape, total and spectral irradiance during the ascending phase of the activity cycle. The SODISM telescope onboard PICARD also allows us to conduct a program for helioseismology in intensity at 535.7 nm [5]. One-minute cadence low-resolution full images are available for a so-called medium- program, and high-resolution images of the limb recorded every 2 minutes are used to study mode amplification near the limb in the perspective of g-mode search. First analyses and results from these two programs are presented here.
1 Medium- program in intensity
Full continuum images at 535.7 nm (bandwidth 0.5 nm) are recorded by SODISM [8] every minute with a spatial resolution of about 1 square arcsecond on a CCD. For telemetry reasons, these images are downgraded to pixels (about 8x8 arcsecond) by a simple onboard binning before being transmitted to ground. We have analyzed a dataset covering 209 consecutive days (2011/04/16-2011/11/10 ) with a duty cycle of . The gaps are mostly due to interruptions for the other PICARD program (astrometric measurements at different wavelengths) and to the crossing of the South Atlantic Anomaly, which is the location of transient signals generated by trapped protons exposing low-altitude, Sun-synchronous orbiting satellites, like PICARD, to strong radiations.
Figure 2 (top) shows the - diagram obtained from this 209-day dataset for angular degree up to =300. As expected from the instrumental resolution, a spatial aliasing for spherical harmonics above =200 is present. We can also see a temporal aliasing for frequencies above 4.5 mHz. This is the signature of a spurious cycle in the 2-min sampling slots corresponding to the astrometric program sequences. Figure 2 (bottom) illustrates a - diagram for =90 clearly showing the S-shape signature of the differential rotation. Figure 2 shows the mode parameters modelled using the asymmetrical line profile formula of Nigam and Kosovichev [10] and fitted using a Maximum Likelihood Estimator minimization [1, 7]. For a given mode (,), the 2+1 -components of the multiplets are fitted simultaneously using an expansion on orthogonal polynomials [12] with up to 9 so-called a-coefficients. The and mode leakages are included in the fitting process. Positive peak asymmetries are obtained as expected from previous analyses of intensity signal. The splitting coefficients plotted as a function of the mode turning point proxy , where , exhibit a gradient which is a typical signature of the solar tachocline. Improvements of the peak-fitting process are currently underway. We need for instance to better model all the components of the leakage matrix in order to fit higher angular degrees.
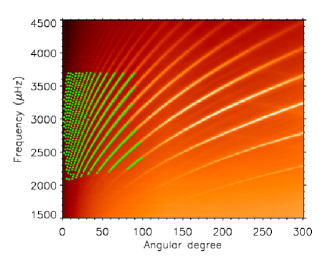
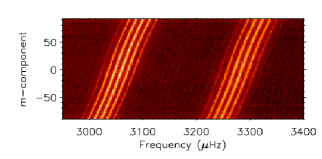
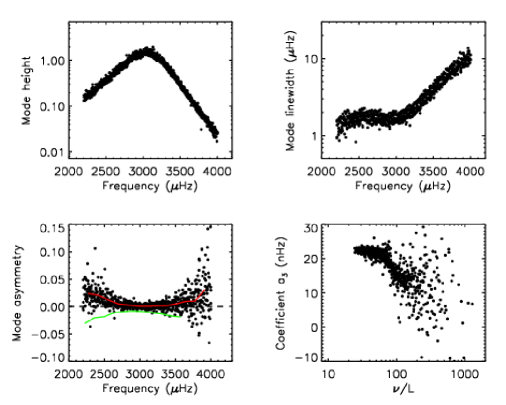
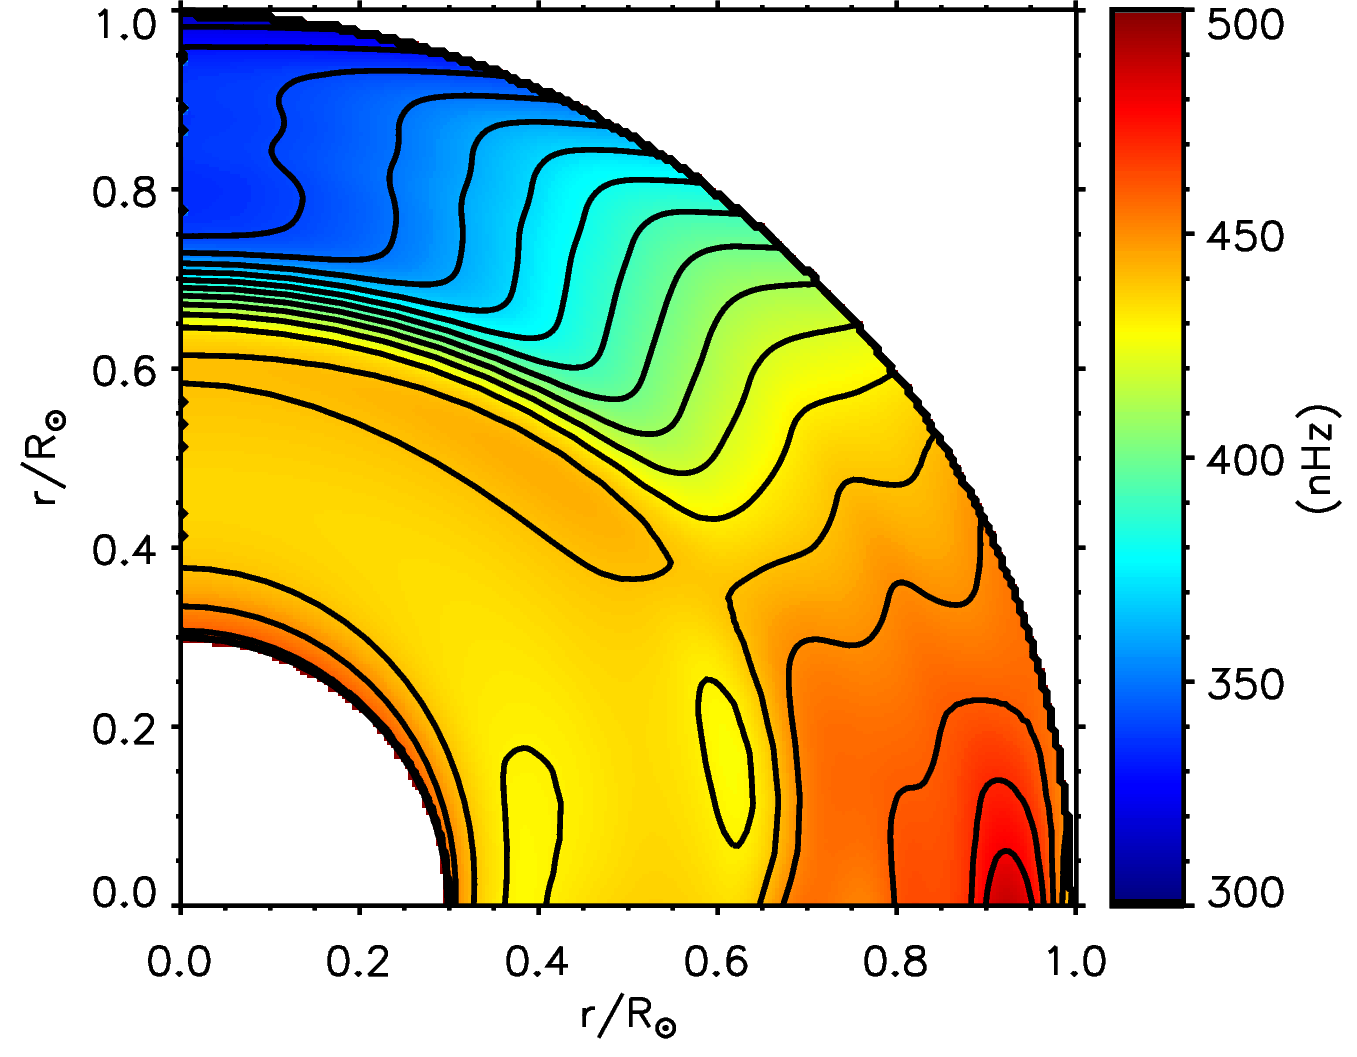
Figure 3 shows a Regularized Least-Square (RLS) inversion [6] of the measured rotational splittings of 769 modes from =1 to =99. The steep gradient of the tachocline at the base of the convection zone around 0.7 is clearly seen. The inferred rotation rate is similar to the one previously obtained from velocity data [6, 11]: a radial gradient is obtained close to the surface followed by a latitudinal differential rotation persisting through the whole convection zone. The radiative interior is roughly rigid at a rate of nHz which corresponds to the surface rate for latitudes between and degrees. Finally, we note that a local maxima is found close to the equator near . These preliminary results are very encouraging. We are currently working in order to extend the peak-fitting analysis towards higher and to increase the number of fitted -coefficients thus improving the resolution of our inversion. The reversal of peak asymmetry observed between velocity and intensity power spectra is linked to the effect of a background component correlated to the modes [9]. The complete two years of PICARD observations available to date should then be used to confront the details of internal rotation studies obtained using simultaneous velocity and intensity data from SDO/HMI or GONG. By fitting intensity, velocity, their phase difference and coherence signals simultaneously, we hope to nail down systematics in either observables and better understand the correlated background noise [14, 4]. This will help to better interpret the fitted frequencies and frequency splittings in terms of internal structure and dynamics.
2 Limb seismology
Every 2 minutes, the full resolution of PICARD/SODISM images are kept in an annulus of 22 pixels around the solar limb (increased to 31 pixels since April 2012). In April 2011 and April 2012, 3 consecutive days were dedicated to helioseismic measurements at 535.7 nm without interruption for the other PICARD objectives. These datasets with a duty cycle above 95 have been used in order to study the expected mode amplification at the extreme limb [2, 16, 15]. Intensity data from SOHO/MDI and SDO/HMI were also used for comparison.
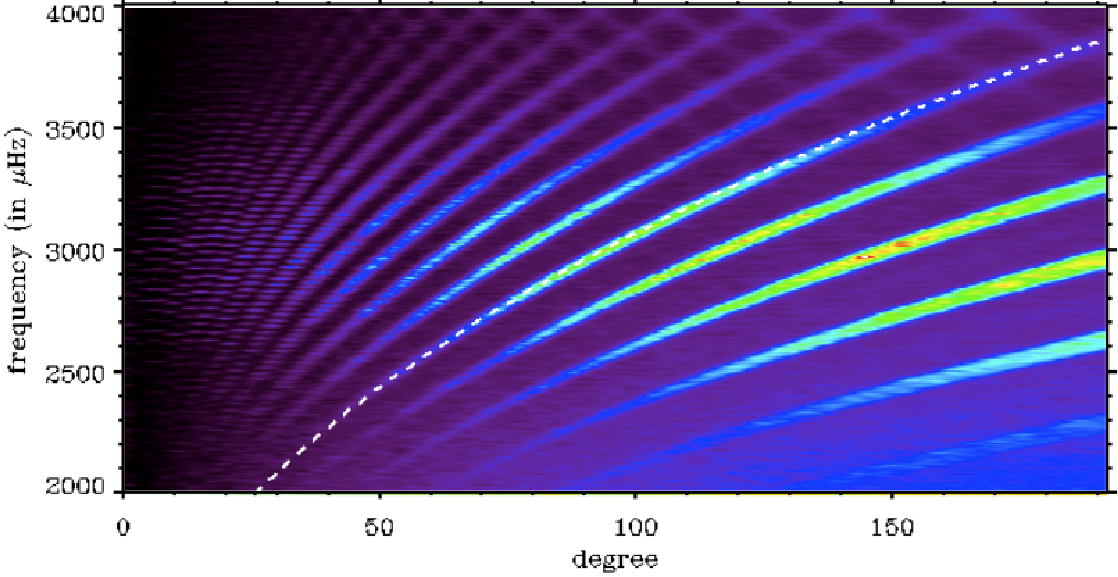
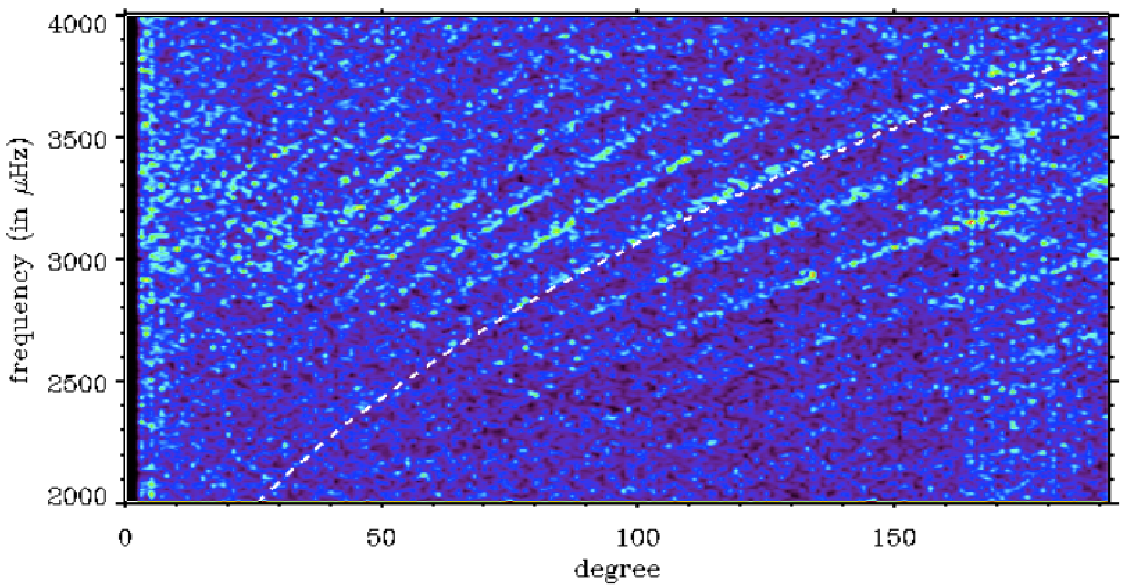
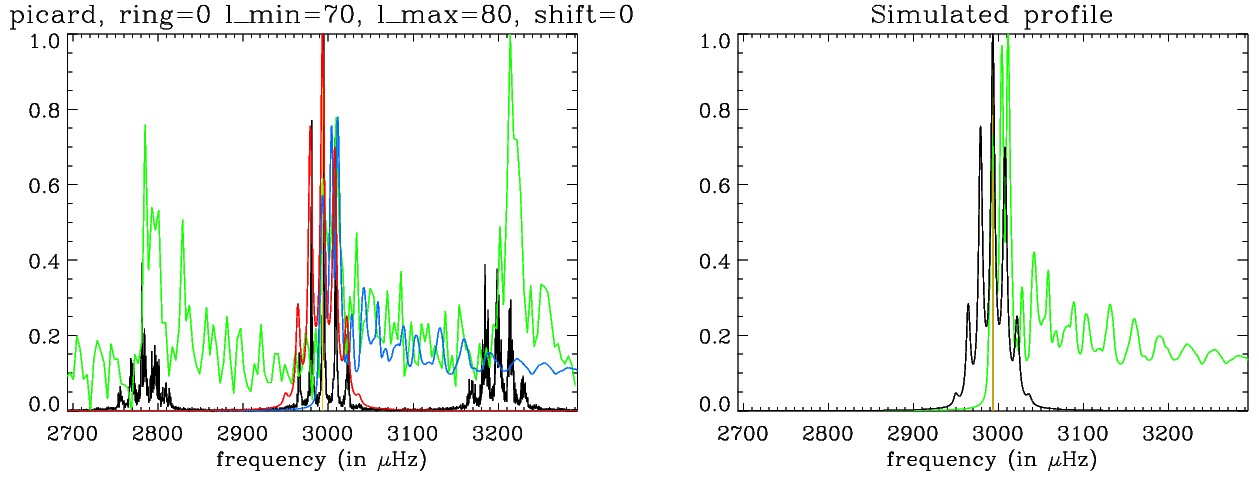
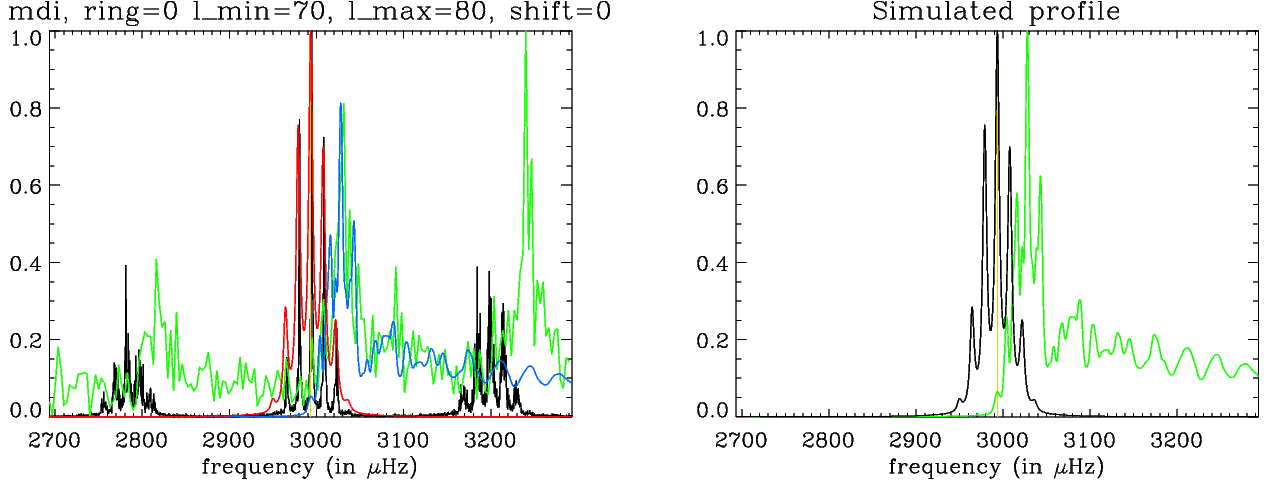
In order to analyse the limb signal, we calculated the Fourier transform along the limb using the polar coordinates, where =1 at the disk center and =0 at the limb. Figure 4 shows the comparison between the - diagram obtained from a classical spherical harmonic transform of full images (left) and the - diagram (right) resulting from the limb transform as described above. A frequency shift between ridges of the same radial order is clearly seen. We carried out simulations in order to understand this shift and the link between the two diagrams [3]. For a given , it can be shown that the limb response are non zero for value of higher than . Since the mode frequencies increase with the degree, the leaks will appear at higher frequencies than the original anticipated frequency. The leaks will then appear as an asymmetry at higher frequency with a decreasing amplitude when increases. This is indeed what is shown in Figure 5, where the observed ridge profiles obtained from PICARD/SODISM and SOHO/MDI intensity data are compared to the simulated profiles. From these simulations, we are able to understand:
-
•
why the peak in the - diagram is shifted with (the shift with the original - ridge increases as increases);
-
•
why the peak gets closer to the original ridge as we get closer to the limb;
-
•
why the - ridge leaks towards higher frequencies.
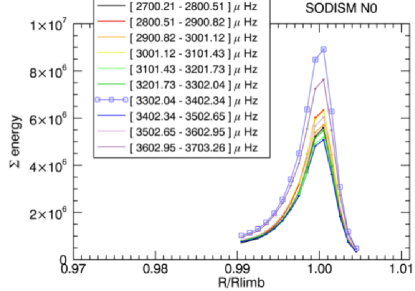
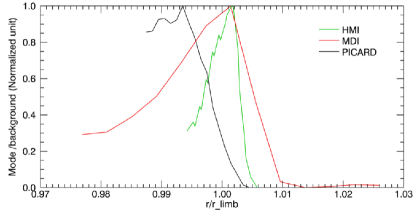
Figure 6 (left) shows that the energy in the p-mode range peaks at the extreme limb, as was already seen using MDI intensity images [15] or the guiding pixels of SOHO/LOI [2]. If we normalize this by a proxy of the noise level obtained by integrating the energy in the low-frequency band (right panel), we can see that we effectively have an amplification of the signal-to-noise ratio at the extreme limb for the three instruments. This peak is however slightly shifted inward for SODISM. This may be an instrumental effect but this needs further investigations.
3 Conclusions
The first helioseismic analyses of SODISM full-continuum images have been carried out for both the medium- and limb programs. We fitted mode parameters for a wide range of eigenmodes. The fitted peak asymmetries and frequency splittings are consistent with what is known from previous studies. We performed a first inversion of the rotational splittings and infered the internal rotation rate down to the radiative zone. The steep gradient of the tachocline is clearly seen at the base of the convection zone. The signature of p-modes can also be observed in limb data and a signal amplification was detected at the extreme limb. By computing the response of any mode to the limb transform, we explain most of the features of the power spectra observed at the limb when compared to spectra built using full images. However, we have to face strong instrumental and orbital effects that affect both the photometric signal and the geometry of the solar images. We know from the past that our capacity in assessing the reliability of the details of many features analyzed using helioseismology (tachocline shape, polar jet, meridional flows, surface effects for structure inversions, etc. see e.g. [13]) greatly benefit from the cross-analysis made using different instruments (e.g. GONG and SOHO/MDI). We are therefore still working on improving our calibration procedure and we hope that PICARD will be extended at least one year in order to gather more intensity data that can be compared and cross-calibrated with SDO/HMI intensity and velocity images.
The data were provided by the PICARD/SODISM, SOHO/MDI, and SDO/HMI instrument teams. PICARD is a mission supported by the Centre National d’Etudes Spatiales (CNES), the CNRS/INSU, the Belgian Space Policy (BELSPO), the Swiss Space Office (SSO) and the European Space Agency (ESA). SOHO is a project of international cooperation between ESA and NASA. D. Salabert and P. Journoud acknowledge financial support from CNES. The authors wish to thank S. J. Jiménez-Reyes for useful discussions and for providing his codes at the early stage of the project.
References
References
- [1] Appourchaux A, Gizon L and Rabello-Soares C 1998a A&AS 132 107
- [2] Appourchaux A and Toutain T 1998b IAU Symposium 181 (Poster volume) Ed J Provost and F X Schmider (Nice: Nice University) p 5
- [3] Appourchaux A and Nunge A 2012 Internal IAS report
- [4] Barban C, Hill F, Kras S 2004 ApJ 602 516
- [5] Corbard T, Boumier P, Appourchaux T, Jiménez-Reyes S J, Gelly B and the PICARD Team 2008 AN 329 508
- [6] Corbard T, Berthomieu G, Morel P, Provost J, Schou J, Tomczyk S 1997 A&A 324 298
- [7] Jiménez-Reyes S J 2001 PhD Thesis (La Laguna University, Spain)
- [8] Meftah M et al. 2013 Sol. Phys. submitted
- [9] Nigam R, Kosovichev A G , Scherrer P H and Schou J 1998 495 L115
- [10] Nigam R and Kosovichev A G 1998 ApJ 505 L51
- [11] Howe R 2009 Living Rev. Solar Phys. 6 1. URL: http://www.livingreviews.org/lrsp-2009-1
- [12] Schou J PhD Thesis 1992 (Stanford University , USA)
- [13] Schou et al. 2002 ApJ 567 1234
- [14] Severino G, Magrí M, Oliviero M, Strauss T and Jefferies S M 2001 ApJ 561 444
- [15] Toner C, Jefferies S and Toutain T 1999 ApJ 518 L127
- [16] Toutain T, Berthomieu G and Provost P 1999 A&A 344 188
- [17] Thuillier G, Dewitte S, Schmutz W and The PICARD Team 2006 Adv. Space Res. 38 1792