Probing Ultrafast Dynamics with Time-resolved Multi-dimensional
Coincidence Imaging: Butadiene
Abstract
- Status
-
To appear in JMO special issue “Ultrafast Dynamical Imaging of Matter”, summer 2013.
- Version
-
RevTex 4.1 typeset version for arxiv.
Time-resolved coincidence imaging of photoelectrons and photoions represents the most complete experimental measurement of ultrafast excited state dynamics, a multi-dimensional measurement for a multi-dimensional problem. Here we present the experimental data from recent coincidence imaging experiments, undertaken with the aim of gaining insight into the complex ultrafast excited-state dynamics of 1,3-butadiene initiated by absorption of 200 nm light. We discuss photoion and photoelectron mappings of increasing dimensionality, and focus particularly on the time-resolved photoelectron angular distributions (TRPADs), expected to be a sensitive probe of the electronic evolution of the excited state and to provide significant information beyond the time-resolved photoelectron spectrum (TRPES). Complex temporal behaviour is observed in the TRPADs, revealing their sensitivity to the dynamics while also emphasising the difficulty of interpretation of these complex observables. From the experimental data some details of the wavepacket dynamics are discerned relatively directly, and we make some tentative comparisons with existing ab initio calculations in order to gain deeper insight into the experimental measurements; finally, we sketch out some considerations for taking this comparison further in order to bridge the gap between experiment and theory.
I Introduction
Coincidence imaging techniques, in which the full momentum vector of both photoelectron and photoion is measured, have been growing in popularity and sophistication over the last 20 years. The COLTRIMS (Cold Target Recoil Ion Momentum Spectroscopy) community, in particular, has developed significant expertise in relatively high-energy and multi-coincidence measurements Moshammer1994 (1, 2, 3, 4, 5), typically (although not exclusively) utilising synchrotron light sources in photoionization studies. The original aim of COLTRIMS was application to many-body collision dynamics, via kinematically complete measurements of collision systems Dorner2000 (4), although the technique has since been applied to studies as diverse as photoelectron diffraction Landers2001 (6), probing entanglement Akoury2007 (7) and the investigation of tunnel ionization Meckel2008 (8, 9), as well as extensive studies of photoelectron angular distributions Ueda2003 (10, 11). Flat-field and VMI based coincidence imaging experiments have also been used by a handful of groups Davies1999 (12, 13, 14, 15, 16, 17, 18), usually with a focus on lower-energy processes as appropriate to experiments based around table-top laser sources. The first demonstration of femtosecond time-resolved coincidence imaging to study photochemical processes was over a decade ago Davies1999 (12, 19), and this type of imaging measurement provides the fullest experimental dataset possible, which can be considered as a 7D measurement, or even 8D if one considers the fragment mass spectrum as a distinct observable to the fragment velocity distributions; time-resolved coincidence imaging therefore provides the best chance of elucidating complicated, multi-dimensional, excited state dynamics from experimental measurements.
Despite the potential of coincidence imaging, the technique has had only a small impact thus far to time-resolved measurements generally, and more specifically to measurements utilising UV sources Reid2012 (11). The difficulty of applying coincidence imaging in time-resolved, UV pump-probe experiments is partly due to the limitation of single-particle counting techniques - with consequent requirements for long experimental runs and long-term experimental stability - which makes time-resolved experiments particularly challenging; additionally there is the inherent difficulty of producing and controlling short-pulse UV light. A particular issue is the minimisation of background signal from scattered light, which becomes a problem on a per photon basis once photon energies are above the work function of the materials used in the spectrometer Lee2007 (20, 21, 22, 23). The benefit of UV wavelengths is that, for many small molecules, the photon energies are sufficient for 1-photon pump, 1-photon probe experimental schemes, which are ideal for the study of the dynamics of electronically excited states of molecules. In these kind of schemes the laser intensities can be kept low and well within the perturbative regime ( Wcm-2), and the observables take their simplest form. The few successful studies to date Davies1999 (12, 24, 16, 18) have begun to explore the power of the technique, but much work remains to be done.
The observables provided in a full imaging study provide additional information beyond the energy-time mapping of a, now routine, 2D photoelectron or photoion measurement, which provide time-resolved photoelectron spectra (TRPES) or mass spectra (TRMS) respectively. In particular the time-resolved photoelectron angular distributions (TRPADs) are sensitive to the electronic structure of the ionizing state, so are expected to reveal subtle details of the non-adiabatic electronic dynamics Arasaki2000 (25, 26, 27, 28, 29). In the simplest case one might concoct, that of passage through a conical intersection (CI) leading to a change in the electronic symmetry of the excited state, the PAD is expected to change reflecting the non-adiabatic dynamics and map principally the electronic part of the dynamics Suzuki2003 (27, 30). This expectation can be contrasted with the time-resolved photoelectron spectrum, which can be considered to be an observable dominated by vibrational motions Wu2011 (30), but may additionally map some aspects of the non-adiabatic electronic dynamics cleanly depending on the ionization correlations Blanchet1999 (31, 32, 33).
However, in the case of large amplitude motions on a single electronic state (adiabatic dynamics) changes in the PAD are also expected and, furthermore, the PAD is energy dependent, so changes to the vertical ionization potential (IP) as a function of nuclear coordinates will also couple into the form of the observed PAD. These factors make the mapping of the dynamics onto the TRPADs non-trivial to understand at both a qualitative and quantitative level, and obviate the (relatively) simple picture that the TRPADs map only the electronic dynamics for all but the simplest of cases; recent computational studies of excited state dynamics in NO2 Arasaki2010 (29) have illustrated the response of the TRPES and TRPADs to complicated excited-state dynamics, demonstrating the richness of the observable while also suggesting the difficulty of obtaining detailed insights into molecular dynamics via a purely experimental approach, with no a priori knowledge of the underlying dynamics. Of particular note is the non-isomorphic nature of the nuclear configuration and observable mapping spaces: the wavepacket motion on the excited-state, which includes dispersion, bifurcation, interferences and other complex quantum-mechanical behaviours, does not allow for a direct mapping of a given dimension in nuclear coordinate space onto a given dimension of the observable (e.g. photoelectron energy, anisotropy parameter), although such mappings may be possible in low dimensionality problems such as vibrational wavepackets in diatomics Shapiro1999 (34, 25, 35, 36). However unsurprising this conclusion is, the knowledge gap between the observable and the underlying wavepacket dynamics is often overlooked or ignored in treatments of time-resolved measurements.
Despite these difficulties, the TRPADs provide an additional observable - therefore more information - than the TRPES alone, and additional dimensionality to the dataset. One demonstration of the utility of this higher information content has been the interpretation of experimental measurements via qualitative/semi-quantitative modelling of TRPADs, which can provide insight into the mapping of the excited state wavepacket to the observables without the need for full ab initio treatments, and yield deeper insight into the molecular dynamics than the TRPES alone Gessner2006 (16, 37). Many studies based on velocity map imaging (VMI) measurements have also illustrated the utility of TRPADs at a phenomenological level (in no small part because PADs come “for free” with the technique) and a recent review article has surveyed much of the work by such “users” of photoelectron angular distributions Reid2012 (11).
The ultrafast dynamics of 1,3-butadiene () have been studied in considerable detail experimentally and theoretically, most recently by Boguslavskiy et. al. bogusNatChem (38) and Levine et. al. Levine2009 (39) (for a more detailed overview of the butadiene literature to date see ref. Levine2009 (39)). In the experimental photoelectron study, butadiene was excited to the bright state, with UV radiation around 216 nm (5.74 eV), and probed via ionization with a time-delayed UV pulse at 266 nm (4.66 eV). The computational studies, based around an ab initio multiple spawning (AIMS) methodology, focussed on describing the excited state dynamics of population on the same bright state and with similar energy to the experimental case.111In this case neither the experimental pump bandwidth, nor the probe pulse, were included in the simulations. More recently the AIMS methodology has been expanded to explicitly include the probe process, although this has so far only been applied to the photoionization of ethylene with VUV pulses Tao2011 (40). The conclusions from these complementary experimental and theoretical studies are in accord, and point to rapid and complicated dynamics involving fast motion on the initially populated bright state (historically termed the state, as it lies higher in energy in the Franck-Condon region), with twisting about the carbon backbone and out-of-plane bending motions leading to highly distorted geometries (relative to the planar ground state) on 40 fs timescales Levine2009 (39). At least two minimum energy conical intersections (CIs), coupling to (the optically dark state) and three CIs coupling to , were found to play important roles in the relaxation of the excited state. In a wavepacket picture, the initial dynamics from the Franck-Condon region to the first CI would correspond to rapid passage down steep gradients, with little dispersion of the wavepacket along other coordinates. Once on , the topology would cause the wavepacket to split, with parts heading towards each CI, and there would be the possibility of more complex dynamical behaviour. Away from the CIs, the non-adiabatic coupling of the and states is strong over large regions of the nuclear configuration hyperspace, with significant interaction between the states even at the equilibrium geometry - for example, the “dark” state is actually found to carry non-negligible oscillator strength due to non-adiabatic coupling with the bright state Levine2009 (39). The strongly coupled nature of these states and short timescales involved suggests that butadiene can be considered as something of a prototypical, perhaps even limiting or pathological, case for rapid dynamics; as such butadiene is a good exemplar of a system where the information available from frequency resolved measurements is very limited,222For instance ref. Leopold1984 (41) discusses the experimental absorption spectra, and the lack of information obtainable from the very diffuse bands observed (with just three broad features visible over the 44000 - 51000 cm-1 region studied); ref. Krawczyk2000 (42) provides details of ab initio calculations of the optical spectra which require the inclusion of a phenomenological dephasing constant to match the experimental data, again indicating a gap in the understanding of the radiationless relaxation of the excited state. but the speed and complexity of the dynamics make time-resolved measurements technically demanding and difficult to interpret.
Experimental measurements have probed the projection of these dynamics onto the time-resolved ion yields Assenmacher2001 (43, 44) and time-resolved photoelectron spectrum bogusNatChem (38). In the former case fast time-constants, 50 fs, were determined for the decay of the parent ion signal, and delayed onset of fragmentation was also observed Assenmacher2001 (43); in the latter case, as well as a rapid decay of the photoelectron yield, a fast shift in the vertical ionization potential and a photoelectron band with little structure were observed. Recent work, in which the TRPES was measured in coincidence with the mass spectrum bogusNatChem (38), has demonstrated the separation of the photoelectron spectra correlated with the and states due to the ionization correlations with and ion states respectively; the state is stable, yielding parent ion signal only, while the state fragments Werner1975 (45, 46, 47), thus producing a very different mass spectrum. In this way coincidence measurements have been able to help disentangle the TRPES data by providing complementary, correlated observables. The same photofragment coincidence technique has also been applied to strong-field ionization of butadiene in order to probe multi-electron effects Boguslavskiy2012 (48). Measurement of the TRPES and time-resolved mass spectrum (TRMS) in coincidence provides a 3D dataset, with the additional dimension of ion time-of-flight and, depending on the details of the measurement, may also provide information on the kinetic energy release of the fragments. One might hope, therefore, that a full, 7D, coincidence imaging experiment provides a rich enough dataset to discern some specific, possibly mechanistic, details of excited-state dynamics in molecular systems, even in the case of very fast dynamics exemplified by butadiene.
In order to explore some of these issues we present here our recent experimental results, focussing on a presentation of a full dataset to illustrate the richness of the 7D coincidence measurements. Along with the data, we include a brief description of our coincidence imaging apparatus, and a qualitative analysis of the data, with a focus on the TRPADs. In future publications, aspects of our apparatus will be discussed in fuller detail, and a more detailed interpretation of the experimental data and comparison with recent ab initio dynamics calculations will be made.
II Experimental
Time-resolved pump-probe measurements were carried out with sub-40 fs UV pulses, 200 nm (6.20 eV) and 266 nm (4.66 eV). Butadiene (1% in He) was introduced to the interaction region via a 1 kHz pulsed valve (Even-Lavie Even2000 (49), 150 m diameter conical nozzle) with a stagnation pressure of 5 bar. Full 7D coincidence measurements were performed on a coincidence imaging spectrometer (CIS). Details of the apparatus are provided in the following sections.
II.1 Optical set-up
Short pulse infrared light (=800 nm, 35 fs, 1 kHz repetition rate) was generated by a standard titanium-sapphire based regenerative amplifier system, followed by a single pass amplifier stage (Coherent Legend Elite Duo). Approximately 700 of the output was used to pump a 3rd () and 4th () harmonic generation scheme, based on sum-frequency mixing in thin BBO crystals.
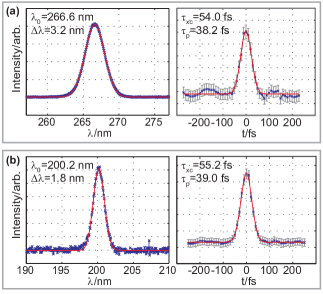
Calcium fluoride prism pairs were used to compress the generated UV pulses, and compensate for the dispersion of transmissive optics in the beam paths (harmonic separation and recombination optics, plate for 3rd harmonic, experimental chamber window, propagation in air). The output pulses were measured directly with an autocorrelator based on 2-photon absorption Homann2011 (50), and the pulse durations in the experimental chamber were additionally confirmed via the cross-correlation feature obtained from fitting the TRPES data. Output pulses on the order of 35 3 fs were measured. Typical autocorrelation traces, along with pulse spectra measured with a UV spectrometer (Ocean Optics Maya Pro) are shown in figure 1.
Control over pump-probe delay was achieved via a high-precision linear motor stage (Newport XML210), for the data reported herein steps of 10 fs were used. The beams were recombined in a collinear geometry, sent through a spatial filter to clean the mode and increase the beam diameters by a factor of 2, and loosely focussed into the interaction region via an = 1 m focussing mirror. Beam diameters of the UV at the focussing mirror were 4 mm at and 2.6 mm at . Focal spot sizes in the interaction region were estimated to be 85 m at and 100 m at . To avoid multi-photon effects, and minimise scattered light signal from the light, relatively low pulse energies of at and at were used, corresponding to peak intensities of 1.9x10¹¹ Wcm-2 and 7x10⁹ Wcm-2 respectively.
II.2 Coincidence imaging spectrometer
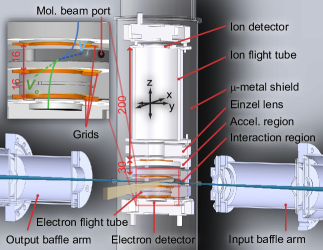
The coincidence imaging spectrometer (CIS) is illustrated in figure 2. An overview is provided in the following, and a more detailed description may be found in ref. Lee2007 (20). The imaging of both electrons and ions is based on a flat-field, Wiley-McLaren type geometry. A flat-field design was chosen to allow for a large turn-around time spread of photoelectrons along the time-of-flight () axis (labelled as the -axis in figure 2), as compared with a VMI type configuration, and also to provide the most direct mapping of data to initial velocity vector, thus allowing for a simple calibration and data backtransformation procedure. To create flat fields, the interaction region is enclosed by grids in the vertical direction; the open apertures in the horizontal plane, required to admit the supersonic molecular beam and laser beams, are removed as far from the interaction centre as possible and minimised in spatial extent in order to avoid aberrations and fringing fields. The bottom grid is biased (typically +10 to +20 V) relative to the top grid (0 V) in order to extract photoelectrons towards the lower flight tube. After the photoelectrons have cleared the interaction region a high voltage pulse (on the order of -0.5 to -0.8 kV, 15 ns rise time, supplied by a HVC-1000 pulser unit from GPTA) is applied to the top grid to eject the photoions to the upper detector. The photoion flight tube also contains an acceleration region, and an Einzel lens assembly (not used in this work), for further control over the ion imaging spectrometer conditions. The pulsed valve (not illustrated) is situated in a source chamber, separated from the CIS chamber by a conical molecular beam skimmer (Beam Dynamics, 1 mm aperture), approximately 45 cm from the interaction region. The molecular beam is further skimmed by an adjustable slit, discussed below. Partly shown in figure 2 are the baffle arms, designed to limit the background photoelectron signal from scattered light, a particularly severe problem from the 200 nm pump pulse. Further details of the scattered light problem and the baffle system employed here will be given in a future publication owenScattLight2012 (23).
Both detectors are comprised of a triple stack of 40 mm diameter MCPs and delay line anodes (Sensor Sciences LLC). Time-of-flight measurement is made via a pick-off from the MCP front face, and position data is obtained from the delay line signals. The ion detector is offset slightly (15 mm) along the molecular beam axis to compensate for the initial translational velocity along this axis. The data read-out and storage is handled by an electronics rack comprising NIM modules on a CAMAC bus backbone, for full specifications see ref. Lee2007 (20), with final output of the processed signals to a PC. The timing-resolution, averaged over the full detector area, is 200 ps, limited by the pulse propagation characteristics over the detector face; the spatial resolution is 80 m for both and axes of the electron detector, and 60 m for the ion detector Lee2007 (20). The PC also controlled other experimental variables such as the pump-probe delay, the shutters installed in the pump and probe beam paths, and dwell times at each delay. Data was measured with dwell times defined by events (as opposed to laser shots), ensuring good Poissonian statistics at all pump-probe time delays even when absolute count rates were low. Pump-only and probe-only signals were measured at each delay for dwell times of less than the pump-probe signal, where was the total number of delays set. Each set of delays defines one experimental cycle, and the final dataset presented here comprises cycles; cycles were kept short (30 minutes of real-time) to minimise the effects of any drifts during the course of a cycle.
Instrument resolution is determined both by the overall mechanical design, optimised for low-energy photoelectrons and photoions (2 eV), the acquisition electronics and the fields applied for a given measurement Lee2007 (20). Adjustment of the extraction fields provides experimental control over resolution via the choice of the energy cut-off (image size), in essence higher extraction fields increase the dynamic range of the image at the cost of energy resolution, while lower extraction fields maximise energy resolution over a reduced dynamic range. This consideration is common to VMI and other imaging techniques Parker1997 (51, 52, 53, 54). In 3D imaging, in common with 1D time-of-flight measurements, the temporal resolution (-axis) is also affected by the choice of extraction fields due to the influence of the fields on the turn-around time-spread of the particles, hence temporal spread at the detector Chichinin2009 (55). Under typical operating conditions, with photoelectrons up to 1 eV extracted with a +13.5 V field, the photoelectron energy resolution was calculated from SIMION simulations to be 1% (10 meV) for the -axis, 10% (100 meV) for the -axis and 3% (30 meV) for the ToF axis Lee2007 (20). Similar figures of 1%, 15% and 1% were calculated for the ion resolution at 0.78 eV with a 200 V extraction field and 600 V acceleration field Lee2007 (20). In practice the -resolution was improved from these design stage simulations by a reduction of the ionization volume along the laser axis, reducing from the 2 mm assumed in the resolution figures provided above. This reduction was achieved by creating a pseudo-1D molecular beam source along the -axis, via the use of a piezo-actuated razor blade slit, mounted after the skimmer which separates the source and spectrometer chambers. In the experiments detailed herein the slit width was set at 400 m, providing a significant improvement on the -axis resolution and allowing for energy slices of 100 meV to be used throughout the photoelectron data analysis over the full 2 eV energy range imaged.
II.3 Data analysis & calibration
For each event - photoelectron and/or photoion detection - a data record is stored, consisting primarily of position and time-of-flight , and anode charges , for the ion and electron. Also stored for each data record are various indices allowing correlation of the event with pump-probe configuration, pump-probe delay, experimental cycle etc. In the current electronics configuration only a single electron and/or ion event is recorded per laser shot, although in principle multi-hit operation of the ion detector is possible and only limited by the dead-time of the detector, as defined by the time taken for pulses to clear the delay lines (15 ns). The maximum count rate for electrons is therefore the limiting factor, and is the same as the repetition rate of the laser (1 kHz), although for operation in a true coincidence regime lower count rates may be required to limit false coincidence events to a reasonable level Stert1999 (56, 20, 57). In the experiments presented here the count rates were kept to 100 Hz for the dominant parent ion channel, which should limit false coincidences to 10% Lee2007 (20). It is interesting, although unsurprising, to note that higher total count rates are permissible in a channel-resolved experiment as compared to a single channel case Stert1999 (56). For example, the majority of background electrons from scattered light appear at early relative to the main signal electrons, so are temporally resolved and do not contribute to false coincidences. A more thorough statistical analysis of the multi-channel case will be presented in another publication jochenStats2012 (57).
The data hypercube obtained experimentally may be filtered along any or all dimensions in order to examine correlations, throw out bad data, retrieve various mappings of the data and so on. For example, charge histograms allow for the determination of a window of good events, defined as single hit events, and the rejection of bad events where two or more hits were registered within the delay line pulse transit period, such bad events have higher than single hit events. Correlation of photoelectrons with photoions of high translational velocity eliminates signal from ionization of background gas (see section III.1); correlation with a given mass provides fragment-resolved data, and so forth.
Calibration and backtransformation of the data is performed via a three-step process: (1) the image centre is defined, either by manual inspection, or taken as the peak in the histograms; (2) the position bins are converted to mm positions from the image centre, based on a (static) look-up table calibration, and converted to velocities by making use of the measured time-of-flight; (3) a look-up table, based on numerical trajectory calculations which account for the voltages applied, is computed and applied to convert the data to . Because of the flat-field arrangement the trajectory calculations are straightforward and not computationally demanding.
Once converted to velocity space, energy and angular data can readily be extracted from the dataset. Obtaining these integrated observables is again just a case of creating histograms of the various quantities of interest, combined with filtering as described above, to provide maps of observables for given regions of the data hypercube. The histogram of events with energy () versus time delay () provides the 2D map () - the TRPES - with bins of width and . Conversion of the data to spherical polar coordinates allows binning into volume elements for each delay , to create 3D maps of the energy and angular distributions of events. Although the full, quasi-continuous, 3D distribution may be visualised as a set of isosurfaces or projection planes from these maps, the data is perhaps represented most tractably as a series of TRPADs at selected energy and time slices, with angular distribution . For cylindrically symmetric distributions, further integration over can also be performed leading to a reduced form . Low event number datasets also benefit from this integration because without integration or smoothing the 3D maps may be too sparse or noisy for further analysis.
The extracted angular distributions can also be described phenomenologically by parameters,
| (1) |
where ) are spherical harmonics of rank and order . This distribution is general to any scattering system yang1948 (58) but the expansion is constrained, by the symmetry of the experiment, to only certain values of Reid2003 (59); in the case of the pump-probe experiment considered here, with total absorption of two photons, linearly polarised light and pump and probe polarisation vectors parallel, the final angular distributions contain terms and are cylindrically symmetric (=0) with symmetry axis defined by the laser polarisation. For the photoelectrons, the contain details of the ionization dynamics, and are complex functions of molecular geometry and photoelectron energy Seideman2002 (26, 59, 28). For the photoions, the contain details of the fragmentation dynamics (although the expansion is not usually written in this exact form, see for example refs. Dixon1986 (60, 61, 62, 63, 64)).
III Results & discussion
In this section we present a complete dataset of photoelectron and photoion measurements. An overview of the data is first given, providing time-integrated 3D visualizations of the full datasets. Low dimensionality (TRPES, TRMS) and high dimensionality (TRPADs, correlated data) maps extracted from the data are then presented, followed by a brief discussion of the results in the context of gaining insight into the underlying molecular dynamics.
III.1 Overview - visualizing multi-dimensional measurements
The most direct way to begin considering the data is via 3D maps of the electron and ion signals. Here we present only the time-integrated data in this form, although visualization of time-sliced data as 3D maps is also a useful technique for qualitative analysis. The 3D maps provide direct information on the performance of the instrument, a quick check for artefacts, some information on the shape of the data in terms of complexity, ion fragment yields, energy spectra and so on; they represent a framework within which to begin a more detailed analysis of the data.333Figures 3 & 4 are interactive in some versions of this manuscript. Interactive versions, and source data, are also available at http://dx.doi.org/10.6084/m9.figshare.106343.
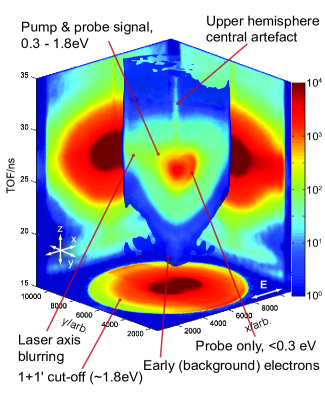
The overall 3D photoelectron distribution obtained (integrated over ) is shown in figure 3. A few of the major features in the dataset are labelled. Of particular note is the signal along the laser axis leading to blurring in this direction. Although the interaction region along the laser axis is minimized by use of a pseudo 1D molecular beam, as discussed in section II.2, ionization of background gas along the laser axis cannot be prevented. However, in a coincidence measurement this background signal can be removed at the analysis stage by filtering the electron data for coincidences with parent ions in the central ion spot (see figure 4 for the corresponding ion distribution). A slight up-down asymmetry is visible in the images; the photoelectrons in the upper hemisphere are those which initially have trajectories away from the detector, and therefore spend longer in the interaction region as they must be turned-around by the extraction fields. The asymmetry is therefore ascribed to a combination of possible effects: slight inhomogeneities in the extraction fields, especially near the grids, and perturbation by weak external fields. Such effects could perturb the photoelectrons, and would become more significant for longer interaction time-scales. A central artefact is present around and to long s, the source of this artefact is unknown, but such structure could arise from the creation of metastable autoioinzing states with ns lifetimes (e.g. high-lying Rydberg states Chupka1993 (65, 66)). The strong probe-only signal, which appears in a narrow energy band eV, is clearly visible near the centre of the distribution and peaked along the laser polarisation axis. For eV all electrons are from the pump-probe signal and, due to the rapid dynamics resulting in a rapid shift of the IP (see figure 6), appear quite diffuse in the 3D representation with no obvious angular dependence in the integrated data.
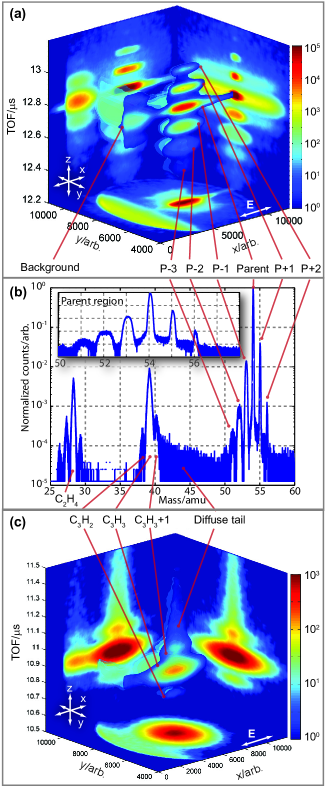
Figure 4 gives an overview of the complete ion data obtained (again integrated over all delays ), showing the full 3D map and projections onto 2D planes for (a) the parent ion mass region around 54 a.m.u. and (c) the fragment region around 39 a.m.u. The central panel (b) shows the calibrated mass spectrum obtained by integrating over , excluding the background gas signal (). The 3D ion map provides much more direct information than the equivalent mapping of the electron data, and from the figure various key features are immediately visible: (1) the main parent ion feature, localised in and intense; (2) satellite features to the parent ion, assigned as isotopes to higher mass (parent+1 and parent+2) and hydrogen loss channels to lower mass (parent-1, parent-2 and parent-3); (3) weak fragment channels appearing at shorter , assigned as fragmentation of the parent ion; (4) a stripe of signal to the edge of the detector, arising from ionization of background gas, i.e. molecules not entrained in the molecular beam which have zero net translational velocity, so appear along the laser propagation axis. The benefits of sensitivity to the mass spectrum are immediately obvious: the background signal is easily gated out of the analysis. Mass resolution of a.m.u. is readily obtained under these experimental conditions (ion extraction pulse of 550 V, acceleration voltage of 150 V, mass range 0 - 230 a.m.u.), and butadiene isotope features are cleanly resolved in the mass spectrum.
Figure 4(a), and the inset to 4(b), shows an expanded view of the parent ion and nearby features. Underlying the main feature, and centred on it, is a diffuse signal with the same . This feature is approximately 3 orders of magnitude weaker than the main feature. This diffuse feature is assigned to a combination of (1) parent ions which fragment after extraction from the ionization region (i.e. within the flight tube) and (2) parent ion formed from dissociation of clusters within the ionization region. In both cases there would be a kinetic energy release relative to the direct parent ion signal, which would lead to the broadened, isotropic feature observed. The dimer peak at 108 a.m.u. was also observed (not shown in figure 4(b), normalized intensity 2x10⁻⁴), and dimer-1 and dimer+1 features were also just visible (normalized intensities 5x10⁻⁵), confirming the presence of dimers in the molecular beam. In the work discussed herein no attempt was made to investigate the diffuse feature further by, for instance, varying the gas mixture or pulsed valve timing. The diffuse nature of this feature, relative to the main parent-ion feature, means that most of these ions can be gated out of the analysis, while those that remain under the main feature hardly contribute to the total signal.
Further weak, somewhat diffuse and isotropic features are observed at earlier than the parent ion. These features are assigned to hydrogen loss channels, resulting in the species , and . These channels are 2 - 4 orders of magnitude weaker than the main parent ion signal. They show some kinetic energy release, resulting in their diffuse appearance in the imaging data and a broadening of the peaks in the integrated data, and this broadening in the clearly increases with the number of -atoms lost (see inset of figure 4(b)) . The isotropic nature of these distributions indicates the slow release of the fragment, relative to the timescale of molecular rotations (10s of picoseconds), as would be anticipated from the complex dissociation dynamics.
Figure 4(c) shows the imaging data for the fragment region around 39 a.m.u. The main feature is assigned to the methyl loss channel, resulting in a fragment. The higher mass fragment is assigned to the same channel for the +1 isotope, based on the intensity ratio, but could also contain contributions from ; the lower mass channel is assigned to . As with the hydrogen loss features, these channels show isotropic angular distributions, but with a larger spread of kinetic energy release. At longer s a diffuse tail is observed. The length of the tail - stretching to the parent ion feature - indicates a relatively long lifetime for the fragmenting complex, because fragmentation must occur in all regions of the spectrometer to result in the large smearing out of the fragment mass spectrum observed. Therefore the upper limit for the timescale of fragmentation is the time taken for ion extraction from the interaction and acceleration region of the spectrometer, hence ns to s timescales. Conversely, ions which appear at the fragment must fragment before extraction, so cannot take longer than a few ns to fragment. The large range in timescales here suggests that multiple fragmentation pathways may play a role.
Also shown in the mass spectrum, figure 4(b), is another fragment region centred at 28 a.m.u. This is assigned as ethylene cation, . The satellite peaks, following the same pattern as the methyl loss region, are assigned to the +1 isotope at 29 a.m.u., and further hydrogen loss resulting in and . This region has no diffuse tail, indicating more rapid fragmentation than for the methyl loss channels. No lower masses were observed in the mass spectrum (down to the mass cut-off at 3 a.m.u.), indicating that all lower mass fragments were produced as neutrals.
At this level of representation, a few key aspects of the dynamics can be discerned: the electron data appears relatively structureless, hence spectrally broad and possibly varying rapidly as a function of ; the ion data shows several fragmentation products, and some limits to the timescales of fragmentation for different channels can be intuited; the fragment angular distributions appear near isotropic, although quantitative analysis is required to make this conclusion definitive.
III.2 Low-dimensionality mappings: time-resolved mass spectrum and photoelectron spectrum
The next stage in analysis complexity is low-dimensionality mappings: here we consider 2D mappings of the dynamics. First, the time-resolved mass spectrum, the mapping of product yields vs. time for each mass channel; second, the time-resolved photoelectron spectrum, the mapping of electron yield vs. time for each kinetic energy channel.
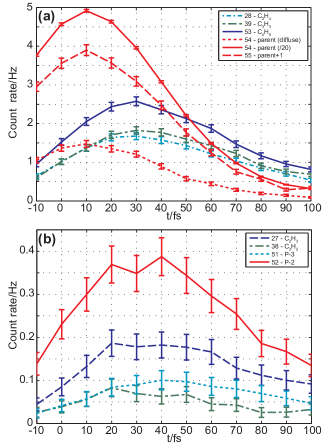
Figure 5 shows the time-dependence of a selection of the mass channels. To obtain this representation, the data was integrated over the coordinates for each of the features of interest at each pump-probe delay , and was converted from raw counts to count rates to allow for the correct weighting of the pump only and probe only signals, which could then be subtracted from the full pump-probe signal.
The parent ion signal is observed to rise with the cross-correlation, plateau and then fall with a Gaussian tail. The diffuse part of the parent ion signal shows a very similar response, as do the isotope peaks. The major hydrogen loss channel, , rises at later , and peaks around 20 fs after the parent ion. The minor hydrogen loss channels, the parent-2 and parent-3 features shown in figure 5(b), both peak at around 30 fs after the parent ion. Therefore, the data indicates that evolution on the excited state of around 20 - 30 fs is required before these fragmentation channels are open. Similarly, the fragment channels assigned to and show peaks around 20 fs after the parent ion. In all cases the peak shapes are similar, with non-Gaussian tails. Assuming that fragmentation only occurs on the surface, the timescales here indicate that direct ionization to is possible very rapidly, and indicates a significant lowering of the vertical IP from the Franck-Condon region. At the ground state equilibrium geometry and lie at 9.07 eV and 11.39 eV respectively White1974 (67), so are separated by 2.3 eV, with lying 0.53 eV above the available 1+1′ photon energy of 10.86 eV. Hence the observed dynamics suggest that the vertical IP to falls by 0.5 eV in 20 fs, and this inferred drop is very similar to the shift observed in the photoelectron signal, discussed below. Another possibility is that the cross-section for absorption of a second probe photon increases dramatically over the first 20 fs of the dynamics. Such 1+2′ processes would provide 15.52 eV of energy, allowing population of several higher-lying cationic states Dannacher1980 (46), either via direct 2-photon absorption, or sequential absorption via .
The low laser fluences used experimentally suggest that all observed signals arise from 1+1′ pump-probe processes, conversely the known appearance energies of the fragments (11.3 eV Dannacher1980 (46, 47)) suggest 1+2′ processes, may be energetically required for fragmentation to occur.444Experimentally these studies could only probe the ground state minimum geometry, so do not rule out the appearance of fragments at lower energies as a function of nuclear coordinates, which would only be limited by the asymptotic energy of the fragments. However, the energetics of the dissociation pathways, including transition states and final products, were also considered computationally in ref. Fang2011 (47), and the theoretical results also indicate that the observed fragments are not energetically accessible via 1+1′ processes. In order to check more carefully for 1+2′ processes the time-resolved ion yields were also extracted in coincidence with photoelectrons of energy 0 - 1.8 eV. This produced essentially the same traces as shown in figure 5, except slightly noisier. This does not completely rule out 1+2′ processes, which could also produce photoelectrons in this energy region by population of cation states with internal energies of 13.72 eV, or via the sequential process of ionization and subsequent excitation of the cation. A careful probe power study would be required to firmly answer this question experimentally, but this remains for future work.
In summary, the fragment yields peak around 20 - 30 fs after the parent ion, indicating rapid dynamics lead to the opening of the observed fragmentation channels. Additional filtering of the data for coincidences with electrons in the 1-photon ionization region suggested, but cannot rigorously confirm, that there is no significant 2-photon ionization contribution. In a future publication, an extended analysis of the time-resolved ion data will be made in order to examine the kinetic energy release spectra of each fragment. Combined with the available fragment energetics data this information may be sufficient to accurately determine mechanistic details of the various dissociation pathways.
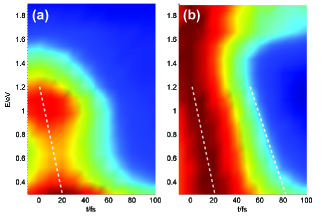
We next consider the mapping of the electron data, the TRPES, shown in figure 6. The TRPES shows an energetically broad photoelectron band up to the 1-photon cut-off at 1.8 eV. The low-energy cut-off at 0.3 eV corresponds to the region of probe-only signal. The main feature at 1.2 eV follows the cross-correlation of the pump and probe pulses (60 fs FWHM); outside of the cross-correlation region the signal rapidly moves to lower energies, with a broad stripe visible in the data. This stripe is slightly sloped or chirped (this is especially clear in the energy normalized representation in figure 6(b)), with the onset time varying as a function of energy. The chirp appears close to linear over the observed energy region, with a gradient of 2010 fs/eV. The temporal width of the band increases slightly as a function of energy (shown by the second dashed line in figure 6(b)), and the trailing edge of the band follows a gradient of approximately 3010 fs/eV, although there is increased, non-linear, broadening below 0.4 eV. For the linear region the broadening of the band is therefore 10 fs/eV; a higher temporal resolution measurement - smaller - would provide a more accurate figure. Apart from the slope of the band there is little structure observed, and most of the population rapidly leaves the observation window of the measurement (on the order of , 60 fs). This data is very similar to previous TRPES studies bogusNatChem (38), but with shorter and obtained for only a small set of delays in order to ensure good statistics for the TRPADs. Although the clipping of the data along the temporal coordinate makes rigorous determination of the lineshapes impossible for the peak of the signal in this dataset, based on the previous TRPES data the temporal profile of the signal is assumed to be approximately Gaussian for most, if not all, energies (see also the line-outs in figure 8), with a small (few percent of the total counts) non-Gaussian tail outside of .
In terms of the dynamics, the delayed onset as a function of energy is phenomenologically consistent with the picture of fast wavepacket propagation on a steep potential energy surface. Such motion would map primarily to the vertical IP (assuming that the excited state and ionic ground state potential energy surfaces are not topologically identical), hence the kinetic energy of the observed photoelectrons. The TRPES provides information on the speed of the IP change, and is consistent with the appearance of fragmentation channels with a delayed onset which require a significant drop in the vertical IP to relative to the Franck-Condon region. Conversely, wavepacket dynamics which cause little change to the IP would be responsible for signal observed in a given energy region at long delays, arising from population which remains within the observation window of the measurement (although such population may still trace complex trajectories in energy space). Since the signal in all regions outside of the cross-correlation time-scale is small, it is clear that wavepacket motion along these coordinates is a very minor contribution to the dynamics. The data also shows that the observed signal stays near Gaussian for all energy slices, again indicating that there is little dispersion of the wavepacket.
In broad terms, the ion and electron 2D data give some insight into the wavepacket dynamics, with the general characteristics apparent and some clocking of this motion possible. The observed energetic shift in the photoelectron signal is consistent with the vertical IP drop required to access , hence observe fragmentation, as already inferred from the ion data. In order to assemble a more detailed picture we next consider the additional information available from the TRPADs.
III.3 High-dimensionality mappings: time-resolved photoelectron angular distributions
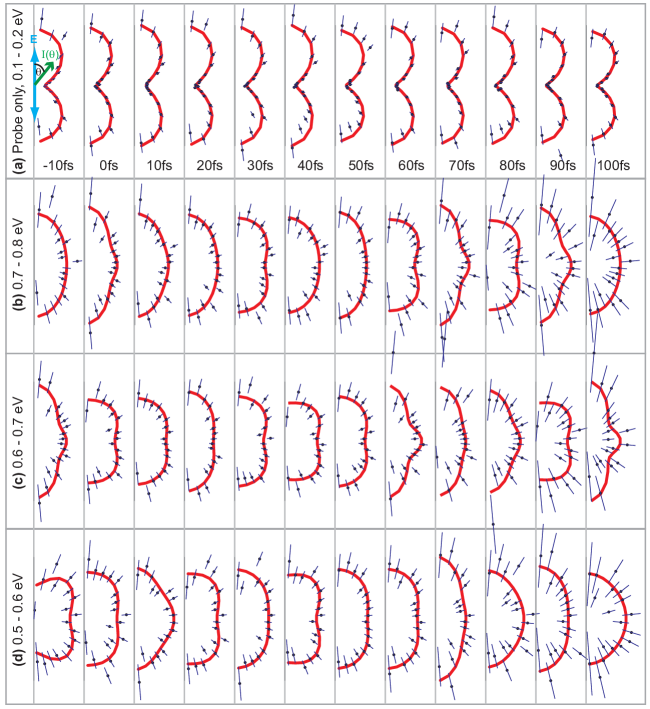
In order to extract TRPADs the data is calibrated and rebinned in polar coordinates as detailed in section II.3 to give the intensity (counts) per 4D volume element , denoted . The choice of binning is, naturally, limited by the experimental time-steps and instrument resolution; however coarser binning can be used in order to improve the statistics at the loss of resolution. For the data presented here fs and eV, and in all cases shown here the data was also integrated over which, due to the cylindrical symmetry of this experiment, results in no loss of information but does improve the statistics per bin. To obtain the cleanest possible TRPADs the upper hemisphere electrons were discarded at the cost of a factor of two in counts. The data was also filtered for coincidences with the main parent ion feature. Because the parent ion dominates the signal, this filtering was not required to obtain TRPADs correlated with a given ion channel (although, more generally, could be used in this way), but did serve to remove all signal from background gas and scattered light, resulting in cleaner TRPADs albeit at the cost of total counts. Figure 7 shows an example of the TRPADs obtained in this way for four energy slices. In this representation, the areas of the TRPADs are normalised to unity in order to allow comparison of the form of the PADs independent of total counts. The error bars and scatter of the data points should therefore be used as a guide to the statistical significance of the extracted PADs over the various energy and time slices shown. The solid lines show a fit to an expansion in spherical harmonics, as defined by eqn. 1.
From the data it is immediately clear that the TRPADs exhibit complex behaviour. The TRPADs change rapidly as a function of , with changes on the order of 10 - 20 fs apparent. Because the laser pulses used in this work were around 35 - 40 fs in duration, there is already significant temporal blurring in the measured data. Despite this, the changes are still clear and unambiguous in the data. For comparison, TRPADs extracted for the probe only background (figure 7(a)) show no significant changes temporally beyond the signal noise, and consequent statistical variation of the fit, signifying that no temporal artefacts are present in the raw data or introduced via the data processing. The scatter in the data is worst at the poles of the distribution due to the normalisation factor which serves to amplify noise near the poles; conversely the equatorial region shows very little variability. There is some asymmetry present in the data which is ascribed to a combination of noise (scatter) and detector artefacts/inhomogeneities. For this latter reason the form of the extracted PADs (as defined by the fitted parameters) may not be highly accurate, but the results do have high precision and reproducibility as shown by figure 7(a), so any relative temporal changes observed should be reliable and robust within the statistical uncertainty.
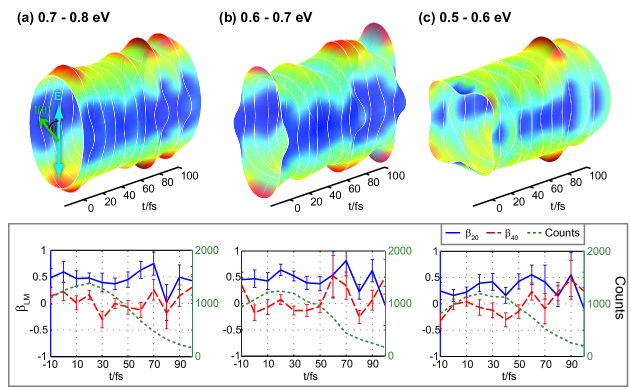
One challenge of high-dimensionality datasets is the presentation and/or reduction of the data to a more tractable form to allow for pattern recognition at a phenomenological or quantitative level. For the TRPADs one can reduce the full dataset to the fitted TRPADs, which can then be represented as or surfaces, or maps of . Figure 8 shows examples of the TRPADs represented as surfaces (in polar space) for the same three energy slices as figure 7(b)-(d), and the associated parameters are plotted in the insets with error bars. Such representation, as a function of energy or time, readily allows for comparison of the evolution of the shape of the PADs, although visual information about the quality of the raw data and fit fidelity are lost, so care must be exercised when drawing conclusions from such maps. For the TRPADs shown in figure 8, the comments pertaining to figure 7 can be reiterated, namely that the TRPADs for the different energy regions are significantly different, and show complex temporal evolution. More specifically, for the 0.5 - 0.6 eV region, the observed TRPADs show a 4-lobed structure (significant ) at fs, which evolves to a 4-lobed structure with a different orientation at fs, returns to near its initial shape at intermediate , and finally shows fast oscillations at fs, although these later oscillations may not be reliable due to the low statistics in this region. The colour mapping on the surface plots emphasises the evolution of the signal intensity along the equator and at the poles of the TRPADs; the corresponding plots show that both and change significantly as a function of , with displaying two peaks in the range fs. The trace shows a minimum at fs and a maximum at fs, which coincide with a mimimum and maximum in the trace, but at earlier times ( fs) and later times ( fs) the behaviour does not appear to be directly correlated to the trace.
For the 0.6 - 0.7 eV energy slice the picture is quite different. For the first time step the PAD again shows a 4-lobed structure, but with intensity peaked at the poles and equator, as opposed to at 45∘ as per the 0.5 - 0.6 eV window. This corresponds to a large and positive , compared with a large and negative for the lower energy slice. The value goes negative, with small magnitude, for the following time slices, and appears to show a slight oscillation with minima at fs and a peak at fs; the parameter shows a correlated oscillation but centred around a mean value of . In the surface plots, this oscillation appears as a slight breathing of the TRPADs, with the largest changes at the poles. At later times, fs, more complex behaviour is observed, with a significant beating around the equator of the distributions as well as at the poles.
For the 0.7 - 0.8 eV energy slice the behaviour is again different, with much less variability in the observed TRPADs over the peak of the signal. The value decreases gradually from the local maxima at fs until fs, then increases gradually to fs. The trace shows correlated local maxima at fs, but much more variability between these peaks. As was the case for the lower energy slices, the data at long delays shows significant scatter and has low statistics, so should be treated with care and carefully compared with the plots showing angular data points (figure 7) before drawing firm conclusions as to the veracity of the temporal evolution observed in this region. However, the fact that the observed dips at the same time ( fs) over all three energy slices, which were analysed independently, suggests this behaviour is genuine and not the result of random noise. In terms of the form of the TRPADs, the oscillations in the describe significant oscillations which include large changes to the photoelectron flux around the equator of the distributions. Because the equatorial region is statistically more reliable than the noisier poles this again suggests that these observations are genuine.
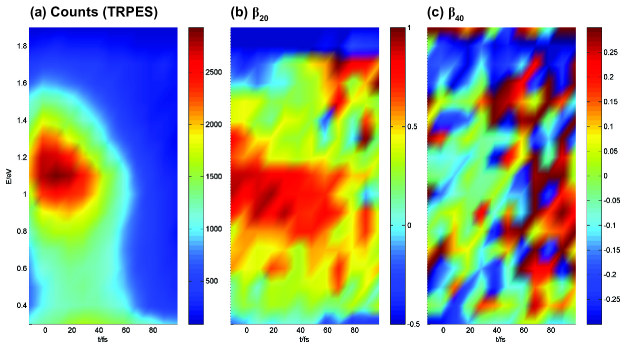
Figure 9 shows maps of the parameters for all energy and time slices, along with the TRPES. This representation of the TRPADs is essentially one step further removed from the raw data, so again should be used in concert with plots showing the raw data before drawing firm conclusions, but also provides the most reduced and tractable form of the measurement. In this format, the 3 energy regions discussed in detail in the preceding can be readily compared. It is clear that the higher energy region correlates to larger values, which change little over the main part of the signal, while the lower energy region shows marked oscillations; similar oscillations extend to the lower energy slices, with peaks around fs. At later times, fs, the trend is for reduced magnitude , particular over the main signal in the 0.9 - 1.3 eV region. These times are outside of the cross-correlation of the laser pulses, so should be representative of only the parts of the excited state wavepacket which move orthogonal to the steep gradients on the potential energy surface responsible for the speed of the dynamics and the rapid IP change observed (i.e. population which remains in a given region of configuration space for a longer time than the main part of the wavepacket). The map shows much more oscillatory behaviour, which appears to show no obvious correlation with energy or time, except for the trend towards larger positive values at . For higher time resolution data it would be feasible to Fourier Transform this data to extract the frequency content, but for the dataset shown here the limited number of delays results in only a crude frequency spectrum of little utility.
In summary, the TRPADs presented here contain a plethora of information, and show very complex temporal evolution, in contrast to the TRPES which provides little information on the temporal evolution of a given energy slice over the probe pulse envelope, nor provides an observable as sensitive to the underlying dynamics. The challenge for the experimentalist is to determine whether the richness of the measured TRPADs can be interpreted in terms of the underlying dynamics without recourse to detailed theoretical treatments, that is to say without a priori knowledge of the underlying molecular dynamics or a full ab initio treatment of the dynamics and ionization. These points are discussed further below (section III.5).
III.4 High-dimensionality mappings: correlated observables
The advantages of measuring in coincidence have already been discussed in terms of removal of background or other unwanted signals from the data hypercube. Naturally a further advantage is the ability to look for ion-electron correlations, and retrieve minor channels which would otherwise be inaccessible; for instance, the photoelectron spectra of the fragment channels, which would not be distinguishable in a non-coincidence measurement.
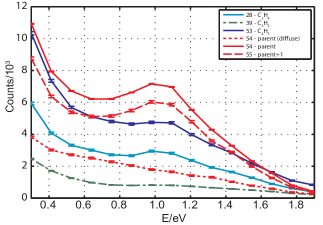
Figure 10 shows the photoelectron spectra (time-integrated) for the major ion channels as shown in figure 5. The parent ion correlated spectra shows the main cross-correlation feature around 1 eV, and a rise towards lower energy, as already seen in the TRPES mapping (figure 6). As expected, the parent+1 channel has an identical spectrum. However, the diffuse part of the parent ion signal has a very different spectrum, consistent with a different ionization process. Similarly, the fragmentation channels show different spectra; in all cases the spectrum is broad, and there is a drop or even disappearance of the 1 eV peak seen in the parent ion channel. These spectra therefore provide additional information towards understanding the excited state dynamics, with the spectra providing a fingerprint of different ionization channels. Here, the suppression of the cross-correlation peak in the fragment channels is consistent with the delayed opening of these channels, as observed in the time-resolved ion yields.
Furthermore, the similarity between the channels suggests ionization occurs from a similar region of configuration space in all cases. This is consistent with the similarity of the rise times and fall times observed in the time-resolved fragment yields, which intuitively suggests only a single dynamical pathway, shared by all the fragment channels, hinting at localization of the excited state wavepacket in configuration space. The similarity of the time-scales of the fragment channels, considered in light of the similarities in the correlated photoelectron spectra, therefore suggests that the fragmentation pathway of the ion is very sensitive to the form of the wavepacket at the time of ionization and, possibly, bifurcation on the ionic state(s) may lead to channels with apparently similar temporal response, but quite different fragmentation products. This is consistent with the picture of rapid wavepacket motion, with little dispersion, on the excited state and additionally indicates complex dissociation dynamics on the ionic surfaces. In terms of the experimentally accessed ionization pathways, the observation of similar photoelectron spectra for the fragment channels is consistent with the possibility of sequential 1+2′ processes (ionization to followed by absorption of a second probe photon) as discussed in section III.2, but suggests that direct 1+2′ ionization to higher lying cationic states, and 1+1′ ionization to , are unlikely channels. Direct ionization to excited ionic states would be expected to correlate generally with different spectra, although it is always possible that the spectra would not be significantly different - especially given the diffuse, unstructured nature of the photoelectron bands of butadiene - so this is not a rigorous conclusion.
Various other correlated mappings are available from the data, and will be explored in a future publication. For example, the fragment correlated TRPES and TRPADs, although for weak channels the latter is very demanding statistically. For photodissociation studies energy correlation spectra - maps of electon vs. ion kinetic energy - are also useful Davies1999 (12).
III.5 Discussion - mapping dynamics with multi-dimensional measurements
The data presented herein indicates that rapid and complex dynamics are present in butadiene, consistent with earlier experimental Fuss2001 (44, 43, 38) and theoretical Garavelli2001 (68, 39) works. The benefit of a multidimensional dataset is clear, with complementary information available from the coincident electron and ion data. The overall shape of the dynamics, that of a near-Gaussian wavepacket which moves along steep gradients on the potential energy surface which are strongly correlated with the vertical IP, and shows little dispersion along other coordinates, emerges rapidly from the data. This picture fits both the chirped TRPES data and the delayed-onset of fragmentation channels which are assumed to be correlated with ionization to . The observation of TRPADs which show very rich behaviour on rapid timescales (20 fs) is striking, and indicates the sensitivity of the TRPADs to the dynamics under study.
However, more specific mechanistic details, such as the nuclear motions involved or the mapping of these motions onto the TRPADs, do not seem to be forthcoming. This is in contrast to simpler cases, such as previous work on the dimer Gessner2006 (16) or Bisgaard2009 (18, 37), in which the limited dimensionality of the problem enabled a more direct empirical approach, coupled with symmetry-based modelling to understand the measurements in more detail. Understanding the information conveyed by the TRPADs from larger systems therefore remains a significant challenge.
In the case of butadiene, detailed ab initio dynamics calculations do exist Levine2009 (39), and further studies are ongoing schuurman2012 (69). It is therefore very tempting to compare the measurements to these calculations, despite the fact that these calculations do not, so far, explicitly include the ionization matrix elements. For instance, figures 5 and 6 of ref. Levine2009 (39) show the behaviour and timescales associated with the bond alternation coordinate (a motion involving bonds along the carbon backbone streching and compressing) and the out-of-plane twisting motions (twisting about the central CC bond and twisting of the terminal methyl groups). The bond alternation coordinate shows oscillations with a period of 20 fs, and large amplitude motion with changes up to 0.4 Å. The twisting coordinates show rapid changes over fs, followed by almost constant bond angles, with some fluctuations, for the remaining 160 fs of the calculations. These motions are very suggestive of the oscillations observed in for some of the low-energy slices, and the gradual rise over 60 fs observed in over all photoelectron energies. However, from the data presented in ref. Levine2009 (39) it is not apparent how these motions map to the IP, which is a very significant factor in drawing these conclusions more firmly. As shown in ref. Arasaki2010 (29) such mappings may be very complex, and difficult to determine from anything but a full calculation including the ionization matrix elements.
Another conclusion from the dynamics calculations, which is likely to be more robust, is the agreement between the timescale of the population dynamics and the gross changes in both and at all energies for fs. Figure 4 of ref. Levine2009 (39) shows the populations of the bright and dark adiabatic states, defined there as and respectively. The population dips almost immediately from its initial value at , with almost equal populations of and at fs, the population then grows again and peaks at around 50 fs, while the population drops rapidly. Unsurprisingly, given the similarity of the timescales to those mentioned above, the non-adiabatic coupling between these states is primarily mediated by the out-of-plane twisting motions. In terms of the electronic character of the states, the early time dynamics is best considered in a diabatic picture, with the bright state character maintained as population switches from the to the surface at early times Levine2009 (39), while over the longer timescale the electronic character becomes mixed by the out-of-plane twisting, and population is transferred non-adiabatically between and .
Given that the adiabatic states are of different electronic character one would expect a different PAD from each state; additionally, interferences between photoelectrons from the two states (different parts of a split wavepacket) may also play a significant role in the observable if electrons of the same energy are created from the two states, and this could lead to more rapid modulations in the form of the TRPADs (this is essentially the concept of the two-state model previously applied to Hockett2011 (37)), particularly in the case of symmetry-breaking leading to mixing of the adiabatic electronic state characters. With this in mind, it appears that the (adiabatic) population dynamics may have a more direct link to the observed TRPADs, with the changes at fs corresponding to the region where most of the population is on a single adiabatic state, and the molecular geometry, hence electronic character, has stabilised after the initial, rapid, out-of-plane twisting. Although this picture seems reasonable, without further modelling or calculations these conclusions remain somewhat tentative.
The challenge for the experimentalist therefore remains: to determine how the TRPADs, and other correlated observables, can be interpreted without recourse to detailed theoretical treatments, hence without a priori knowledge of the underlying molecular dynamics or a full ab initio treatment of the dynamics and ionization. While such computational approaches are very powerful, they are also time consuming, difficult, and only computationally tractable for small molecules. Naturally the same applies to a purely experimental approach to the TRPES and TRMS data, but typically the lower dimensionality of this data lends itself to only broad interpretations, such as the presence of band switching Blanchet1999 (31) or quantum beats, which may fully describe the wavepacket dynamics in small systems Fischer1996 (70) or arise from only the recurrent parts of the wavepacket Bisgaard2009 (18, 37) in more complex cases. Moreover, TRPES data is routinely interpreted via fitting of temporal profiles in what is essentially a principle component or single-value decomposition analysis Wu2011a (71, 72). While such analysis provides a quantitative breakdown of the data into spectral and temporal functions, it makes many assumptions regarding the underlying dynamics (vis. that the observables equate directly to state populations in the standard interpretations, or at the very least behave phenomenologically in a statistical manner) and cannot be used to treat more complex dynamics, such as the kind observed here, without recourse to many time constants. The TRPADs clearly convey more information on the wavepacket dynamics, but the mapping from wavepacket to observable is inherently complicated.
Aside from the TRPADs, the full imaging data provides further correlated observables which may also be considered in light of the computational results. In particular, the time-resolved ion yields and fragment-correlated photoelectron spectra may provide a way of experimentally probing the three CIs discussed in ref. Levine2009 (39), which correspond to different molecular geometries. It is likely that ionization from these different regions of configuration space (if energetically possible in the limited observation window) would lead to different photoelectron spectra and different fragmentation products from . Even in the case where direct ionization from these regions is energetically forbidden, ionization of the parts of the wavepacket on heading towards these distinct regions of configuration space would also result in different dynamics on the ion surfaces, hence possibly lead to different fragmentation products. Further analysis of ion-electron correlations should present deeper insight into the excited state dynamics than uncorrelated ion or electron measurements alone.
IV Conclusions & future work
The data presented here illustrates the richness of coincidence imaging datasets, even in the case of very rapid and complex dynamics; it also highlights the difficulty of interpretation of such data. In this work, we have focussed on the TRPADs obtained in coincidence with the parent ion channel, and made some tentative comparisons with theory. In general the full 7D data provides the best hope of understanding the excited state dynamics of molecules but, unsurprisingly, significant effort is required to gain understanding directly from the data, or with the aid of theory. Despite the depth of material presented here there are still many avenues to explore in order to obtain more complete, unified experimental and theoretical approaches to problems in excited state dynamics.
In future work we hope to continue bridging this gap between experiment and theory via a number of routes: by the more direct and explicit comparison of the experimental data with dynamics calculations, and the inclusion of observables in the calculations; by exploring further the possibilities of modelling for a qualitative/semi-quantitative treatment of the dynamics, expanding upon previous work which employed a simple 2-state model Hockett2011 (37), possibly to include a basic wavepacket treatment; through further analysis of the ion fragment distributions, which have not yet been fully explored; by making further experimental measurements for aligned systems and with different pump-probe polarisation geometries in order to obtain more detailed TRPADs (in both cases more terms are allowed in the PADs), with harder VUV probe photons to access a larger photoelectron energy range, and with a stability enhanced set-up to allow for longer experimental runs; by further use of fragment correlated TRPES/TRPADs, so far not statistically feasible due to the dominance of the parent ion channel and consequent low total counts in these fragment channels. This multi-dimensional approach to a multi-dimensional challenge will hopefully prove fruitful for a deeper understanding of excited state dynamics in polyatomic molecules and, in particular, help to make the experimental measurement of such dynamics a more routine and insightful tool.
V Acknowledgements
We thank Owen Clarkin and Jochen Mikosch for general assistance with the CIS instrument, Rune Lausten for assistance with the laser system and optical set-up, Doug Moffat for assistance with the data acquisition software and Denis Guay for assistance with vacuum hardware. We also thank Andrey Boguslavskiy and Michael Schuurman for helpful discussions on butadiene and associated dynamics calculations.
References
- (1) Moshammer, R.; Ullrich, J.; Unverzagt, M.; Schmidt, W.; Jardin, P.; Olson, R.; Mann, R.; Dörner, R.; Mergel, V.; Buck, U.; et al. Low-Energy Electrons and Their Dynamical Correlation with Recoil Ions for Single Ionization of Helium by Fast, Heavy-Ion Impact. Physical Review Letters 1994, 73 (25) (Dec.), 3371–3374.
- (2) Moshammer, R.; Unverzagt, M.; Schmitt, W.; Ullrich, J.; et al. A 4 recoil-ion electron momentum analyzer: a high-resolution “microscope” for the investigation of the dynamics of atomic, molecular and nuclear reactions. Nuclear Instruments and Methods in Physics Research Section B: Beam Interactions with Materials and Atoms 1996, 108 (4) (Mar.), 425–445.
- (3) Ullrich, J.; Moshammer, R.; Dörner, R.; Jagutzki, O.; Mergel, V.; Schmidt-Böcking, H.; et al. Recoil-ion momentum spectroscopy. Journal of Physics B: Atomic, Molecular and Optical Physics 1997, 30 (13) (Jul.), 2917–2974.
- (4) Dörner, R.; Mergel, V.; Jagutzki, O.; Spielberger, L.; Ullrich, J.; Moshammer, R.; et al. Cold Target Recoil Ion Momentum Spectroscopy: a ‘momentum microscope’ to view atomic collision dynamics. Physics Reports 2000, 330 (2-3) (Jun.), 95–192.
- (5) Czasch, A.; Schmidt, L.; Jahnke, T.; Weber, T.; Jagutzki, O.; Schössler, S.; Schöffler, M.; Dörner, R.; et al. Photo induced multiple fragmentation of atoms and molecules: Dynamics of Coulombic many-particle systems studied with the COLTRIMS reaction microscope. Physics Letters A 2005, 347 (1-3) (Nov.), 95–102.
- (6) Landers, A.; Weber, T.; Ali, I.; Cassimi, A.; Hattass, M.; Jagutzki, O.; Nauert, A.; Osipov, T.; Staudte, A.; Prior, M.; Schmidt-Böcking, H.; Cocke, C.; et al. Photoelectron Diffraction Mapping: Molecules Illuminated from Within. Physical Review Letters 2001, 87 (1) (Jun.), 1–4.
- (7) Akoury, D.; Kreidi, K.; Jahnke, T.; Weber, T.; Staudte, A.; Schöffler, M.; Neumann, N.; Titze, J.; Schmidt, L.P.H.; Czasch, A.; Jagutzki, O.; Costa Fraga, R.A.; Grisenti, R.E.; Díez Muiño, R.; Cherepkov, N.A.; Semenov, S.K.; Ranitovic, P.; Cocke, C.L.; Osipov, T.; Adaniya, H.; Thompson, J.C.; Prior, M.H.; Belkacem, A.; Landers, A.L.; Schmidt-Böcking, H.; et al. The simplest double slit: interference and entanglement in double photoionization of H2.. Science 2007, 318 (5852), 949–952.
- (8) Meckel, M.; Comtois, D.; Zeidler, D.; Staudte, A.; Pavicic, D.; Bandulet, H.C.; Pépin, H.; Kieffer, J.C.; Dörner, R.; Villeneuve, D.M.; et al. Laser-induced electron tunneling and diffraction.. Science 2008, 320 (5882) (Jun.), 1478–82.
- (9) Eckle, P.; Pfeiffer, A.N.; Cirelli, C.; Staudte, A.; Dörner, R.; Muller, H.G.; Büttiker, M.; et al. Attosecond ionization and tunneling delay time measurements in helium.. Science (New York, N.Y.) 2008, 322 (5907) (Dec.), 1525–9.
- (10) Ueda, K. High-resolution inner-shell spectroscopies of free atoms and molecules using soft-x-ray beamlines at the third-generation synchrotron radiation sources. Journal of Physics B: Atomic, Molecular and Optical Physics 2003, 36 (4) (Feb.), R1–R47.
- (11) Reid, K.L. Photoelectron angular distributions: developments in applications to isolated molecular systems. Molecular Physics 2012, 110 (3) (Feb.), 131–147.
- (12) Davies, J.A.; LeClaire, J.E.; Continetti, R.E.; et al. Femtosecond time-resolved photoelectron-photoion coincidence imaging studies of dissociation dynamics. The Journal of Chemical Physics 1999, 111 (1), 1.
- (13) Lafosse, A.; Lebech, M.; Brenot, J.; Guyon, P.; Jagutzki, O.; Spielberger, L.; Vervloet, M.; Houver, J.; et al. Vector Correlations in Dissociative Photoionization of Diatomic Molecules in the VUV Range: Strong Anisotropies in Electron Emission from Spatially Oriented NO Molecules. Physical Review Letters 2000, 84 (26) (Jun.), 5987–5990.
- (14) Continetti, R.E. Coincidence Spectroscopy. Annual Review of Physical Chemistry 2001, 52 (1), 165–192.
- (15) Lebech, M.; Houver, J.C.; Dowek, D. Ion-electron velocity vector correlations in dissociative photoionization of simple molecules using electrostatic lenses. Review of Scientific Instruments 2002, 73 (4), 1866.
- (16) Gessner, O.; Lee, A.M.D.; Shaffer, J.P.; Reisler, H.; Levchenko, S.V.; Krylov, A.I.; Underwood, J.G.; Shi, H.; East, A.L.L.; Wardlaw, D.M.; Chrysostom, E.t.H.; Hayden, C.C.; et al. Femtosecond Multidimensional Imaging of a Molecular Dissociation. Science 2006, 311 (5758), 219–222.
- (17) Vredenborg, A.; Roeterdink, W.G.; Janssen, M.H.M. A photoelectron-photoion coincidence imaging apparatus for femtosecond time-resolved molecular dynamics with electron time-of-flight resolution of sigma=18 ps and energy resolution Delta E/E=3.5%.. The Review of Scientific Instruments 2008, 79 (6) (Jun.), 063108.
- (18) Bisgaard, C.Z.; Clarkin, O.J.; Wu, G.; Lee, A.M.D.; Gessner, O.; Hayden, C.C.; et al. Time-Resolved Molecular Frame Dynamics of Fixed-in-Space CS2 Molecules. Science 2009, 323 (5920), 1464–1468.
- (19) Davies, J.A.; Continetti, R.E.; Chandler, D.W.; et al. Femtosecond time-resolved photoelectron angular distributions probed during photodissociation of NO2.. Physical Review Letters 2000, 84 (26 Pt 1) (Jun.), 5983–6.
- (20) Lee, A.M.D. Chemical Reaction Dynamics and Coincidence Imaging Spectroscopy. Ph.D. thesis, Queen’s University, 2007.
- (21) Liu, S.Y.; Alnama, K.; Matsumoto, J.; Nishizawa, K.; Kohguchi, H.; Lee, Y.P.; et al. He I ultraviolet photoelectron spectroscopy of benzene and pyridine in supersonic molecular beams using photoelectron imaging.. The Journal of Physical Chemistry A 2011, 115 (14) (Apr.), 2953–65.
- (22) Clarkin, O.J. Chemical Reaction Dynamics at the Statistical Ensemble and Molecular Frame Limits. Ph.D. thesis, Queen’s University, 2012.
- (23) Clarkin, O.J.; Hockett, P.; Mikosch, J.; et al. In Preparation 2013.
- (24) Rijs, A.; Janssen, M.; Chrysostom, E.; et al. Femtosecond Coincidence Imaging of Multichannel Multiphoton Dynamics. Physical Review Letters 2004, 92 (12) (Mar.), 1–4.
- (25) Arasaki, Y.; Takatsuka, K.; Wang, K.; et al. Femtosecond energy- and angle-resolved photoelectron spectroscopy. The Journal of Chemical Physics 2000, 112 (20), 8871–8884.
- (26) Seideman, T. Time-resolved photoelectron angular distributions: concepts, applications, and directions.. Annual Review of Physical Chemistry 2002, 53 (Jan.), 41–65.
- (27) Suzuki, Y.; Stener, M.; Seideman, T. Multidimensional calculation of time-resolved photoelectron angular distributions: The internal conversion dynamics of pyrazine. The Journal of Chemical Physics 2003, 118 (10), 4432–4443.
- (28) Stolow, A.; Underwood, J.G., Time-Resolved Photoelectron Spectroscopy of Nonadiabatic Dynamics in Polyatomic Molecules, Advances in Chemical Physics ; Vol. 139, 2008; .
- (29) Arasaki, Y.; Takatsuka, K.; Wang, K.; et al. Time-resolved photoelectron spectroscopy of wavepackets through a conical intersection in NO2.. The Journal of Chemical Physics 2010, 132 (12) (Mar.), 124307.
- (30) Wu, G.; Hockett, P.; Stolow, A. Time-resolved photoelectron spectroscopy: from wavepackets to observables.. Physical Chemistry Chemical Physics 2011, 13 (41) (Nov.), 18447–67.
- (31) Blanchet, V.; Zgierski, M.Z.; Seideman, T.; et al. Discerning vibronic molecular dynamics using time-resolved photoelectron spectroscopy. Nature 1999, 401, 52–54.
- (32) Blanchet, V.; Zgierski, M.Z.; Stolow, A. Electronic continua in time-resolved photoelectron spectroscopy. I. Complementary ionization correlations. The Journal of Chemical Physics 2001, 114 (3), 1194–1205.
- (33) Schmitt, M.; Lochbrunner, S.; Shaffer, J.P.; Larsen, J.J.; Zgierski, M.Z.; et al. Electronic continua in time-resolved photoelectron spectroscopy. II. Corresponding ionization correlations. The Journal of Chemical Physics 2001, 114 (3), 1206–1213.
- (34) Shapiro, M.; Vrakking, M.J.J.; Stolow, A. Nonadiabatic wave packet dynamics: Experiment and theory in IBr. The Journal of Chemical Physics 1999, 110 (5), 2465.
- (35) Arasaki, Y.; Takatsuka, K.; Wang, K.; et al. Probing wavepacket dynamics with femtosecond energy- and angle-resolved photoelectron spectroscopy. Journal of Electron Spectroscopy and Related Phenomena 2000, 108 (1-3), 89 – 98.
- (36) Wollenhaupt, M.; Engel, V.; Baumert, T. Femtosecond laser photoelectron spectroscopy on atoms and small molecules: prototype studies in quantum control.. Annual Review of Physical Chemistry 2005, 56 (Jan.), 25–56.
- (37) Hockett, P.; Bisgaard, C.Z.; Clarkin, O.J.; et al. Time-resolved imaging of purely valence-electron dynamics during a chemical reaction. Nature Physics 2011, 7 (8) (Apr.), 612–615.
- (38) Boguslavskiy, A.E.; Schalk, O.; Schuurman, M.; Townsend, D.; et al. Excited State Dynamics in the Smallest Polyene: Ultrafast Time-Resolved Photoelectron-Photoion Coincidence Spectroscopy of 1,3-Butadiene. In Preparation 2013.
- (39) Levine, B.G.; Martínez, T.J. Ab initio multiple spawning dynamics of excited butadiene: role of charge transfer.. The Journal of Physical Chemistry A 2009, 113 (46) (Nov.), 12815–24.
- (40) Tao, H.; Allison, T.K.; Wright, T.W.; Stooke, a.M.; Khurmi, C.; van Tilborg, J.; Liu, Y.; Falcone, R.W.; Belkacem, A.; et al. Ultrafast internal conversion in ethylene. I. The excited state lifetime.. The Journal of Chemical Physics 2011, 134 (24) (Jun.), 244306.
- (41) Leopold, D.G.; Pendley, R.D.; Roebber, J.L.; Hemley, R.J.; et al. Direct absorption spectroscopy of jet-cooled polyenes. II. The 1 1B+u←1 1A−g transitions of butadienes and hexatrienes. The Journal of Chemical Physics 1984, 81 (10) (Nov.), 4218.
- (42) Krawczyk, R.; Malsch, K.; Hohlneicher, G. 11Bu–21Ag conical intersection in trans-butadiene: ultrafast dynamics and optical spectra. Chemical Physics 2000, (April), 535–541.
- (43) Assenmacher, F.; Gutmann, M.; Hohlneicher, G.; Stert, V.; et al. Ultrafast dynamics of the 11Bu-state of 1,3-butadiene after excitation at 204 nm. Physical Chemistry Chemical Physics 2001, 3 (15), 2981–2982.
- (44) Fuß, W.; Schmid, W.; Trushin, S. Ultrafast electronic relaxation of s-trans-butadiene. Chemical Physics Letters 2001, 342 (July), 91–98.
- (45) Werner, A.S. Absolute unimolecular decay rates of energy selected C4H6+ metastable ions. The Journal of Chemical Physics 1975, 62 (7) (Apr.), 2900.
- (46) Dannacher, J.; Flamme, J.P.; Stadelmann, J.P.; et al. Unimolecular fragmentations of internal energy selected 1,3-butadiene cations. Chemical Physics 1980, 51 (1-2) (Sep.), 189–195.
- (47) Fang, W.; Gong, L.; Zhang, Q.; Shan, X.; Liu, F.; Wang, Z.; et al. Dissociative photoionization of 1,3-butadiene: experimental and theoretical insights.. The Journal of Chemical Physics 2011, 134 (17) (May), 174306.
- (48) Boguslavskiy, A.E.; Mikosch, J.; Gijsbertsen, A.; Spanner, M.; Patchkovskii, S.; Gador, N.; Vrakking, M.J.J.; et al. The Multielectron Ionization Dynamics Underlying Attosecond Strong-Field Spectroscopies. Science 2012, 335 (6074), 1336–1340.
- (49) Even, U.; Jortner, J.; Noy, D.; Lavie, N.; et al. Cooling of large molecules below 1 K and He clusters formation. The Journal of Chemical Physics 2000, 112 (18), 8068.
- (50) Homann, C.; Krebs, N.; Riedle, E. Convenient pulse length measurement of sub-20-fs pulses down to the deep UV via two-photon absorption in bulk material. Applied Physics B 2011, 104 (4) (Aug.), 783–791.
- (51) Parker, D.H.; Introduction, I. Velocity map imaging of ions and electrons using electrostatic lenses: Application in photoelectron and photofragment ion imaging of molecular oxygen. Review of Scientific Instruments 1997, 68 (September), 3477–3484.
- (52) Osterwalder, A.; Nee, M.J.; Zhou, J.; et al. High resolution photodetachment spectroscopy of negative ions via slow photoelectron imaging. The Journal of Chemical Physics 2004, 121 (13), 6317–6322.
- (53) Garcia, G.A.; Nahon, L.; Harding, C.J.; Mikajlo, E.A.; et al. A refocusing modified velocity map imaging electron/ion spectrometer adapted to synchrotron radiation studies. Review of Scientific Instruments 2005, 76 (5), 053302.
- (54) Hockett, P. Photoionization Dynamics of Polyatomic Molecules. Ph.D. thesis, University of Nottingham, 2009.
- (55) Chichinin, A.I.; Gericke, K.H.; Kauczok, S.; et al. Imaging chemical reactions – 3D velocity mapping. International Reviews in Physical Chemistry 2009, 28 (4) (Oct.), 607–680.
- (56) Stert, V.; Radloff, W.; Schulz, C.; et al. Ultrafast photoelectron spectroscopy: Femtosecond pump-probe coincidence detection of ammonia cluster ions and electrons. The European Physical Journal D 1999, 5 (1), 97.
- (57) Mikosch, J. In preperation 2013.
- (58) Yang, C.N. On the Angular Distribution in Nuclear Reactions and Coincidence Measurements. Physical Review 1948, 74 (7) (Oct), 764–772.
- (59) Reid, K.L. Photoelectron Angular Distributions. Annual Review of Physical Chemistry 2003, 54 (1), 397–424.
- (60) Dixon, R.N. The determination of the vector correlation between photofragment rotational and translational motions from the analysis of Doppler-broadened spectral line profiles. The Journal of Chemical Physics 1986, 85 (4) (Aug.), 1866.
- (61) Rakitzis, T.P.; Zare, R.N. Photofragment angular momentum distributions in the molecular frame: Determination and interpretation. The Journal of Chemical Physics 1999, 110 (7) (Feb.), 3341.
- (62) Clark, A.P.; Brouard, M.; Quadrini, F.; et al. Atomic polarization in the photodissociation of diatomic molecules.. Physical Chemistry Chemical Physics 2006, 8 (48) (Dec.), 5591–610.
- (63) Suits, A.G.; Vasyutinskii, O.S. Imaging atomic orbital polarization in photodissociation.. Chemical reviews 2008, 108 (9) (Sep.), 3706–46.
- (64) Rakitzis, T.P.; Alexander, A.J. Photofragment angular momentum distributions in the molecular frame. II. Single state dissociation, multiple state interference, and nonaxial recoil in photodissociation of polyatomic molecules.. The Journal of Chemical Physics 2010, 132 (22) (Jun.), 224310.
- (65) Chupka, W.A. Factors affecting lifetimes and resolution of Rydberg states observed in zero-electron-kinetic-energy spectroscopy. The Journal of Chemical Physics 1993, 98 (6), 4520–4530.
- (66) Cockett, M.C.R. Photoelectron spectroscopy without photoelectrons: Twenty years of ZEKE spectroscopy. Chemical Society Reviews 2005, 34 (11) (Nov.), 935–948.
- (67) White, R.; Carlson, T.; Spears, D. Angular distribution of the photoelectron spectra for ethylene, propylene, butene and butadiene. Journal of Electron Spectroscopy and Related Phenomena 1974, 3, 59–70.
- (68) Garavelli, M.; Bernardi, F.; Olivucci, M.; Bearpark, M.J.; Klein, S.; et al. Product Distribution in the Photolysis of s-cis Butadiene: A Dynamics Simulation. The Journal of Physical Chemistry A 2001, 105 (51) (Dec.), 11496–11504.
- (69) Schuurman, M. Personal communication; , 2012.
- (70) Fischer, I.; Vrakking, M.; Villeneuve, D.; et al. Femtosecond time-resolved zero kinetic energy photoelectron and photoionization spectroscopy studies of I-2 wavepacket dynamics. Chemical Physics 1996, 207 (2-3) (JUL 1), 331–354.
- (71) Wu, G.; Boguslavskiy, A.E.; Schalk, O.; Schuurman, M.S.; et al. Ultrafast non-adiabatic dynamics of methyl substituted ethylenes: the 3s Rydberg state.. The Journal of Chemical Physics 2011, 135 (16) (Oct.), 164309.
- (72) van Wilderen, L.J.G.W.; Lincoln, C.N.; van Thor, J.J. Modelling multi-pulse population dynamics from ultrafast spectroscopy.. PloS one 2011, 6 (3) (Jan.), e17373.