SIGNATURES OF LONG-LIVED SPIRAL PATTERNS.
Abstract
Azimuthal age/color gradients across spiral arms are a signature of long-lived spirals. From a sample of 19 normal (or weakly barred) spirals where we have previously found azimuthal age/color gradient candidates, 13 objects were further selected if a two-armed grand-design pattern survived in a surface density stellar mass map. Mass maps were obtained from optical and near-infrared imaging, by comparing with a Monte Carlo library of stellar population synthesis models that allowed us to obtain the mass-to-light ratio in the -band, , as a function of () versus () color. The selected spirals were analyzed with Fourier methods in search for other signatures of long-lived modes related to the gradients, such as the gradient divergence toward corotation, and the behavior of the phase angle of the two-armed spiral in different wavebands, as expected from theory. The results show additional signatures of long-lived spirals in at least 50% of the objects.
1 Introduction.
Understanding the origin of spiral arms, bars, and rings is key for discerning the long-term evolution of disk galaxies. The density wave (DW) theory, originally conceived by Lindblad (1963) and developed in a linear form by Lin & Shu (1964), has been commonly brought up to explain spiral structure. One fundamental prediction of this theory is the presence of offsets between tracers of the different stages of star formation and evolution (Roberts, 1969). A manifestation of these offsets would be age/color gradients across arms, as a result of the interaction between a spiral pattern with an angular speed that is nearly constant with radius, and stars and gas with differential rotation. The gas overtakes the spiral pattern inside corotation (CR, i.e., the radius where the pattern and orbital angular velocities are the same), and is left behind outside CR. As gas feels the gravitational potential near the spiral arms, it shocks (Roberts, 1969; Gittins & Clarke, 2004). This produces the piling up of dust and molecular gas that is commonly found in the concave side of the arms, if the process occurs inside CR and spiral arms trail. If the shock triggers star formation, an age (or color) gradient is expected across spiral arms as the new stars age and drift away from the arms. Young stars would be located immediately downstream the dust lanes, followed by increasingly older stars in the direction of rotation. In part due to the difficulties encountered to detect such gradients, the relevance of spiral DWs for disk galaxies has been repeatedly challenged. Recent examples are Foyle et al. (2011), Grand et al. (2012a, b), and Ferreras et al. (2012).
In a series of papers, we have detected and studied azimuthal color/age gradients across spiral arms and bars, thus establishing a relation between spiral or bar dynamics and star formation (González & Graham, 1996; Martínez-García et al., 2009a, b; Martínez-García & González-Lópezlira, 2011). Our studies suggest that azimuthal gradients can be found in almost every galaxy, but are difficult to detect and do not appear widespread within a single galaxy. Efremov (2010) has noticed an inverse correlation between the signatures of a spiral shock, and the presence of chains of star complexes (“beads on a string”) in spiral arms; he has also observed that spiral shocks seem to be associated with an irregular magnetic field (Dobbs & Price, 2008), whereas the “beads on a string” configuration correlates with the existence of a regular magnetic field.111 On smaller scales than color gradients, Herschel Space Observatory (Pilbratt et al., 2010) has shown that stars form along gaseous filaments, whose width is surprisingly constant, pc, irrespective of central column density (Arzoumanian et al., 2011).
The “infant mortality” of star clusters (Lada & Lada, 2003; Goodwin & Bastian, 2006), that leads to their disruption in the first 10-30 Myr, may prevent the formation of age gradients even if shocks trigger star formation. Stellar winds and supernovae may drive out the gas not used in star formation, causing a change in the gravitational potential. This would lead to the disintegration of the clusters, as stars become unbound. Coherent age gradients must first survive the “infant mortality” process; then, after Myr, the “dissolution of stellar groups” scenario proposed by Wielen (1977) can also take place near spiral arms. These last process can explain the apparent “downstream decline” of the gradients already noticed by us (cf. Martínez-García et al., 2009a; Martínez-García & González-Lópezlira, 2011).
1.1 Pattern speed variation with Radius.
Recently, based on the analysis with the radial Tremaine-Weinberg (RTW) method of CO and HI data of several galaxies, it has been proposed that the spiral pattern speed may actually increase with decreasing radius in some objects (Merrifield et al., 2006; Meidt et al., 2009; Speights & Westpfahl, 2012). According to Wada et al. (2011) and Grand et al. (2012a, b), this behavior is also seen in simulations.222Roca-Fàbrega et al. (2013) find that a radially varying occurs only in simulations with flocculent, transient arms. If this is indeed the case, there would be no real long-lived pattern with solid body rotation, and hence no significant offsets between the tracers of the different stages of star formation would be expected (see, for example, Grand et al., 2012b). In particular, azimuthal color gradients across the arms would not be observed.
In Martínez-García et al. (2009b), we investigated the effect of having (and neglecting) non-circular streaming motions, that is, of using a purely circular dynamic model to derive spiral pattern speeds from observations of color gradients. Summarizing, based on semi-analytical solutions and MHD simulations, gas orbits were obtained for models with a fixed pattern speed. Stellar population synthesis (SPS) models of age gradients were incorporated to these gas orbits, and synthetic photometric observations were performed.333We assumed that young stars retain the velocity components of their parental molecular clouds. The method of González & Graham (1996, hereafter GG96) was then applied to measure . In spite of having a real pattern speed, constant with radius, higher pattern speeds were measured at smaller radii (see Figure 1). As mentioned in Martínez-García et al. (2009b), the reason for this bias is that gas streamlines in a steady rotating spiral shock turn somewhat along the arm after passing through the shock. Hence, stars take longer to move away from the arm, and the observer will think there is a smaller difference between the pattern speed and the orbital frequency. will seem to follow , just like in the previously mentioned applications of the radial RTW method, except that in our case we can be sure that the trend is caused by the streaming motions of the young stars, rather than by a radial variation of . The bias is also found in real observations, as shown in Martínez-García et al. (2009b).
In an ideal scenario where is indeed constant for all radii and spiral arms trigger star formation in all their extension, color gradients are predicted to be located all along the arms (except near CR). In reality, age gradients are detected only in a few small regions per galaxy, but they do seem linked to disk dynamics (GG96; Martínez-García et al., 2009a, b; Martínez-García & González-Lópezlira, 2011). So far, we have detected gradients through visual inspection. In order to locate gradients in a more objective way, and to attempt to identify some that do not meet the theoretical expectations of coherence or smoothness, in what follows we will adopt Fourier techniques to study normal (or weakly barred) spirals.
2 Photometric data.
Our data consist of deep photometric images of the 13 SA and SAB spirals444 NGC 578, NGC 918, NGC 1417, NGC 1421, NGC 3162, NGC 3938, NGC 4254, NGC 4939, NGC 5371, NGC 6951, NGC 7125, NGC 7126, and NGC 7753. As argued in Martínez-García et al. (2009a), NGC 578 is peculiar, in the sense that it is the only object in the sample whose arms may end at CR and not at the outer Lindblad resonance (OLR). We also caution the reader that NGC 1421 is seen nearly edge-on, with an inclination angle . described in Martínez-García et al. (2009a). The data include mosaics in the optical , , and bands (Thuan & Gunn, 1976; Wade et al., 1979, see Table 1), the near-infrared (NIR) band, and the NIR , , or filters. We have now added six new objects,555NGC 1703 (type SB), NGC 3001 (SAB), NGC 3338 (SA), NGC 4603 (SA), NGC 6907 (SB), and NGC 7083 (SA). All galaxy types are taken from the Third Reference Catalogue of Bright Galaxies (RC3, de Vaucouleurs et al., 1991). whose observation log is shown in Table 2. NGC 1703 and NGC 6907, classified as SB by RC3, were included in the analysis because (apparently) they have no prominent bar structure, as appreciated in the images. The data were reduced and calibrated with the same standard procedures used in Martínez-García et al. (2009a), and Martínez-García & González-Lópezlira (2011). The optical (, , and ) calibration was done in the Thuan-Gunn system (Thuan & Gunn, 1976; Wade et al., 1979). The zero point of this photometric system is chosen such that the standard star BD+174708 has mag. The NIR data were calibrated with images from the Two Micron All Sky Survey (2MASS; Skrutskie et al., 2006).
| Filter | FWHM | |
|---|---|---|
| 5000ÅÅ | 830ÅÅ | |
| 6800ÅÅ | 1330ÅÅ | |
| 7800ÅÅ | 1420ÅÅ | |
| 1.25µm | 0.29µm |
Note. — Columns 2 and 3: effective wavelengths and widths, respectively, of the filters mainly used for analysis.
| Object | Filter | Exposure (s) | Telescope | Date (month/year) | * Parameters |
|---|---|---|---|---|---|
| NGC 1703 | 5100 | CTIO 0.9 m | 3/94, 3/95 | Type: SB(r)b | |
| 4200 | ” | ” | PA (deg): 104aa Paturel et al. (2000). | ||
| 5400 | ” | ” | (deg): 27.0 12.1 | ||
| 2717 | CTIO 1.5 m | 2/94 | (km s-1): 55 20 | ||
| 1281 | ” | ” | Dist (Mpc): 20.4 1.7 | ||
| 2758 | ” | ” | |||
| NGC 3001 | 4500 | CTIO 0.9 m | 3/94, 3/95 | Type: SAB(rs)bc | |
| 5100 | ” | ” | PA (deg): 6 | ||
| 4500 | ” | ” | (deg): 47.5 4.9 | ||
| 2718 | CTIO 1.5 m | 2/94 | (km s-1): 248 20 | ||
| 2700 | ” | ” | Dist (Mpc): 35.6 3.0 | ||
| NGC 3338 | 3600 | Lick 1 m | 4/94, 11/94 | Type: SA(s)c | |
| 4500 | ” | ” | PA (deg): 100 | ||
| 4200 | ” | 2/94, 4/94, 11/94 | (deg): 51.9 2.1 | ||
| 1200 | Lick 1 m | 12/94, 2/95 | (km s-1): 194 9 | ||
| 1002 | Kitt Peak 1.3 m | 3/94, 11/94 | Dist (Mpc): 23.7 2.1 | ||
| 926 | ” | ” | |||
| NGC 4603 | 5400 | CTIO 0.9 m | 3/94, 3/95 | Type: SA(s)c | |
| 4500 | ” | ” | PA (deg): 27 | ||
| 4200 | ” | ” | (deg): 43.6 5.7 | ||
| 1393 | CTIO 1.5 m | 2/94 | (km s-1): 242 32 | ||
| 1399 | ” | ” | Dist (Mpc): 29.4 2.6 | ||
| NGC 6907 | 3600 | CTIO 0.9 m | 9/94 | Type: SB(s)bc | |
| 3900 | ” | ” | PA (deg): 46 | ||
| 3600 | ” | ” | (deg): 35.6 3.7 | ||
| 570 | CTIO 1.5 m | 9/94, 9/95 | (km s-1): 244 41 | ||
| 355 | ” | ” | Dist (Mpc): 47.7 4.1 | ||
| NGC 7083 | 3600 | CTIO 0.9 m | 9/94 | Type: SA(s)bc | |
| 3900 | ” | ” | PA (deg): 5 | ||
| 3900 | ” | ” | (deg): 52.9 3.0 | ||
| 840 | CTIO 1.5 m | 9/94 | (km s-1): 226 10 | ||
| 392 | ” | ” | Dist (Mpc): 45.4 3.9 |
Note. — Column 6-galaxy parameters: Hubble types from the RC3; P.A.: position angles from RC3; inclination angle, , where is the isophotal diameter ratio derived from the parameter in RC3; : galactic rotation velocity obtained from the HI data of Paturel et al. (2003), corrected for inclination; dist: Hubble distance obtained from the RC3 heliocentric radial velocity and the infall model of Mould et al. (2000), km s-1 Mpc-1.
3 Structural type of the spiral arms
The DW theory predicts the existence of age gradients across spiral arms. Multi-armed or flocculent galaxies, however, are not described by this theory. The short arms of the latter are probably unbound star complexes sheared by galactic differential rotation, whereas the “knee-like”666Consisting of straight fragments that join at angles of roughly . shaped arms of M101-type galaxies might be formed by the gravitational instability of galactic disks; if so, they are transient features (Clarke & Gittins, 2006; Dobbs & Bonnell, 2008). The azimuthal profiles (intensity versus ) of such arms should be symmetric about the gravitational potential well, where the gas is yet to be transformed into stars; this configuration is indeed sometimes observed in certain galaxies (for example, in NGC 4535 and M61, a narrow dark lane is seen right at the center of a stellar arm).
To analyze the validity of the DW theory, one should study galaxies whose structure is likely to be explained by it. Mainly, from the point of view of their spiral arms, there are three different types of galaxies (e.g., Efremov, 2011). These are (1) symmetric grand-design spirals (e.g., M81), with mass arms due to DWs; (2) multi-armed or “knee-like” spirals (e.g., M101); and (3) flocculent spiral galaxies (e.g., NGC 2841). However, even in the same galaxy, different arms may be formed by different mechanisms. Thus, in the classical multi-armed galaxy M101 the inner arms are rather regular, and in our own Galaxy the quite symmetrical inner arms transform into a polygonal multi-armed structure in the outer regions (Efremov, 2011). Albeit flocculent and multi-armed structures have a low mass-to-light ratio () and are seen mainly in the optical (see, for example, the classical example of NGC 309 in Block et al. 1994), in order to determine whether the arms in the NIR are indeed mass DWs it is important to disentangle the contribution of young stars and clusters at these longer wavelengths; such contribution can reach up to 20%-30% (e.g., Rix & Rieke 1993; GG96; Rhoads 1998; James & Seigar 1999; Patsis et al. 2001; Grosbøl et al. 2006). With the aim of determining the actual structural type of the spiral arms, resolved stellar mass maps are required. Mass maps get around the problem that the , at any wavelength, is not constant across the disk and near spiral arms.
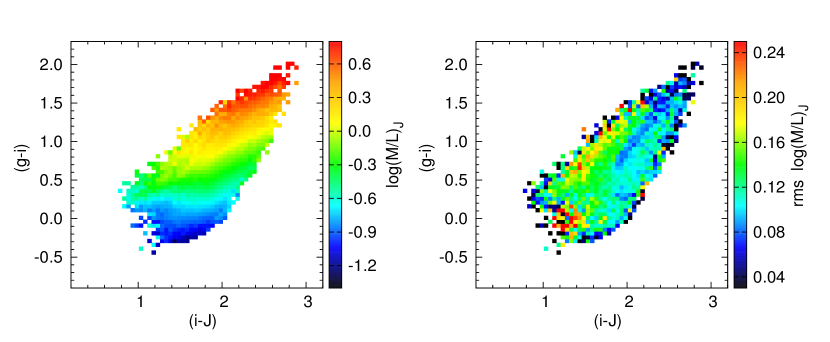
In order to build resolved maps of stellar mass of our sample galaxies, we use the method of Zibetti et al. (2009). The method relies on a Monte Carlo library of 50,000 stellar population spectra, constructed from the SPS models of Bruzual & Charlot (2003), and Charlot & Bruzual (2007, private communication). Each spectrum is computed by randomly drawing the model parameters (star formation history, metallicity, and dust attenuation777Treated as prescribed in the two-component dust model of Charlot & Fall (2000).) from adequate physical distributions (see also da Cunha et al., 2008). We use the “MAGPHYS” code888http://www.iap.fr/magphys/magphys/MAGPHYS.html. of da Cunha et al. (2008) to extract colors from the spectral library. Each element in a theoretical two-dimensional color-color plot can be produced by several combinations of model parameters. The median of all these combinations is then found, and attributed to the data with the same position in the observed two-dimensional color-color plot. Resolution elements in two-dimensional color space (in our case, versus ) have a size of mag2, in order to account for the observational error. We compute the median in the -band (see Figure 2), and compare the resulting distributions with the colors obtained from the observations,999 All images are treated with the adaptive smoothing code “ADAPTSMOOTH”, developed by Stefano Zibetti (Zibetti, 2009), and available at the URL http://www.arcetri.astro.it/zibetti/Software/ ADAPTSMOOTH.html The code enhances the S/N with a minimum loss of effective resolution, and keeps the photometric fluxes unaltered. The models are reddened before comparing with the observations, to take into account foreground Galactic extinction (Schlegel et al., 1998). on a pixel-by-pixel basis. This comparison produces a resolved map of . Finally, a relative “mass map” is obtained, equal to the product of the map by the -band image. Absolute mass maps can be worked out, taking into account the distance to the galaxies, but are not necessary for our purposes.
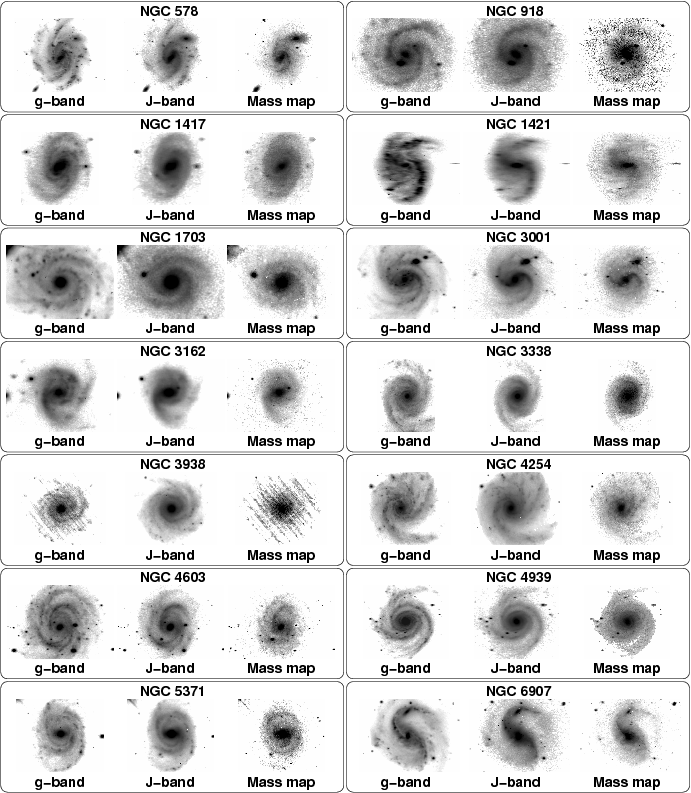
The results are shown in Figures 3 and 4, where we compare the and frames with the mass maps at the same relative scale. We then proceed to select the objects in our sample that retain a spiral structure that may be explained by the DW theory. From this visual101010 Future works will include a more objective selection procedure. inspection we reject the following objects prior to the Fourier analysis:
-
1.
NGC 3162. There is no two-armed spiral structure appreciable in the mass map.
-
2.
NGC 3938. The mass map has a very low quality, due to a low signal-to-noise ratio (S/N) of the -band mosaic.
-
3.
NGC 5371. Ring structures rather than spirals are discerned in the mass map.
-
4.
NGC 7083. The spiral structure looks flocculent in the mass map.
-
5.
NGC 7126. No clear spirals can be appreciated in the mass map.
-
6.
NGC 7753. Spiral structure is not observed in the mass map.
The remaining 13 objects were analyzed as described below.
4 Fourier analysis of the gradients.
4.1 Azimuthal Index Analysis.
The first step in our Fourier analysis consists in generating mosaics, following the method of GG96. is defined as follows:
| (1) |
where is the color excess term. This photometric index is reddening-free for screen absorption, and also for a mixture of dust and stars, as long as . At the same time, is sensitive to supergiant stars, and therefore traces star formation. SPS models (Bruzual & Charlot, 2003) predict that, following a continuous burst of star formation that lasts for yr, the index increases its value during yr and then starts to decline (cf., GG96; Martínez-García et al., 2009a).111111These models were computed for a mixture of young ( by mass) and old stars (with an age of yr). Both populations have solar metallicity and a Salpeter initial mass function (IMF), with 0.1 , and 10 . The choice of is justified by the observed inverse correlation between the locations where color gradients are detected, and those with important emission (GG96; Martínez-García et al., 2009a; Martínez-García & González-Lópezlira, 2011). mosaics of our sample were transformed to polar coordinates.121212 vs. ln ; logarithmic arms appear as straight lines in such a map, with slope , where is the arm pitch angle. Spiral arms were then “straightened”, by adding to the coordinate a phase as a function of , until the arms appear horizontal. Unlike our previous studies, where the “straightening slope” was different depending on the specific arm and region under analysis, here we adopt the same “straightening slope” for both (or all the) arms in the same object. For each galaxy, this slope is obtained from the median of the pitch angles measured in different wavelengths (see Section 5.1 and Table 5).131313 We define the median pitch angle for each object by arranging the angles in , , , and from the lowest to the highest value, and averaging together the two middle values.
We divide the “straightened” images in vertical sections, equivalent to concentric annuli in a deprojected image of the galaxy, in order to perform a Fourier analysis.141414 We ran some tests that demonstrate that the results are independent of the width of the annuli. Widths were chosen to be the same as in Martínez-García et al. (2009a). Here we aim to compare the observed index profiles with the SPS models adopting Fourier techniques. SPS models give as a function of age, , while observations provide versus azimuthal angle (or azimuthal distance after assuming a distance to the galaxy). The age gradient signal can be thought of as an asymmetric “pulse” (see Figure 5), whose width is a function of radius; the width approaches zero at CR and has larger values at smaller radii. The width of this pulse is analogous to a period, , of a sinusoidal signal. Hence, the pulse can also be characterized by its angular frequency , and analyzed with Fourier techniques.
We compute the Fourier transform of the index profiles in the annuli,
| (2) |
where
In general, is complex, say, of the form . The Fourier spectrum is obtained as . We search the spectrum for frequencies with amplitudes between 0.02 and 0.06 mag. This range of amplitudes corresponds to the ones achieved by the index of our models,151515 We consider two models in this analysis (see Figure 5). Model “A” is obtained with the SPS models only. Model “B” includes both the dissolution of stellar groups (Wielen, 1977) after 50 Myr, and stellar orbit diffusion. According to Wielen (1977), the diffusion of stellar orbits can enhance the dissolution of young stellar groups by increasing their internal velocity dispersion. including the photometric error of the observed profiles, . If more than one frequency is found, we then select the one with the highest frequency value.161616 In general, the lower frequency represents the overall shape of the profile, whereas higher frequencies correspond to small-scale structure.
The expected radial behavior of after applying the procedure to the MHD simulation of Martínez-García et al. (2009b) is shown in Figure 6, with a dotted line. We remind the reader that the simulation has a spiral pattern with a constant angular speed that does not depend on radius. The plot also shows (solid line) the behavior of when newborn stars move in perfectly circular orbits. In both cases, since the width of the pulse goes to zero at the CR radius, its reciprocal, , diverges there; .
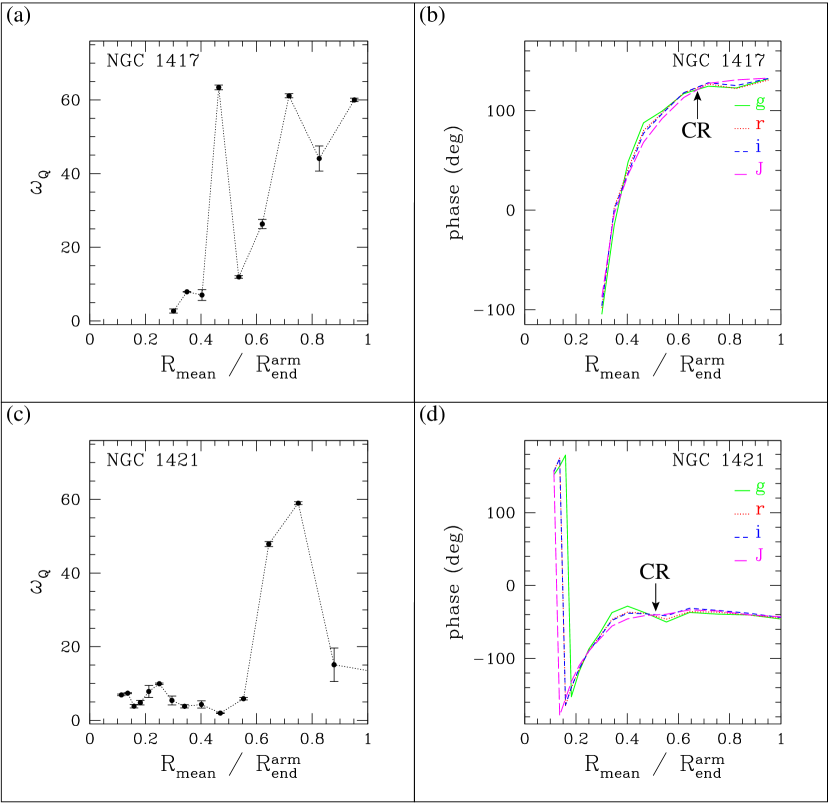
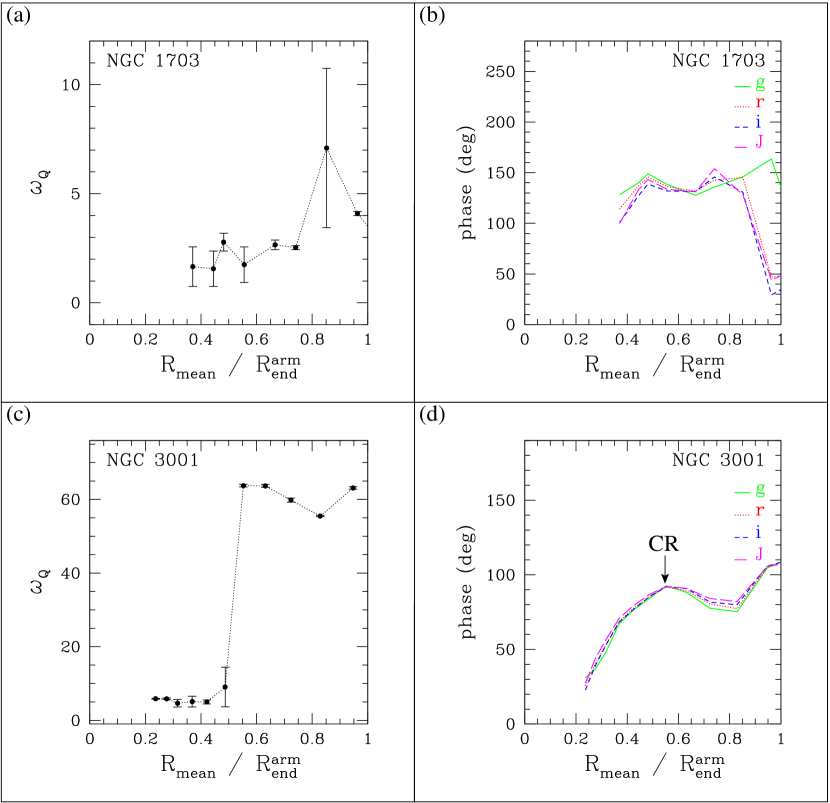
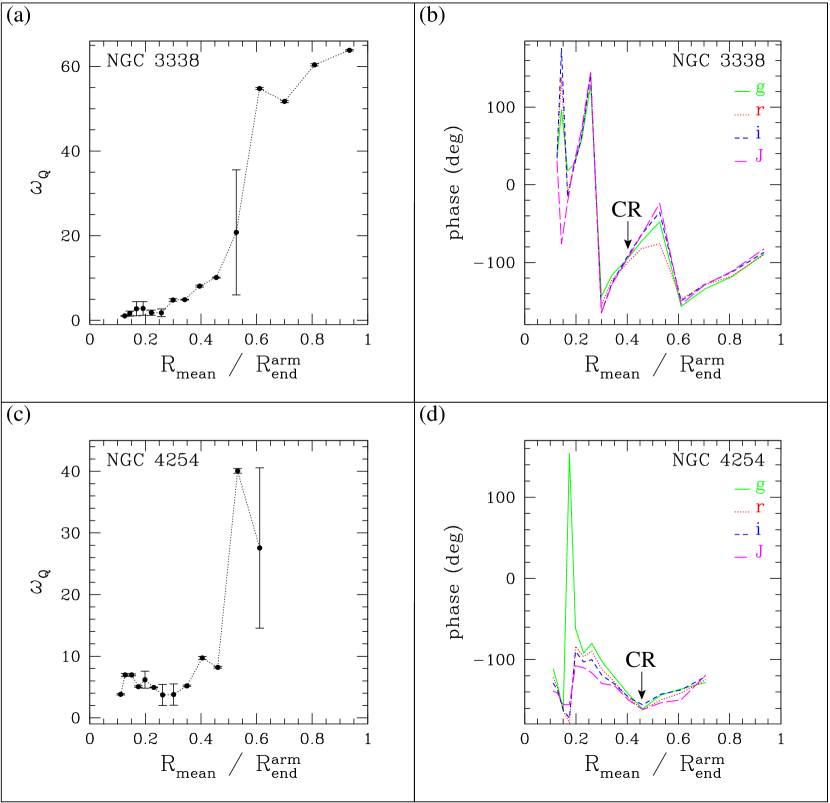
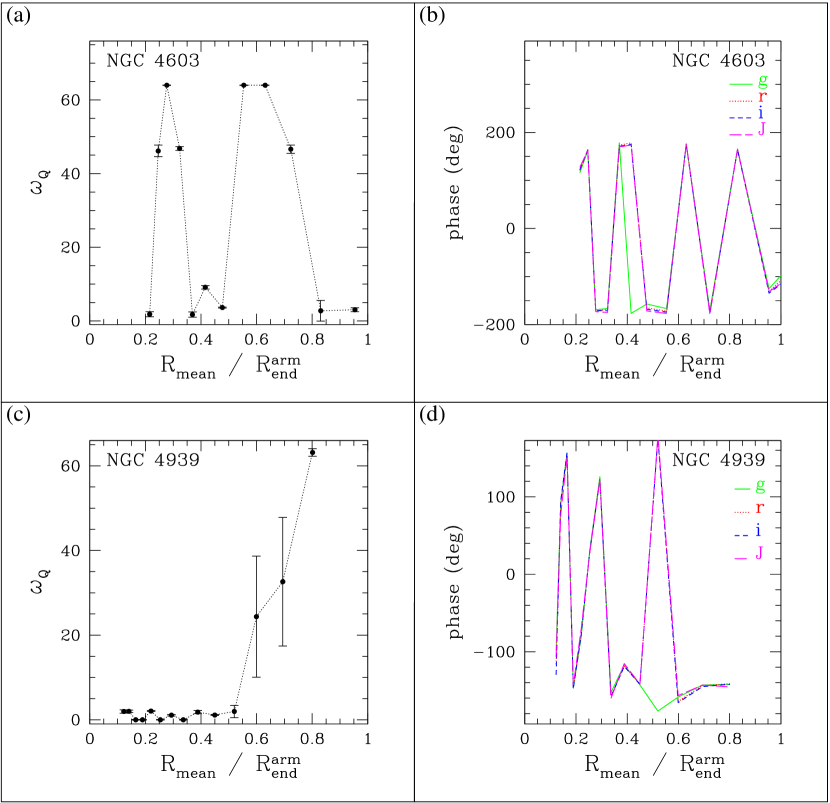
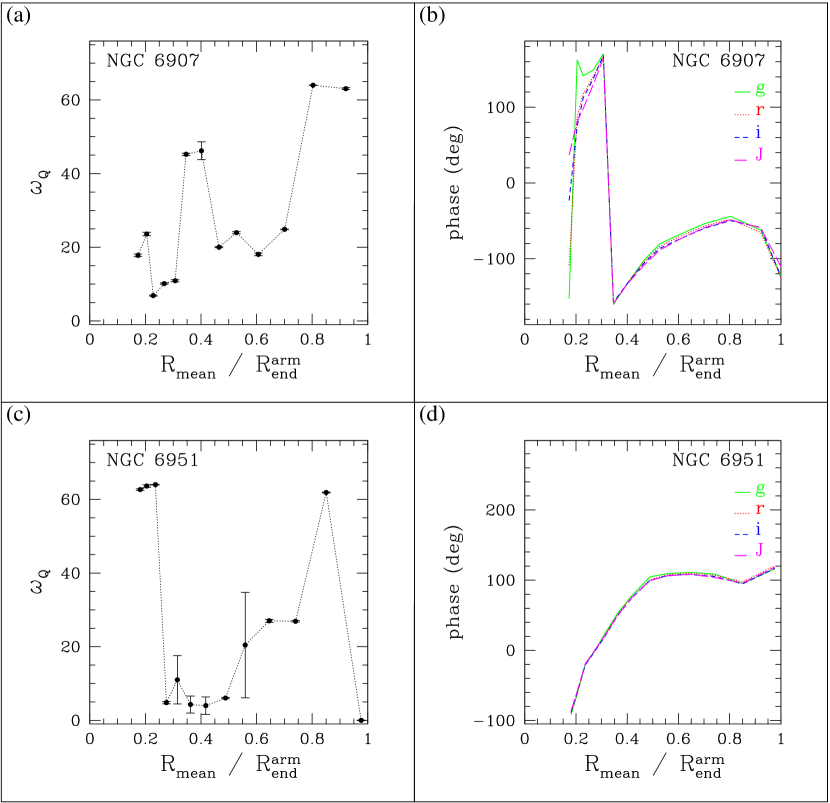
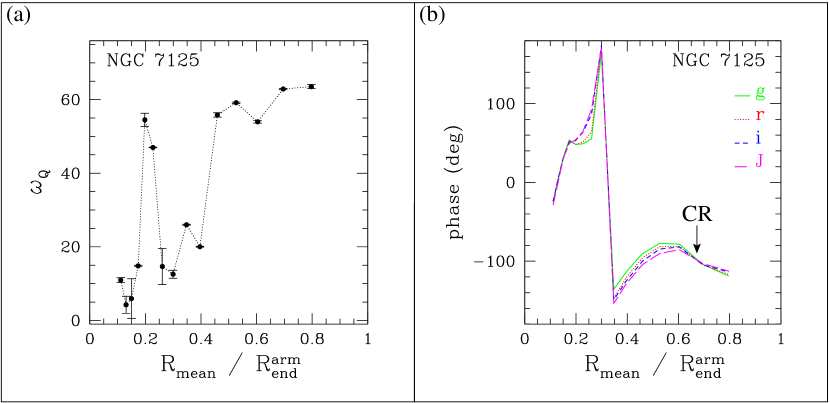
Figures 8 through 14, left panels, show the results of this analysis when applied to our sample of objects. Data values are graphed versus , where is the mean galactocentric radius, and is the spiral maximum radial extent. The latter is determined visually in the NIR band indicated in Table 3.
| Galaxy | (arcsec) | (kpc) |
|---|---|---|
| NGC 578 | 95.7 2.9 () | 10.5 0.9 |
| NGC 918 | 75.4 5.8 () | 7.9 0.7 |
| NGC 1417 | 60.0 5.0 () | 16.6 1.4 |
| NGC 1421 | 92.8 2.9 () | 13.2 1.1 |
| NGC 1703 | 27.5 1.4 () | 2.7 0.3 |
| NGC 3001 | 44.0 2.8 () | 7.6 0.8 |
| NGC 3338 | 145.0 5.0 () | 16.7 1.6 |
| NGC 4254 | 157.5 7.5 () | 12.6 0.8 |
| NGC 4603 | 45.4 1.4 () | 6.5 0.6 |
| NGC 4939 | 145.0 5.0 () | 32.7 2.8 |
| NGC 6907 | 55.1 2.9 () | 12.7 1.3 |
| NGC 6951 | 105.0 5.0 () | 12.7 1.1 |
| NGC 7125 | 95.7 2.9 () | 20.7 1.8 |
Note. — Columns 2 and 3: spiral radial maximum extent (determined visually), in arcsec and kpc, respectively, and bandpass used to determine it.
4.2 Azimuthal Phases of the , , , and Bands
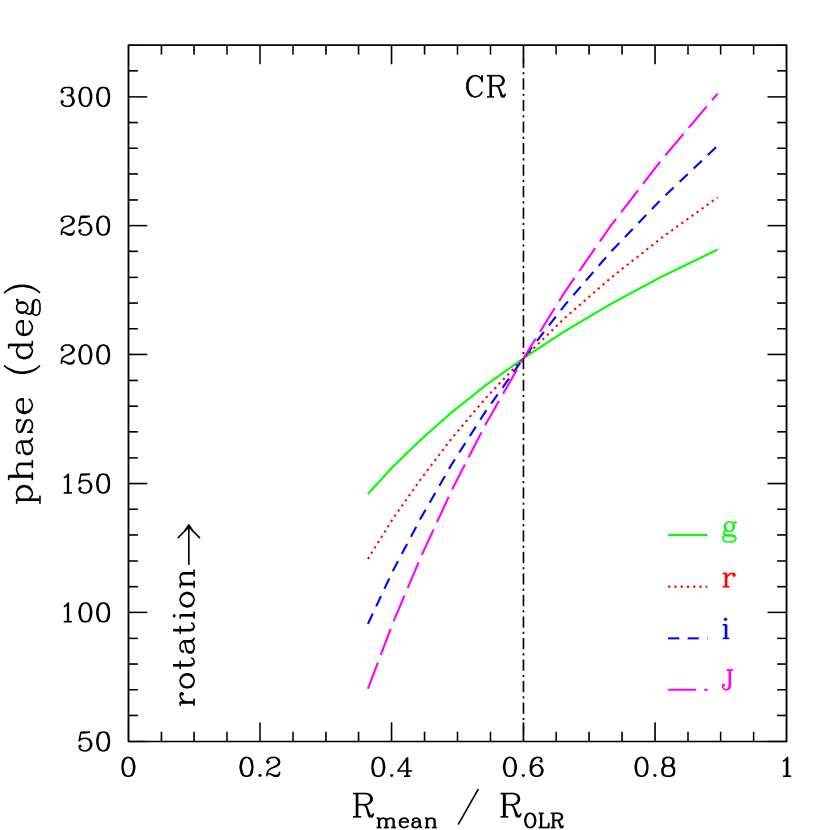
If DWs indeed produce shocks and induce star formation, we expect increasingly older stellar populations (with intensity peaks at longer wavelengths) to be sequentially located downstream (in the direction of rotation) from the shock position within CR, and to be sequentially placed upstream (opposite rotation) outside CR. No gradients should be observed at CR. We use also Fourier techniques to analyze our sample in a systematic manner, at all galactic radii, in search of this effect.
We adopt the method of Puerari & Dottori (1997) to determine the phases (basically, the conjugate of the azimuthal positions) of stellar populations of different ages, as traced in the , , , and bands. The method is based on computing the Fourier transform of the form
| (3) |
where is the intensity of radiation, and with phase
| (4) |
Given that we have selected objects with a strong two-armed pattern, . This means that 2 radians include two periods of the analyzed signal, i.e., there is a radian symmetry. Although this may not be exactly true for real arms in spirals (P. Grosbøl 2012, private communication), it is a very good approximation for our purposes. We analyze the same concentric annuli in the “straightened” images as before.
For the data analysis we assume all spirals in our sample trail, and hence that the spiral opens in the direction opposite rotation. Furthermore, we adopt the convention that the angular coordinate increases with rotation, regardless of whether the arms have an “S” or a “Z” on-the-sky view. Under these premises, for a wave of the form , where is the phase, should decrease with wavelength inside CR and increase outside CR. There should be no phase difference with wavelength at CR (see Figure 7). The results of this exercise are shown in Figures 8 through 14, right panels.
5 Discussion
For seven objects (NGC 918, NGC 1417, NGC 1421, NGC 3001, NGC 3338, NGC 4254, and NGC 7125, see Table 4), we find similarities between the theoretical expectations and the observations, regarding both the radial distribution of and the radial run of intensity phases with wavelength, at least for some range of radii. However, all the objects also show discrepancies. For example, in NGC 918, NGC 1417, NGC 1421, NGC 3338, NGC 4254, and NGC 7125, the phases of all four passbands overlap between 0.2 and 0.4 , but then behave in accordance to theory up to what is likely the CR radius, as judged by the position where diverges and where, again, phases are the same for all wavelengths. In NGC 918 and NGC 4254, phase differences agree with theory within CR, but then do not change direction. This could be due to a weaker spiral potential and, hence, weaker shocks at radii beyond CR. Conversely, in NGC 3001 the phases show the expected behavior only outside the CR position, if it is indeed located where the plot shows a clear divergence. The intensity phases in NGC 1703 (which may be an SB type galaxy) behave as predicted by theory, but does not diverge at the CR position expected from the phases.
From this analysis, there is not even one object for which both diagnostics agree perfectly with theory at all radii. These findings confirm more objectively a previous result from visual inspection: age/color textbook gradients that run coherently along entire arms and change direction at CR are very hard to detect in practice. Possible causes may be a low S/N of the data, or masking of the gradients by the intense and clumpy (continuum and line) radiation from massive star clusters. In the case of the intensity phases method, dusty environments can attenuate the shorter wavelengths, hindering the detection of an ordered age sequence.171717 This was the original motivation behind the development of the reddening-insensitive index . It is also possible that the gradients are perturbed by the “infant mortality” of star clusters (Lada & Lada, 2003), or by the destruction of an ordered age front by supernovae shocks and stellar winds (Mueller & Arnett, 1976; Gerola & Seiden, 1978). On the other hand, even in the presence of DWs, it is possible that no gradients are produced. For example, there may be inadequate physical conditions for the creation of the gradients, related to the strengths of the shock or of the magnetic field (Efremov, 2010). There is, of course, the possibility that a real constant pattern speed for all radii does not exist, i.e., that the spiral structure is not explained by the DW theory. Our subsample, however, was selected explicitly to minimize this eventuality. Furthermore, we had previously established the link of the gradients in the sample, taken as an ensemble, to disk dynamics. As confirmed by the comparison with an MHD simulation with a constant spiral pattern speed, an apparent radial dependency of is caused by neglecting non-circular streaming motions in the analysis of the gradients.
Conversely, there could be color gradients that are not linked to the dynamics of the disk. One speculative scenario is provided by the IGIMF (the Integrated Galaxial IGIMF) theory of Pflamm-Altenburg & Kroupa (2008) and Pflamm-Altenburg et al. (2009). This theory is able to explain the H cutoff in galaxy disks without a corresponding cutoff in star formation (as deduced from the non-ionizing far-ultraviolet flux given out by B-type stars). The IGIMF theory posits that maximum star cluster mass depends on gas surface density (or, equivalently, on star formation rate),181818This has been corroborated by González-Lópezlira et al. (2012) in M33. and that maximum stellar mass depends on cluster mass. If this is indeed the case, one could obtain a color gradient from coeval star clusters across a region with a gas surface density gradient.
At any rate, a statistical analysis, tied to spiral dynamics, of color gradients in several objects is necessary to identify the gradients that are linked to DWs. This is even more important since by general rule gradients are painstakingly identified only in selected regions and not along entire arms.
It is, however, important to stress that our new results imply that long-lived modes seem to have produced gradients that run for a sizeable part of a spiral arm in at least of the analyzed objects. This is, in itself, remarkable.
For the rest of the objects (NGC 578, NGC 1703, NGC 4603, NGC 4939, NGC 6907, and NGC 6951), the Fourier methods failed to detect signs of gradients besides the ones that had already been identified by eye. It is interesting to point out, though, that NGC 4603 shows a multi-armed structure in the optical and NIR bands, although it was kept in the sample because of its two-armed structure in the mass map. For NGC 6951 (type SAB in the RC3) and NGC 6907 (type SB in the RC3), the CR radius may lie around . This is possibly an indication of color gradients within the bar region, as already found in Martínez-García & González-Lópezlira (2011).
We find no relation between Hubble type and success rate in our Fourier tests.
| Galaxy | (arcsec) | (kpc) | |
|---|---|---|---|
| NGC 918 | 0.63 | ||
| NGC 1417 | 0.67 | ||
| NGC 1421 | 0.49 | ||
| NGC 3001 | 0.55 | ||
| NGC 3338 | 0.38 | ||
| NGC 4254 | 0.46 | ||
| NGC 7125 | 0.67 |
Note. — Column 1: object with signatures of a radially extended azimuthal gradient. Column 2: corotation likely position, . The mean value for the six objects is . Columns 3, and 4: corotation radius, , in arcseconds and kiloparsecs, respectively.
5.1 Pitch Angles Test
As a complementary test of DW presence, we examine the pitch angles of the spiral arms in different wavebands (, , , and ), and in the “resolved mass maps” previously obtained with the method of Zibetti et al. (2009). As already mentioned in the introduction, according to Efremov (2010), age gradients are observed across arm segments that fulfill the conditions for a strong shock to occur. These segments seem to have an irregular magnetic field, while the regions with a regular magnetic field harbor instead weak shocks, and chains of star complexes with a nearly regular spacing. Strong shocks are associated with a larger pitch angle of the spiral segment.
Another prediction involving pitch angles in the DW theory paradigm comes from the local dispersion relation. At a fixed mass surface density, the pitch angle increases proportionally to the square of the velocity dispersion (see, e.g., Hozumi, 2003; Athanassoula et al., 2010; Martínez-García, 2012), that is, with the age of the stellar population and, hence, with image wavelength in the optical and NIR.
Pitch angles were measured with Fourier techniques (Considere & Athanassoula, 1982, 1988; Puerari & Dottori, 1992; Saraiva Schroeder et al., 1994; Davis et al., 2012; Savchenko, 2012), in the radial range where the spiral perturbation seems more prominent (see Table 5). This method assumes a logarithmic geometry for the spirals, although this might not be the case for all objects at all radii (Ringermacher & Mead, 2009).
Figure 15 shows histograms of - , where is the pitch angle and can be , , , or “mass”, depending on the image where has been measured.191919 Absolute values from Table 5 were adopted for analysis. However, values were discarded if their sign does not agree with that of . (Signs indicate whether the galaxy has an “S” or a “Z” on-the-sky view.) The pitch angles measured for NGC 578 with the Fourier method were also rejected, since their nominal sign is at odds with the observed on-the-sky view. Negative values of the differences indicate that the pitch angle is larger in the NIR than in the optical. In the histograms of , , and , there are indeed more objects with negative differences. The median values of each histogram are, respectively, -0.9, -1.1, and 0.0. This result is in agreement with Grosbøl & Patsis (1998), who find tighter arms in bluer colors in images of four spirals, suggesting the presence of DWs.
Interestingly, the median value of the histogram is 2.2, so that the mass arms are statistically more open than the arms in NIR light. An inspection of the mass maps indicates that the spiral arms loci in the NIR images do not always coincide with the location of the arms in the mass maps (see Figures 3 and 4), a fact that can be explained by the contribution of young stars to the NIR light.
Finally, we compare the median pitch angle distribution in those galaxies that we have classified as having radially extended azimuthal color gradients, against the distribution in the galaxies where we have detected localized gradients only. Figure 16 displays the pitch angle histograms for each data set. The statistical significance is low, due to the small number of objects, but the objects with signs of widespread color gradients may have more open spiral arms (larger pitch angles).
| Galaxy | (arcsec) | “Median” | |||||
|---|---|---|---|---|---|---|---|
| NGC 578 | (20.3-63.8) | -34.70 (=2) | -35.72 (=2) | -37.92 (=2) | -41.68 (=2) | -49.45 (=2) | 40.97aaComputed by fitting the arms’ slope in the vs. ln polar image (see, e.g., Martínez-García, 2012). The Fourier method yields a “Z” on-the-sky view, but the object actually has an “S” view. |
| NGC 918 | (18.6-57.2) | 20.60 (=2) | 21.77 (=2) | 22.63 (=2) | 23.54 (=2) | 29.42 (=2) | 22.20 |
| NGC 1417 | (20.0-60.0) | 36.82 (=2) | 33.76 (=2) | 36.82 (=2) | 41.71 (=2) | 39.13 (=2) | 36.82 |
| NGC 1421 | (34.4-91.6) | 36.17 (=2) | 37.17 (=2) | 38.21 (=2) | 39.31 (=2) | -81.66 (=2) | 37.69 |
| NGC 1703 | (12.4-27.5) | 16.55 (=2) | 16.29 (=2) | 15.79 (=2) | -36.16 (=1) | -55.62 (=2) | 16.04 |
| NGC 3001 | (19.2-44.0) | 31.55 (=2) | 31.55 (=2) | 32.45 (=2) | 32.45 (=2) | 34.40 (=2) | 32.00 |
| NGC 3338 | (45.0-145.0) | -13.43 (=2) | -13.60 (=2) | -13.77 (=2) | -13.77 (=2) | 83.87 (=2) | -13.68 |
| NGC 4254 | (30.0-157.5) | -29.30 (=3) | 18.13 (=1) | -29.30 (=3) | -29.30 (=3) | 22.62 (=1) | -29.30 |
| NGC 4603 | (13.8-45.4) | 25.61 (=2) | 26.87 (=2) | 27.54 (=2) | 28.25 (=2) | 30.59 (=2) | 27.20 |
| NGC 4939 | (50.0-145.0) | 10.96 (=2) | 11.07 (=2) | 11.07 (=2) | 10.74 (=2) | 29.89 (=3) | 11.02 |
| NGC 6907 | (34.8-55.1) | 24.89 (=2) | 24.34 (=2) | 27.34 (=2) | 27.34 (=2) | 45.15 (=2) | 26.12 |
| NGC 6951 | (45.0-105.0) | -31.48 (=2) | -33.26 (=2) | -32.35 (=2) | -34.23 (=2) | -36.30 (=2) | -32.80 |
| NGC 7125 | (20.3-95.7) | -23.88 (=2) | -26.76 (=2) | -35.99 (=2) | -40.84 (=2) | -52.36 (=2) | -31.38 |
Note. — Column 1: analyzed object. Column 2: radial ranges where the spiral seems more prominent, in arcseconds. Columns 3-6: pitch angles, in degrees, for the , , , and bands, respectively. Negative values indicate a “Z” on-the-sky view for the object, while positive values indicate an “S” on-the-sky view. Absolute values were adopted for analysis. The mean error is (without taking into account the error due to the deprojection parameters). The dominant Fourier mode, , is indicated in parenthesis. Column 7: pitch angle, in degrees, for the resolved maps of stellar mass surface density (“mass map”, Zibetti et al., 2009). Column 8: median pitch angle, in degrees, adopted to “straighten” the spiral arms (see Section 4.1). We define the median pitch angle for each object by arranging the , , , and values from lowest to highest, and averaging together the two middle values.
6 Conclusions
From a Fourier analysis of 13 objects, with a spiral arm structure that can be likely explained by DW theory, we find that of them show evidence of color gradients that run for at least a range of radii. For the remaining objects, the evidence of extended gradients is insufficient. This notwithstanding, our previous studies (González & Graham, 1996; Martínez-García et al., 2009a, b; Martínez-García & González-Lópezlira, 2011) suggest that azimuthal age/color gradients (or candidates) can be found for most galaxies, at least in some regions of the spiral arms. A relation of such very localized gradients with the dynamics of the disk has been previously established by the comparison with an MHD simulation with a constant pattern speed at all radii (Martínez-García et al., 2009b).
Our results are consistent with other observational studies of age patterns (or offsets) across spiral arms (Efremov, 1985; Tamburro et al., 2008; Egusa et al., 2009; Grosbøl & Dottori, 2009; Sánchez-Gil et al., 2011). By means of an H to far-UV flux ratio method, Sánchez-Gil et al. (2011) found age gradients across the spiral arms of the grand-design spirals M74 and M100 (NGC 628 and NGC 4321, respectively). Likewise, the “breaks” in the radial metallicity distribution found near CR in a sample of 20 galaxies by Scarano et al. (2011) and Scarano & Lépine (2013) imply that spiral arms must be long-lived structures. A dominant pattern speed must exist with a unique CR radius, or otherwise any discontinuities in the radial metallicity profiles would be smoothed out (Scarano & Lépine, 2013).
On the other hand, simulations have shown mutually exclusive results. Long-lived quasi-steady features have been obtained for some models (e.g., Donner & Thomasson, 1994; Zhang, 1998). Other works, however (e.g., Sellwood, 2011; Wada et al., 2011; Fujii et al., 2011), have found a lack of a persistent pattern, and instead recurrent short-lived transient spirals only.
Any model that intends to explain spiral structure has to avoid the winding dilemma, that ultimately led to the idea of stationary DWs with a fixed pattern speed for all radii. For this same reason, the observational results of Merrifield et al. (2006) and Meidt et al. (2009) for some objects, where decreases with radius, imply the existence of transient spiral modes that emerge and disappear at different stages in the disk evolution. Such transient arms cannot produce stellar age/color gradients, though.
A theory that reconciles the existence of age/color gradients with a radially varying pattern speed is still missing. However, as argued in Section 1.1, the observation of a pattern speed that varies with radius may be an artifact produced by the non-circular streaming motions of the stars newly born in shocked material. This effect can explain the coexistence of azimuthal age/color gradients across spiral arms, and of a spiral pattern speed that seems to vary with radius in the same way as the orbital frequency .
References
- Arzoumanian et al. (2011) Arzoumanian, D., André, P., Didelon, P., et al. 2011, A&A, 529, L6
- Athanassoula et al. (2010) Athanassoula, E., Romero-Gómez, M., Bosma, A., & Masdemont, J. J. 2010, MNRAS, 407, 1433
- Block et al. (1994) Block, D. L., Bertin, G., Stockton, A., et al. 1994, A&A, 288, 365
- Bruzual & Charlot (2003) Bruzual, G., & Charlot, S. 2003, MNRAS, 344, 1000
- Clarke & Gittins (2006) Clarke, C., & Gittins, D. 2006, MNRAS, 371, 530
- Charlot & Fall (2000) Charlot, S., & Fall, S. M. 2000, ApJ, 539, 718
- Considere & Athanassoula (1982) Considere, S., & Athanassoula, E. 1982, A&A, 111, 28
- Considere & Athanassoula (1988) Considere, S., & Athanassoula, E. 1988, A&AS, 76, 365
- da Cunha et al. (2008) da Cunha, E., Charlot, S., & Elbaz, D. 2008, MNRAS, 388, 1595
- Davis et al. (2012) Davis, B. L., Berrier, J. C., Shields, D. W., et al. 2012, ApJS, 199, 33
- de Vaucouleurs et al. (1991) de Vaucouleurs, G., de Vaucouleurs, A., Corwin, H. G., Jr., et al. 1991, Third Reference Catalogue of Bright Galaxies. (Berlin: Springer), (RC3)
- Dobbs & Bonnell (2008) Dobbs, C. L., & Bonnell, I. A. 2008, MNRAS, 385, 1893
- Dobbs & Price (2008) Dobbs, C. L., & Price, D. J. 2008, MNRAS, 383, 497
- Donner & Thomasson (1994) Donner, K. J., & Thomasson, M. 1994, A&A, 290, 785
- Efremov (1985) Efremov, Y. N. 1985, Soviet Astronomy Letters, 11, 69
- Efremov (2010) Efremov, Y. N. 2010, MNRAS, 405, 1531
- Efremov (2011) Efremov, Y. N. 2011, Astronomy Reports, 55, 108
- Egusa et al. (2009) Egusa, F., Kohno, K., Sofue, Y., Nakanishi, H., & Komugi, S. 2009, ApJ, 697, 1870
- Ferreras et al. (2012) Ferreras, I., Cropper, M., Kawata, D., Page, M., & Hoversten, E. A. 2012, MNRAS, 424, 1636
- Foyle et al. (2011) Foyle, K., Rix, H.-W., Dobbs, C. L., Leroy, A. K., & Walter, F. 2011, ApJ, 735, 101
- Fujii et al. (2011) Fujii, M. S., Baba, J., Saitoh, T. R., et al. 2011, ApJ, 730, 109
- Gerola & Seiden (1978) Gerola, H., & Seiden, P. E. 1978, ApJ, 223, 129
- Gittins & Clarke (2004) Gittins, D. M., & Clarke, C. J. 2004, MNRAS, 349, 909
- Goodwin & Bastian (2006) Goodwin, S. P., & Bastian, N. 2006, MNRAS, 373, 752
- González & Graham (1996) González, R. A., & Graham, J. R. 1996, ApJ, 460, 651 (GG96)
- González-Lópezlira et al. (2012) González-Lópezlira, R. A., Pflamm-Altenburg, J., & Kroupa, P. 2012, ApJ, 761, 124
- Grand et al. (2012a) Grand, R. J. J., Kawata, D., & Cropper, M. 2012a, MNRAS, 421, 1529
- Grand et al. (2012b) Grand, R. J. J., Kawata, D., & Cropper, M. 2012b, MNRAS, 426, 167
- Grosbøl & Patsis (1998) Grosbøl, P. J., & Patsis, P. A. 1998, A&A, 336, 840
- Grosbøl & Dottori (2009) Grosbøl, P., & Dottori, H. 2009, A&A, 499, L21
- Grosbøl et al. (2006) Grosbøl, P., Dottori, H., & Gredel, R. 2006, A&A, 453, L25
- Hozumi (2003) Hozumi, S. 2003, in Galaxies and Chaos, ed. G. Contopoulos & N. Voglis (Lecture Notes in Physics, Vol. 626; Berlin: Springer), 380
- James & Seigar (1999) James, P. A., & Seigar, M. S. 1999, A&A, 350, 791
- Lada & Lada (2003) Lada, C. J., & Lada, E. A. 2003, ARA&A, 41, 57
- Lin & Shu (1964) Lin, C. C., & Shu, F. H. 1964, ApJ, 140, 646
- Lindblad (1963) Lindblad, B. 1963, Stockholms Observatoriums Annaler, 22, 5
- Martínez-García et al. (2009a) Martínez-García, E. E., González-Lópezlira, R. A., & Bruzual-A, G. 2009a, ApJ, 694, 512
- Martínez-García et al. (2009b) Martínez-García, E. E., González-Lópezlira, R. A., & Gómez, G. C. 2009b, ApJ, 707, 1650
- Martínez-García & González-Lópezlira (2011) Martínez-García, E. E., & González-Lópezlira, R. A. 2011, ApJ, 734, 122
- Martínez-García (2012) Martínez-García, E. E. 2012, ApJ, 744, 92
- Meidt et al. (2009) Meidt, S. E., Rand, R. J., & Merrifield, M. R. 2009, ApJ, 702, 277
- Merrifield et al. (2006) Merrifield, M. R., Rand, R. J., & Meidt, S. E. 2006, MNRAS, 366, L17
- Mould et al. (2000) Mould, J. R. et al. 2000, ApJ, 529, 786
- Mueller & Arnett (1976) Mueller, M. W., & Arnett, W. D. 1976, ApJ, 210, 670
- Patsis et al. (2001) Patsis, P. A., Héraudeau, P., & Grosbøl, P. 2001, A&A, 370, 875
- Paturel et al. (2000) Paturel, G., Fang, Y., Petit, C., Garnier, R., & Rousseau, J. 2000, A&AS, 146, 19
- Paturel et al. (2003) Paturel, G., Theureau, G., Bottinelli, L., Gouguenheim, L., Coudreau-Durand, N., Hallet, N., Petit, C. 2003, A&A, 412, 57
- Pflamm-Altenburg & Kroupa (2008) Pflamm-Altenburg, J., & Kroupa, P. 2008, Nature, 455, 641
- Pflamm-Altenburg et al. (2009) Pflamm-Altenburg, J., Weidner, C., & Kroupa, P. 2009, MNRAS, 395, 394
- Pilbratt et al. (2010) Pilbratt, G. L., Riedinger, J. R., Passvogel, T., et al. 2010, A&A, 518, L1
- Puerari & Dottori (1992) Puerari, I., & Dottori, H. A. 1992, A&AS, 93, 469
- Puerari & Dottori (1997) Puerari, I., & Dottori, H. 1997, ApJ, 476, L73
- Rix & Rieke (1993) Rix, H.W., & Rieke, M. J. 1993, ApJ, 418, 123
- Rhoads (1998) Rhoads, J. E. 1998, AJ, 115, 472
- Roberts (1969) Roberts, W. W. 1969, ApJ, 158, 123
- Roca-Fàbrega et al. (2013) Roca-Fàbrega, S., Valenzuela, O., Figueras, F., et al. 2013, MNRAS, submitted
- Ringermacher & Mead (2009) Ringermacher, H. I., & Mead, L. R. 2009, MNRAS, 397, 164
- Sánchez-Gil et al. (2011) Sánchez-Gil, M. C., Jones, D. H., Pérez, E., et al. 2011, MNRAS, 415, 753
- Saraiva Schroeder et al. (1994) Saraiva Schroeder, M. F., Pastoriza, M. G., Kepler, S. O., & Puerari, I. 1994, A&AS, 108, 41
- Savchenko (2012) Savchenko, S. S. 2012, Astrophysical Bulletin, 67, 310
- Scarano et al. (2011) Scarano, S., Jr., Lépine, J. R. D., & Marcon-Uchida, M. M. 2011, MNRAS, 412, 1741
- Scarano & Lépine (2013) Scarano, S., & Lépine, J. R. D. 2013, MNRAS, 428, 625
- Schlegel et al. (1998) Schlegel, D. J., Finkbeiner, D. P., & Davis, M. 1998, ApJ, 500, 525
- Sellwood (2011) Sellwood, J. A. 2011, MNRAS, 410, 1637
- Speights & Westpfahl (2012) Speights, J. C., & Westpfahl, D. J. 2012, ApJ, 752, 52
- Skrutskie et al. (2006) Skrutskie, M. F., Cutri, R. M., Stiening, R., et al. 2006, AJ, 131, 1163
- Tamburro et al. (2008) Tamburro, D., Rix, H.-W., Walter, F., et al. 2008, AJ, 136, 2872
- Thuan & Gunn (1976) Thuan, T. X., Gunn, J. E. 1976, PASP, 88, 543
- Wada et al. (2011) Wada, K., Baba, J., & Saitoh, T. R. 2011, ApJ, 735, 1
- Wade et al. (1979) Wade, R. A., Hoessel, J. G., Elias, J. H., Huchra, J. P. 1979, PASP, 91, 35
- Wielen (1977) Wielen, R. 1977, A&A, 60, 263
- Zhang (1998) Zhang, X. 1998, ApJ, 499, 93
- Zibetti et al. (2009) Zibetti, S., Charlot, S., & Rix, H.-W. 2009, MNRAS, 400, 1181
- Zibetti (2009) Zibetti, S. 2009, arXiv:0911.4956