System size dependence of transverse momentum correlations at
62.4 and 200 GeV at the BNL Relativistic Heavy Ion Collider
L. Adamczyk
AGH University of Science and Technology, Cracow, Poland
J. K. Adkins
University of Kentucky, Lexington, Kentucky, 40506-0055, USA
G. Agakishiev
Joint Institute for Nuclear Research, Dubna, 141 980, Russia
M. M. Aggarwal
Panjab University, Chandigarh 160014, India
Z. Ahammed
Variable Energy Cyclotron Centre, Kolkata 700064, India
I. Alekseev
Alikhanov Institute for Theoretical and Experimental Physics, Moscow, Russia
J. Alford
Kent State University, Kent, Ohio 44242, USA
C. D. Anson
Ohio State University, Columbus, Ohio 43210, USA
A. Aparin
Joint Institute for Nuclear Research, Dubna, 141 980, Russia
D. Arkhipkin
Brookhaven National Laboratory, Upton, New York 11973, USA
E. Aschenauer
Brookhaven National Laboratory, Upton, New York 11973, USA
G. S. Averichev
Joint Institute for Nuclear Research, Dubna, 141 980, Russia
J. Balewski
Massachusetts Institute of Technology, Cambridge, MA 02139-4307, USA
A. Banerjee
Variable Energy Cyclotron Centre, Kolkata 700064, India
Z. Barnovska
Nuclear Physics Institute AS CR, 250 68 Řež/Prague, Czech Republic
D. R. Beavis
Brookhaven National Laboratory, Upton, New York 11973, USA
R. Bellwied
University of Houston, Houston, TX, 77204, USA
M. J. Betancourt
Massachusetts Institute of Technology, Cambridge, MA 02139-4307, USA
R. R. Betts
University of Illinois at Chicago, Chicago, Illinois 60607, USA
A. Bhasin
University of Jammu, Jammu 180001, India
A. K. Bhati
Panjab University, Chandigarh 160014, India
Bhattarai
University of Texas, Austin, Texas 78712, USA
H. Bichsel
University of Washington, Seattle, Washington 98195, USA
J. Bielcik
Czech Technical University in Prague, FNSPE, Prague, 115 19, Czech Republic
J. Bielcikova
Nuclear Physics Institute AS CR, 250 68 Řež/Prague, Czech Republic
L. C. Bland
Brookhaven National Laboratory, Upton, New York 11973, USA
I. G. Bordyuzhin
Alikhanov Institute for Theoretical and Experimental Physics, Moscow, Russia
W. Borowski
SUBATECH, Nantes, France
J. Bouchet
Kent State University, Kent, Ohio 44242, USA
A. V. Brandin
Moscow Engineering Physics Institute, Moscow Russia
S. G. Brovko
University of California, Davis, California 95616, USA
E. Bruna
Yale University, New Haven, Connecticut 06520, USA
S. Bültmann
Old Dominion University, Norfolk, VA, 23529, USA
I. Bunzarov
Joint Institute for Nuclear Research, Dubna, 141 980, Russia
T. P. Burton
Brookhaven National Laboratory, Upton, New York 11973, USA
J. Butterworth
Rice University, Houston, Texas 77251, USA
X. Z. Cai
Shanghai Institute of Applied Physics, Shanghai 201800, China
H. Caines
Yale University, New Haven, Connecticut 06520, USA
M. Calderón de la Barca Sánchez
University of California, Davis, California 95616, USA
D. Cebra
University of California, Davis, California 95616, USA
R. Cendejas
Pennsylvania State University, University Park, Pennsylvania 16802, USA
M. C. Cervantes
Texas A&M University, College Station, Texas 77843, USA
P. Chaloupka
Czech Technical University in Prague, FNSPE, Prague, 115 19, Czech Republic
Z. Chang
Texas A&M University, College Station, Texas 77843, USA
S. Chattopadhyay
Variable Energy Cyclotron Centre, Kolkata 700064, India
H. F. Chen
University of Science & Technology of China, Hefei 230026, China
J. H. Chen
Shanghai Institute of Applied Physics, Shanghai 201800, China
J. Y. Chen
Central China Normal University (HZNU), Wuhan 430079, China
L. Chen
Central China Normal University (HZNU), Wuhan 430079, China
J. Cheng
Tsinghua University, Beijing 100084, China
M. Cherney
Creighton University, Omaha, Nebraska 68178, USA
A. Chikanian
Yale University, New Haven, Connecticut 06520, USA
W. Christie
Brookhaven National Laboratory, Upton, New York 11973, USA
P. Chung
Nuclear Physics Institute AS CR, 250 68 Řež/Prague, Czech Republic
J. Chwastowski
Cracow University of Technology, Cracow, Poland
M. J. M. Codrington
University of Texas, Austin, Texas 78712, USA
R. Corliss
Massachusetts Institute of Technology, Cambridge, MA 02139-4307, USA
J. G. Cramer
University of Washington, Seattle, Washington 98195, USA
H. J. Crawford
University of California, Berkeley, California 94720, USA
X. Cui
University of Science & Technology of China, Hefei 230026, China
S. Das
Institute of Physics, Bhubaneswar 751005, India
A. Davila Leyva
University of Texas, Austin, Texas 78712, USA
L. C. De Silva
University of Houston, Houston, TX, 77204, USA
R. R. Debbe
Brookhaven National Laboratory, Upton, New York 11973, USA
T. G. Dedovich
Joint Institute for Nuclear Research, Dubna, 141 980, Russia
J. Deng
Shandong University, Jinan, Shandong 250100, China
R. Derradi de Souza
Universidade Estadual de Campinas, Sao Paulo, Brazil
S. Dhamija
Indiana University, Bloomington, Indiana 47408, USA
B. di Ruzza
Brookhaven National Laboratory, Upton, New York 11973, USA
L. Didenko
Brookhaven National Laboratory, Upton, New York 11973, USA
F. Ding
University of California, Davis, California 95616, USA
A. Dion
Brookhaven National Laboratory, Upton, New York 11973, USA
P. Djawotho
Texas A&M University, College Station, Texas 77843, USA
X. Dong
Lawrence Berkeley National Laboratory, Berkeley, California 94720, USA
J. L. Drachenberg
Valparaiso University, Valparaiso, Indiana 46383, USA
J. E. Draper
University of California, Davis, California 95616, USA
C. M. Du
Institute of Modern Physics, Lanzhou, China
L. E. Dunkelberger
University of California, Los Angeles, California 90095, USA
J. C. Dunlop
Brookhaven National Laboratory, Upton, New York 11973, USA
L. G. Efimov
Joint Institute for Nuclear Research, Dubna, 141 980, Russia
M. Elnimr
Wayne State University, Detroit, Michigan 48201, USA
J. Engelage
University of California, Berkeley, California 94720, USA
G. Eppley
Rice University, Houston, Texas 77251, USA
L. Eun
Lawrence Berkeley National Laboratory, Berkeley, California 94720, USA
O. Evdokimov
University of Illinois at Chicago, Chicago, Illinois 60607, USA
R. Fatemi
University of Kentucky, Lexington, Kentucky, 40506-0055, USA
S. Fazio
Brookhaven National Laboratory, Upton, New York 11973, USA
J. Fedorisin
Joint Institute for Nuclear Research, Dubna, 141 980, Russia
R. G. Fersch
University of Kentucky, Lexington, Kentucky, 40506-0055, USA
P. Filip
Joint Institute for Nuclear Research, Dubna, 141 980, Russia
E. Finch
Yale University, New Haven, Connecticut 06520, USA
Y. Fisyak
Brookhaven National Laboratory, Upton, New York 11973, USA
E. Flores
University of California, Davis, California 95616, USA
C. A. Gagliardi
Texas A&M University, College Station, Texas 77843, USA
D. R. Gangadharan
Ohio State University, Columbus, Ohio 43210, USA
D. Garand
Purdue University, West Lafayette, Indiana 47907, USA
F. Geurts
Rice University, Houston, Texas 77251, USA
A. Gibson
Valparaiso University, Valparaiso, Indiana 46383, USA
S. Gliske
Argonne National Laboratory, Argonne, Illinois 60439, USA
O. G. Grebenyuk
Lawrence Berkeley National Laboratory, Berkeley, California 94720, USA
D. Grosnick
Valparaiso University, Valparaiso, Indiana 46383, USA
A. Gupta
University of Jammu, Jammu 180001, India
S. Gupta
University of Jammu, Jammu 180001, India
W. Guryn
Brookhaven National Laboratory, Upton, New York 11973, USA
B. Haag
University of California, Davis, California 95616, USA
O. Hajkova
Czech Technical University in Prague, FNSPE, Prague, 115 19, Czech Republic
A. Hamed
Texas A&M University, College Station, Texas 77843, USA
L-X. Han
Shanghai Institute of Applied Physics, Shanghai 201800, China
J. W. Harris
Yale University, New Haven, Connecticut 06520, USA
J. P. Hays-Wehle
Massachusetts Institute of Technology, Cambridge, MA 02139-4307, USA
S. Heppelmann
Pennsylvania State University, University Park, Pennsylvania 16802, USA
A. Hirsch
Purdue University, West Lafayette, Indiana 47907, USA
G. W. Hoffmann
University of Texas, Austin, Texas 78712, USA
D. J. Hofman
University of Illinois at Chicago, Chicago, Illinois 60607, USA
S. Horvat
Yale University, New Haven, Connecticut 06520, USA
B. Huang
Brookhaven National Laboratory, Upton, New York 11973, USA
H. Z. Huang
University of California, Los Angeles, California 90095, USA
P. Huck
Central China Normal University (HZNU), Wuhan 430079, China
T. J. Humanic
Ohio State University, Columbus, Ohio 43210, USA
G. Igo
University of California, Los Angeles, California 90095, USA
W. W. Jacobs
Indiana University, Bloomington, Indiana 47408, USA
C. Jena
National Institute of Science Education and Research, Bhubaneswar 751005, India
E. G. Judd
University of California, Berkeley, California 94720, USA
S. Kabana
SUBATECH, Nantes, France
K. Kang
Tsinghua University, Beijing 100084, China
J. Kapitan
Nuclear Physics Institute AS CR, 250 68 Řež/Prague, Czech Republic
K. Kauder
University of Illinois at Chicago, Chicago, Illinois 60607, USA
H. W. Ke
Central China Normal University (HZNU), Wuhan 430079, China
D. Keane
Kent State University, Kent, Ohio 44242, USA
A. Kechechyan
Joint Institute for Nuclear Research, Dubna, 141 980, Russia
A. Kesich
University of California, Davis, California 95616, USA
D. P. Kikola
Purdue University, West Lafayette, Indiana 47907, USA
J. Kiryluk
Lawrence Berkeley National Laboratory, Berkeley, California 94720, USA
I. Kisel
Lawrence Berkeley National Laboratory, Berkeley, California 94720, USA
A. Kisiel
Warsaw University of Technology, Warsaw, Poland
S. R. Klein
Lawrence Berkeley National Laboratory, Berkeley, California 94720, USA
D. D. Koetke
Valparaiso University, Valparaiso, Indiana 46383, USA
T. Kollegger
University of Frankfurt, Frankfurt, Germany
J. Konzer
Purdue University, West Lafayette, Indiana 47907, USA
I. Koralt
Old Dominion University, Norfolk, VA, 23529, USA
W. Korsch
University of Kentucky, Lexington, Kentucky, 40506-0055, USA
L. Kotchenda
Moscow Engineering Physics Institute, Moscow Russia
P. Kravtsov
Moscow Engineering Physics Institute, Moscow Russia
K. Krueger
Argonne National Laboratory, Argonne, Illinois 60439, USA
I. Kulakov
Lawrence Berkeley National Laboratory, Berkeley, California 94720, USA
L. Kumar
Kent State University, Kent, Ohio 44242, USA
M. A. C. Lamont
Brookhaven National Laboratory, Upton, New York 11973, USA
J. M. Landgraf
Brookhaven National Laboratory, Upton, New York 11973, USA
K. D. Landry
University of California, Los Angeles, California 90095, USA
S. LaPointe
Wayne State University, Detroit, Michigan 48201, USA
J. Lauret
Brookhaven National Laboratory, Upton, New York 11973, USA
A. Lebedev
Brookhaven National Laboratory, Upton, New York 11973, USA
R. Lednicky
Joint Institute for Nuclear Research, Dubna, 141 980, Russia
J. H. Lee
Brookhaven National Laboratory, Upton, New York 11973, USA
W. Leight
Massachusetts Institute of Technology, Cambridge, MA 02139-4307, USA
M. J. LeVine
Brookhaven National Laboratory, Upton, New York 11973, USA
C. Li
University of Science & Technology of China, Hefei 230026, China
W. Li
Shanghai Institute of Applied Physics, Shanghai 201800, China
X. Li
Purdue University, West Lafayette, Indiana 47907, USA
X. Li
Temple University, Philadelphia, Pennsylvania, 19122
Y. Li
Tsinghua University, Beijing 100084, China
Z. M. Li
Central China Normal University (HZNU), Wuhan 430079, China
L. M. Lima
Universidade de Sao Paulo, Sao Paulo, Brazil
M. A. Lisa
Ohio State University, Columbus, Ohio 43210, USA
F. Liu
Central China Normal University (HZNU), Wuhan 430079, China
T. Ljubicic
Brookhaven National Laboratory, Upton, New York 11973, USA
W. J. Llope
Rice University, Houston, Texas 77251, USA
R. S. Longacre
Brookhaven National Laboratory, Upton, New York 11973, USA
Y. Lu
University of Science & Technology of China, Hefei 230026, China
X. Luo
Central China Normal University (HZNU), Wuhan 430079, China
A. Luszczak
Cracow University of Technology, Cracow, Poland
G. L. Ma
Shanghai Institute of Applied Physics, Shanghai 201800, China
Y. G. Ma
Shanghai Institute of Applied Physics, Shanghai 201800, China
D. M. M. D. Madagodagettige Don
Creighton University, Omaha, Nebraska 68178, USA
D. P. Mahapatra
Institute of Physics, Bhubaneswar 751005, India
R. Majka
Yale University, New Haven, Connecticut 06520, USA
S. Margetis
Kent State University, Kent, Ohio 44242, USA
C. Markert
University of Texas, Austin, Texas 78712, USA
H. Masui
Lawrence Berkeley National Laboratory, Berkeley, California 94720, USA
H. S. Matis
Lawrence Berkeley National Laboratory, Berkeley, California 94720, USA
D. McDonald
Rice University, Houston, Texas 77251, USA
T. S. McShane
Creighton University, Omaha, Nebraska 68178, USA
S. Mioduszewski
Texas A&M University, College Station, Texas 77843, USA
M. K. Mitrovski
Brookhaven National Laboratory, Upton, New York 11973, USA
Y. Mohammed
Texas A&M University, College Station, Texas 77843, USA
B. Mohanty
National Institute of Science Education and Research, Bhubaneswar 751005, India
M. M. Mondal
Texas A&M University, College Station, Texas 77843, USA
M. G. Munhoz
Universidade de Sao Paulo, Sao Paulo, Brazil
M. K. Mustafa
Purdue University, West Lafayette, Indiana 47907, USA
M. Naglis
Lawrence Berkeley National Laboratory, Berkeley, California 94720, USA
B. K. Nandi
Indian Institute of Technology, Mumbai, India
Md. Nasim
Variable Energy Cyclotron Centre, Kolkata 700064, India
T. K. Nayak
Variable Energy Cyclotron Centre, Kolkata 700064, India
J. M. Nelson
University of Birmingham, Birmingham, United Kingdom
L. V. Nogach
Institute of High Energy Physics, Protvino, Russia
J. Novak
Michigan State University, East Lansing, Michigan 48824, USA
G. Odyniec
Lawrence Berkeley National Laboratory, Berkeley, California 94720, USA
A. Ogawa
Brookhaven National Laboratory, Upton, New York 11973, USA
K. Oh
Pusan National University, Pusan, Republic of Korea
A. Ohlson
Yale University, New Haven, Connecticut 06520, USA
V. Okorokov
Moscow Engineering Physics Institute, Moscow Russia
E. W. Oldag
University of Texas, Austin, Texas 78712, USA
R. A. N. Oliveira
Universidade de Sao Paulo, Sao Paulo, Brazil
D. Olson
Lawrence Berkeley National Laboratory, Berkeley, California 94720, USA
M. Pachr
Czech Technical University in Prague, FNSPE, Prague, 115 19, Czech Republic
B. S. Page
Indiana University, Bloomington, Indiana 47408, USA
S. K. Pal
Variable Energy Cyclotron Centre, Kolkata 700064, India
Y. X. Pan
University of California, Los Angeles, California 90095, USA
Y. Pandit
University of Illinois at Chicago, Chicago, Illinois 60607, USA
Y. Panebratsev
Joint Institute for Nuclear Research, Dubna, 141 980, Russia
T. Pawlak
Warsaw University of Technology, Warsaw, Poland
B. Pawlik
Institute of Nuclear Physics PAN, Cracow, Poland
H. Pei
University of Illinois at Chicago, Chicago, Illinois 60607, USA
C. Perkins
University of California, Berkeley, California 94720, USA
W. Peryt
Warsaw University of Technology, Warsaw, Poland
P. Pile
Brookhaven National Laboratory, Upton, New York 11973, USA
M. Planinic
University of Zagreb, Zagreb, HR-10002, Croatia
J. Pluta
Warsaw University of Technology, Warsaw, Poland
N. Poljak
University of Zagreb, Zagreb, HR-10002, Croatia
J. Porter
Lawrence Berkeley National Laboratory, Berkeley, California 94720, USA
A. M. Poskanzer
Lawrence Berkeley National Laboratory, Berkeley, California 94720, USA
C. B. Powell
Lawrence Berkeley National Laboratory, Berkeley, California 94720, USA
C. Pruneau
Wayne State University, Detroit, Michigan 48201, USA
N. K. Pruthi
Panjab University, Chandigarh 160014, India
M. Przybycien
AGH University of Science and Technology, Cracow, Poland
P. R. Pujahari
Indian Institute of Technology, Mumbai, India
J. Putschke
Wayne State University, Detroit, Michigan 48201, USA
H. Qiu
Lawrence Berkeley National Laboratory, Berkeley, California 94720, USA
S. Ramachandran
University of Kentucky, Lexington, Kentucky, 40506-0055, USA
R. Raniwala
University of Rajasthan, Jaipur 302004, India
S. Raniwala
University of Rajasthan, Jaipur 302004, India
R. L. Ray
University of Texas, Austin, Texas 78712, USA
R. Redwine
Massachusetts Institute of Technology, Cambridge, MA 02139-4307, USA
C. K. Riley
Yale University, New Haven, Connecticut 06520, USA
H. G. Ritter
Lawrence Berkeley National Laboratory, Berkeley, California 94720, USA
J. B. Roberts
Rice University, Houston, Texas 77251, USA
O. V. Rogachevskiy
Joint Institute for Nuclear Research, Dubna, 141 980, Russia
J. L. Romero
University of California, Davis, California 95616, USA
J. F. Ross
Creighton University, Omaha, Nebraska 68178, USA
L. Ruan
Brookhaven National Laboratory, Upton, New York 11973, USA
J. Rusnak
Nuclear Physics Institute AS CR, 250 68 Řež/Prague, Czech Republic
N. R. Sahoo
Variable Energy Cyclotron Centre, Kolkata 700064, India
P. K. Sahu
Institute of Physics, Bhubaneswar 751005, India
I. Sakrejda
Lawrence Berkeley National Laboratory, Berkeley, California 94720, USA
S. Salur
Lawrence Berkeley National Laboratory, Berkeley, California 94720, USA
A. Sandacz
Warsaw University of Technology, Warsaw, Poland
J. Sandweiss
Yale University, New Haven, Connecticut 06520, USA
E. Sangaline
University of California, Davis, California 95616, USA
A. Sarkar
Indian Institute of Technology, Mumbai, India
J. Schambach
University of Texas, Austin, Texas 78712, USA
R. P. Scharenberg
Purdue University, West Lafayette, Indiana 47907, USA
A. M. Schmah
Lawrence Berkeley National Laboratory, Berkeley, California 94720, USA
B. Schmidke
Brookhaven National Laboratory, Upton, New York 11973, USA
N. Schmitz
Max-Planck-Institut für Physik, Munich, Germany
T. R. Schuster
University of Frankfurt, Frankfurt, Germany
J. Seele
Massachusetts Institute of Technology, Cambridge, MA 02139-4307, USA
J. Seger
Creighton University, Omaha, Nebraska 68178, USA
P. Seyboth
Max-Planck-Institut für Physik, Munich, Germany
N. Shah
University of California, Los Angeles, California 90095, USA
E. Shahaliev
Joint Institute for Nuclear Research, Dubna, 141 980, Russia
M. Shao
University of Science & Technology of China, Hefei 230026, China
B. Sharma
Panjab University, Chandigarh 160014, India
M. Sharma
Wayne State University, Detroit, Michigan 48201, USA
S. S. Shi
Central China Normal University (HZNU), Wuhan 430079, China
Q. Y. Shou
Shanghai Institute of Applied Physics, Shanghai 201800, China
E. P. Sichtermann
Lawrence Berkeley National Laboratory, Berkeley, California 94720, USA
R. N. Singaraju
Variable Energy Cyclotron Centre, Kolkata 700064, India
M. J. Skoby
Indiana University, Bloomington, Indiana 47408, USA
D. Smirnov
Brookhaven National Laboratory, Upton, New York 11973, USA
N. Smirnov
Yale University, New Haven, Connecticut 06520, USA
D. Solanki
University of Rajasthan, Jaipur 302004, India
P. Sorensen
Brookhaven National Laboratory, Upton, New York 11973, USA
U. G. deSouza
Universidade de Sao Paulo, Sao Paulo, Brazil
H. M. Spinka
Argonne National Laboratory, Argonne, Illinois 60439, USA
B. Srivastava
Purdue University, West Lafayette, Indiana 47907, USA
T. D. S. Stanislaus
Valparaiso University, Valparaiso, Indiana 46383, USA
S. G. Steadman
Massachusetts Institute of Technology, Cambridge, MA 02139-4307, USA
J. R. Stevens
Massachusetts Institute of Technology, Cambridge, MA 02139-4307, USA
R. Stock
University of Frankfurt, Frankfurt, Germany
M. Strikhanov
Moscow Engineering Physics Institute, Moscow Russia
B. Stringfellow
Purdue University, West Lafayette, Indiana 47907, USA
A. A. P. Suaide
Universidade de Sao Paulo, Sao Paulo, Brazil
M. C. Suarez
University of Illinois at Chicago, Chicago, Illinois 60607, USA
M. Sumbera
Nuclear Physics Institute AS CR, 250 68 Řež/Prague, Czech Republic
X. M. Sun
Lawrence Berkeley National Laboratory, Berkeley, California 94720, USA
Y. Sun
University of Science & Technology of China, Hefei 230026, China
Z. Sun
Institute of Modern Physics, Lanzhou, China
B. Surrow
Temple University, Philadelphia, Pennsylvania, 19122
D. N. Svirida
Alikhanov Institute for Theoretical and Experimental Physics, Moscow, Russia
T. J. M. Symons
Lawrence Berkeley National Laboratory, Berkeley, California 94720, USA
A. Szanto de Toledo
Universidade de Sao Paulo, Sao Paulo, Brazil
J. Takahashi
Universidade Estadual de Campinas, Sao Paulo, Brazil
A. H. Tang
Brookhaven National Laboratory, Upton, New York 11973, USA
Z. Tang
University of Science & Technology of China, Hefei 230026, China
L. H. Tarini
Wayne State University, Detroit, Michigan 48201, USA
T. Tarnowsky
Michigan State University, East Lansing, Michigan 48824, USA
J. H. Thomas
Lawrence Berkeley National Laboratory, Berkeley, California 94720, USA
J. Tian
Shanghai Institute of Applied Physics, Shanghai 201800, China
A. R. Timmins
University of Houston, Houston, TX, 77204, USA
D. Tlusty
Nuclear Physics Institute AS CR, 250 68 Řež/Prague, Czech Republic
M. Tokarev
Joint Institute for Nuclear Research, Dubna, 141 980, Russia
S. Trentalange
University of California, Los Angeles, California 90095, USA
R. E. Tribble
Texas A&M University, College Station, Texas 77843, USA
P. Tribedy
Variable Energy Cyclotron Centre, Kolkata 700064, India
B. A. Trzeciak
Warsaw University of Technology, Warsaw, Poland
O. D. Tsai
University of California, Los Angeles, California 90095, USA
J. Turnau
Institute of Nuclear Physics PAN, Cracow, Poland
T. Ullrich
Brookhaven National Laboratory, Upton, New York 11973, USA
D. G. Underwood
Argonne National Laboratory, Argonne, Illinois 60439, USA
G. Van Buren
Brookhaven National Laboratory, Upton, New York 11973, USA
G. van Nieuwenhuizen
Massachusetts Institute of Technology, Cambridge, MA 02139-4307, USA
J. A. Vanfossen, Jr
Kent State University, Kent, Ohio 44242, USA
R. Varma
Indian Institute of Technology, Mumbai, India
G. M. S. Vasconcelos
Universidade Estadual de Campinas, Sao Paulo, Brazil
F. Videbæk
Brookhaven National Laboratory, Upton, New York 11973, USA
Y. P. Viyogi
Variable Energy Cyclotron Centre, Kolkata 700064, India
S. Vokal
Joint Institute for Nuclear Research, Dubna, 141 980, Russia
S. A. Voloshin
Wayne State University, Detroit, Michigan 48201, USA
A. Vossen
Indiana University, Bloomington, Indiana 47408, USA
M. Wada
University of Texas, Austin, Texas 78712, USA
F. Wang
Purdue University, West Lafayette, Indiana 47907, USA
G. Wang
University of California, Los Angeles, California 90095, USA
H. Wang
Brookhaven National Laboratory, Upton, New York 11973, USA
J. S. Wang
Institute of Modern Physics, Lanzhou, China
Q. Wang
Purdue University, West Lafayette, Indiana 47907, USA
X. L. Wang
University of Science & Technology of China, Hefei 230026, China
Y. Wang
Tsinghua University, Beijing 100084, China
G. Webb
University of Kentucky, Lexington, Kentucky, 40506-0055, USA
J. C. Webb
Brookhaven National Laboratory, Upton, New York 11973, USA
G. D. Westfall
Michigan State University, East Lansing, Michigan 48824, USA
C. Whitten Jr
University of California, Los Angeles, California 90095, USA
H. Wieman
Lawrence Berkeley National Laboratory, Berkeley, California 94720, USA
S. W. Wissink
Indiana University, Bloomington, Indiana 47408, USA
R. Witt
United States Naval Academy, Annapolis, MD 21402, USA
Y. F. Wu
Central China Normal University (HZNU), Wuhan 430079, China
Z. Xiao
Tsinghua University, Beijing 100084, China
W. Xie
Purdue University, West Lafayette, Indiana 47907, USA
K. Xin
Rice University, Houston, Texas 77251, USA
H. Xu
Institute of Modern Physics, Lanzhou, China
N. Xu
Lawrence Berkeley National Laboratory, Berkeley, California 94720, USA
Q. H. Xu
Shandong University, Jinan, Shandong 250100, China
W. Xu
University of California, Los Angeles, California 90095, USA
Y. Xu
University of Science & Technology of China, Hefei 230026, China
Z. Xu
Brookhaven National Laboratory, Upton, New York 11973, USA
L. Xue
Shanghai Institute of Applied Physics, Shanghai 201800, China
Y. Yang
Institute of Modern Physics, Lanzhou, China
Y. Yang
Central China Normal University (HZNU), Wuhan 430079, China
P. Yepes
Rice University, Houston, Texas 77251, USA
L. Yi
Purdue University, West Lafayette, Indiana 47907, USA
K. Yip
Brookhaven National Laboratory, Upton, New York 11973, USA
I-K. Yoo
Pusan National University, Pusan, Republic of Korea
M. Zawisza
Warsaw University of Technology, Warsaw, Poland
H. Zbroszczyk
Warsaw University of Technology, Warsaw, Poland
J. B. Zhang
Central China Normal University (HZNU), Wuhan 430079, China
S. Zhang
Shanghai Institute of Applied Physics, Shanghai 201800, China
X. P. Zhang
Tsinghua University, Beijing 100084, China
Y. Zhang
University of Science & Technology of China, Hefei 230026, China
Z. P. Zhang
University of Science & Technology of China, Hefei 230026, China
F. Zhao
University of California, Los Angeles, California 90095, USA
J. Zhao
Shanghai Institute of Applied Physics, Shanghai 201800, China
C. Zhong
Shanghai Institute of Applied Physics, Shanghai 201800, China
X. Zhu
Tsinghua University, Beijing 100084, China
Y. H. Zhu
Shanghai Institute of Applied Physics, Shanghai 201800, China
Y. Zoulkarneeva
Joint Institute for Nuclear Research, Dubna, 141 980, Russia
M. Zyzak
Lawrence Berkeley National Laboratory, Berkeley, California 94720, USA
Abstract
We present a study of the average transverse momentum
() fluctuations and correlations for charged particles
produced in Cu+Cu collisions at midrapidity for 62.4 and 200
GeV.
These results are compared with those published for Au+Au
collisions at the same energies, to explore the system size dependence.
In addition to the collision energy and system size dependence, the
correlation results have been studied as functions of the collision
centralities, the ranges in , the pseudorapidity , and the
azimuthal angle .
The square root of the measured correlations when scaled by
mean is found to be independent of both colliding beam energy
and system size studied. Transport-based model calculations are
found to have a better quantitative agreement with the measurements
compared to models which incorporate only jetlike correlations.
pacs:
25.75.Gz
I Introduction
The study of event-by-event fluctuations and correlations is an important tool to understand
thermalization and phase transitions in heavy-ion collisions heis ; fluct ; jetq2_5 ; fluct2 ; pmdfluc_5 ; adcox_5 .
Non-monotonic change in transverse momentum () correlations as a function of centrality and/or the incident energy
has been proposed
as a possible signal of quark gluon plasma (QGP) formation heis .
The QGP is believed to be formed at the early stage of high energy heavy-ion collisions when the
system is hot and dense. As time passes, the system dilutes, cools down and hadronizes.
Fluctuations are supposed to be sensitive to the dynamics of the
system, especially at the
QGP to hadron gas transition fluct2 ; adcox_5 .
Alternatively, analyses at the Relativistic Heavy Ion Collider (RHIC)
based on auto-correlations (the inversion of the mean transverse momentum
fluctuations in various pseudorapidity and azimuthal angle
difference regions of the produced particles)
indicate that the basic correlation mechanism could be dominated by the process of parton
fragmentation parton .
Thus fluctuation measurements are proposed to be an important tool in understanding
nucleus-nucleus collisions heis ; adcox_5 ; steph_5 ; steph2_5 ; steph3_5 ; steph4_5 ; dis_5 ; pmdfluc_5 .
In addition, under the assumption that thermodynamics is applicable to heavy-ion collisions, fluctuations
in various observables could be related to thermodynamic properties of the
matter formed.
For example, the event-by-event
could be related to temperature fluctuations stodolsky_5 ; shuryak2_5 ; rajagopal_5 ; berdi_5 ; voloshin_5 .
The study of event-by-event fluctuations of various quantities
such as eventwise mean transverse momentum
(), charged track multiplicity, and conserved quantities such
as net-baryon and/or net-charge number
are considered to be some of the main probes in the search for the critical point in the
QCD phase diagram voloshin_5 ; bass_5 ; bass2_5 ; jeon_5 ; asakawa_5 ; lin_5 ; heis2_5 ; shuryak_5 ; pruneau_5 ; gavin_5 .
One expects enhanced fluctuations in the above observables when the
system passes through the vicinity of the critical point.
Recent results from the
CERN Super Proton Synchrotron
(SPS)
experiments show
that the energy dependence of transverse momentum fluctuations does not show the increase expected for freeze-out
near the critical point of QCD na49_pt . However, when these
fluctuations are studied as a function of the system size (colliding
C+C, Si+Si, Pb+Pb), enhanced fluctuations are observed in smaller colliding
systems na49 .
The results from the RHIC beam energy scan (BES) bes data for the above
observables will provide further insights.
The results presented here are from Cu+Cu collisions at
62.4 and 200 GeV using the
solenoidal tracker At RHIC (STAR) and
are compared with the published results from
Au+Au collisions at the same energies prc_200_5 .
This paper describes a systematic study of the system size dependence of
the transverse momentum correlations observed at RHIC.
The paper is organized as follows.
The STAR detector, the data set, and the centrality
selection used in the analysis, are discussed in Sec. II.
In Sec. III, we discuss
fluctuations extracted
from the distributions, which are compared
with mixed events and gamma distributions.
Dynamical fluctuations are extracted
and presented for Au+Au and Cu+Cu collisions at 62.4
and 200 GeV.
The correlations and the dynamical correlations when scaled by and are discussed
in Sec. IV,
to understand the centrality and energy dependence.
Experimental data is also compared to various model calculations.
Finally, a detailed study of , and dependence of
the correlations, is presented.
The systematic errors
associated with the analysis are discussed in Sec. V.
We conclude with a summary in Sec. VI.
II Experiment and Data Analysis
The Cu+Cu data were taken using the STAR detector with a minimum bias trigger.
For the data taken at 200 GeV this was done by
requiring a coincidence from the two zero degree calorimeters
(ZDCs). For the 62.4 GeV data, the ZDC is less efficient,
so a beam beam counter (BBC) coincidence was also required.
More details about the trigger detectors
can be obtained from Ref. trig_5 .
The main detector used in this analysis is the time projection chamber
(TPC) star_nim , which is the primary tracking device in STAR.
The TPC is 4.2 m
long and 4 m in diameter and its acceptance spans about 1.0 units of
pseudorapidity and full azimuthal coverage.
The sensitive volume of the TPC contains P10 gas (10% methane, 90% argon) regulated at 2 mbar above atmospheric
pressure. The TPC data are used to determine particle trajectories,
momenta, and particle-type through ionization energy loss () bichsel .
The primary vertex of events used in this analysis is required to be within 30 cm of the geometric center of
the TPC along the beam axis.
This selection process provides about 7.5 and
15 minimum bias events for Cu+Cu collisions at 62.4 and 200 GeV,
respectively.
The collision centralities are represented by the fractions of events
in the minimum bias inelastic
cross section distribution
in a collision. In data, the collision centrality is determined by using the
uncorrected charged track multiplicity (), measured in the TPC
within 0.5.
The various centrality
bins are calculated as a fraction of this multiplicity distribution starting at
the highest multiplicities.
The centrality classes for Cu+Cu collisions at 62.4 and 200 GeV
are 0%–10% (most central), 10%–20%, 20%–30%, 30%–40%, 40%–50% and 50%–60%
(most peripheral).
Each centrality bin is associated with an average number of participating nucleons
()
obtained using Glauber Monte Carlo
simulations mc_5 employing the Woods-Saxon distribution for the nucleons inside the
Cu nucleus.
The systematic uncertainties include those determined by varying the
Woods-Saxon parameters, those associated with the nucleon-nucleon
cross sections, those related to the functional representation of the
multiplicity distribution, and those associated with the
determination of the total Cu+Cu cross section.
Table 1 lists the
and
values for each centrality in Cu+Cu collisions at
62.4 and 200 GeV.
Corresponding values for Au+Au collisions can be found in Ref. mc_5 .
In order to have uniform detector performance, a pseudorapidity cut of
1.0 is
applied to tracks. To avoid the admixture of tracks from a secondary vertex, a requirement is placed on the
distance of closest approach (DCA) between each track and the event vertex.
The charged particle tracks are required to have originated within 1 cm of the measured
event vertex.
The multiple counting of split tracks (more than one track
reconstructed from the original single track) is avoided by applying a condition on the number
of track fit points () used in the reconstruction of the
track.
Each included track is required to have a minimum
number of 21 TPC points along the track.
The transverse momentum range selected for the analysis is 0.15–2.0
GeV/.
The errors shown in the figures have the statistical and systematic
errors added in quadrature unless otherwise stated. The statistical errors are small and are
within symbol sizes. The final systematic errors are
obtained as quadrature sums of systematic errors from different
sources as discussed in Sec. V.
III Fluctuations
The fluctuations in high energy collisions can be measured using the
distribution of the event-wise mean transverse momentum defined
as
(1)
where is the multiplicity of accepted tracks
from the primary vertex in a given event and is the
transverse momentum
of the track. The
mean- distribution is compared to the corresponding distribution
obtained for mixed events prc_200_5 .
Mixed events are constructed by randomly
selecting one track from an event chosen from the events in the same
centrality and same event vertex bin. The mixed events are created
with the same multiplicity distribution as that of the real events.
Table 1:
The values and average number of participating nucleons ()
for various collision centralities in Cu+Cu collisions at
= 62.4 and 200 GeV.
% cross
Cu+Cu 62.4
GeV
Cu+Cu 200 GeV
section
0-10
10-20
20-30
30-40
40-50
50-60
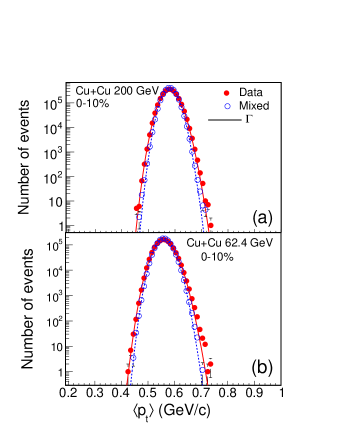
Figure 1: (Color online) Event-by-event distributions for
data and mixed events in central
Cu+Cu collisions at (a) 200 and (b) 62.4 GeV. The
curves (solid for data and dotted for mixed events)
represent the
distributions.
The errors shown are statistical.
Table 2:
Gamma distribution parameters for event-by-event distributions for data and mixed events in central
(0%-10%) Cu+Cu collisions
at 62.4 and 200 GeV.
Collision
(
type (AA)
GeV/)
(GeV/)
(GeV/)
Cu 200 (data)
476
1.22
0.5805
0.02660
Cu 200 (mixed)
634
0.92
0.5807
0.02310
Cu 62.4 (data)
358
1.56
0.5603
0.02960
Cu 62.4 (mixed)
457
1.23
0.5602
0.02621
Figure 1 shows the event-by-event mean-
distributions for 0%-10% Cu+Cu collisions at
(a) 200 and (b) 62.4 GeV.
The solid symbols represent
the distributions for data; the open symbols represent
distributions for mixed events.
The distributions are similar for other centralities.
The mixed events
provide a reference measure of statistical fluctuations in the data.
Any fluctuations
observed in data beyond these statistical fluctuations are referred to as
non-statistical or dynamical fluctuations in this paper.
For both data and mixed events,
while going from central to peripheral collisions,
the mean () of the distributions decreases
whereas
the
standard deviation () increases.
Moreover, it is seen that the distributions
for data are wider than those for mixed
events, suggesting the presence of non-statistical fluctuations in
Cu+Cu data for both 62.4 and 200 GeV collisions.
The curves in Fig. 1 represent
the gamma () distributions
for data (solid lines) and mixed events (dotted lines). The
distribution fluct2 ; tannen_5 is given by
(2)
where represents the ;
and .
Tannenbaum tannen_5 argues that the
distribution
is one of the standard representations of the inclusive single particle
distribution.
Tannenbaum tannen_5
also suggests that the quantity , should be 2, and the quantity
representing the inverse slope parameter may be referred to as the temperature
of the system.
Here is the average charged particle
multiplicity in a given centrality bin.
It is found that for Cu+Cu 0%–10%
central collisions
is 2.04 at 200 GeV, and is 2.18 at 62.4 GeV.
The respective values are
0.284 GeV/ and 0.256 GeV/.
The and for 0%–5% central Au+Au collisions at 200 GeV were
found to be 1.93 and 0.299 GeV/ prc_200_5 .
Table 2 lists
gamma distribution parameters for event-by-event distributions for data and mixed events in central
(0%–10%) Cu+Cu
collisions at 62.4 and 200 GeV. The values for Au+Au collisions can be found in
Ref. prc_200_5 .
For Cu+Cu collisions at 200 GeV, varies from 2.04 to 2.11 from central to peripheral
collisions. However, for Cu+Cu at 62.4 GeV,
varies from
2.18 to 2.27 from central to peripheral collisions. The errors on
values of and are of the order of 13–18% and
9-12%, respectively,
for Cu+Cu collisions.
The non-statistical or dynamical fluctuations in mean-
are quantified using a variable sigmdyn_ref ; k2pi_star
defined as
(3)
where and are the means of the event-by-event
distributions for data and mixed events, respectively. Similarly, and
are respectively the standard deviations of
distributions for data and mixed events.
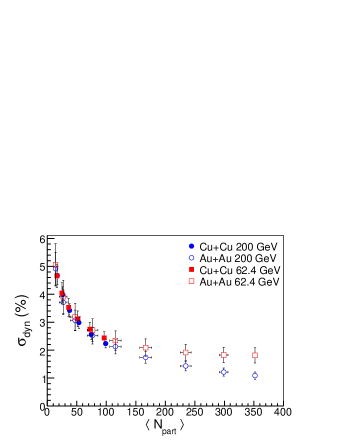
Figure 2 shows the dynamical fluctuations () in mean- plotted as
a function of .
The results are shown for Cu+Cu collisions at
62.4 and 200 GeV, and are compared with the results from Au+Au collisions at
62.4 and 200 GeV.
The dynamical fluctuations are similar in
Au+Au and Cu+Cu collisions
at similar values of .
The fluctuations decrease as
increases.
The dynamical fluctuations are also independent of the collision
energy and are found to vary
from 2% to 5%
for less than 120.
For greater than 150,
the dynamical fluctuations are smaller and vary from 1% to 2.5%.
Figure 2:
(Color online) Comparison of dynamical fluctuations in Au+Au and Cu+Cu collisions
at 62.4 and 200 GeV as a function of the number of participating
nucleons.
IV Correlations
Non-statistical or dynamical fluctuations can also be analyzed by using
two-particle transverse momentum correlations prc_200_5 .
The two-particle correlations are studied using the
following equation prc_200_5 :
(4)
where is the two-particle transverse momentum covariance for
the event,
(5)
where is the transverse
momentum of the track in the event, is the number of
tracks in the event, and is the number of events. The overall event average transverse
momentum () is given by
(6)
where is the average transverse
momentum in the event.
It may be noted that, for mixed events, there will be no dynamical
fluctuations and the correlations will be zero.
Equation (4) is used to obtain the correlations in
Cu+Cu collisions at 62.4 and 200 GeV.
These
results are compared with the published results from Au+Au collisions at similar
energies prc_200_5
to investigate the system-size and collision energy dependence of the
correlations in heavy-ion collisions at RHIC.
The correlation values may be influenced by the dependence of the correlations
on the size of the centrality bin due to variation of with centrality.
This dependence is removed by calculating as a function of , which is the multiplicity
of charged tracks used to define the centrality. This multiplicity dependence of is fitted
with a suitable polynomial in and used in Eq. (5) for .
All results presented in this paper have been corrected for
this effect.
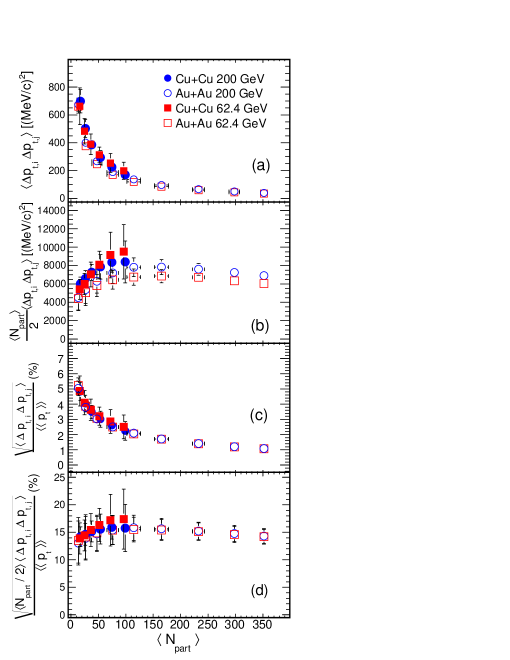
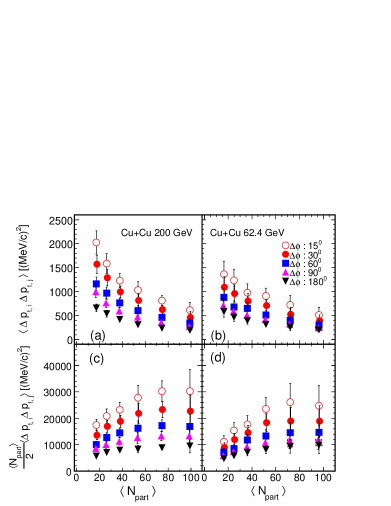
Figure 3 (a) shows the correlations plotted
as a function of
for Cu+Cu and Au+Au collisions at 62.4 and 200 GeV.
The correlations
decrease with increasing for Au+Au and
Cu+Cu at both energies.
The decrease in correlations with increasing participating nucleons
could
suggest that
correlations are dominated by pairs of particles that
originate from the same nucleon-nucleon collision, and they get diluted when the
number of participating nucleons increases prc_200_5 .
Figure 3: (Color online) (a) correlations, (b) correlations
multiplied by , (c) square root of
correlations scaled by , and (d) square root of correlations multiplied by
and scaled by , plotted vs. . Results are compared between Cu+Cu and Au+Au collisions at
62.4 and 200 GeV. Au+Au data have been taken from Ref. prc_200_5 .
IV.1 Scaled Correlations
The decrease in correlations with increasing seen in Fig. 3 (a)
may be related to a system volume dependence characterized by .
This volume dependence is removed by
multiplying the correlations by as
shown in Fig. 3 (b).
The results are shown for Cu+Cu and
Au+Au collisions at 62.4 and 200 GeV. It is observed that this measure
of correlations increases quickly with increasing for both Cu+Cu and
Au+Au collisions and saturates for central Au+Au collisions.
The saturation of this quantity might indicate effects
such as the onset of thermalization gavin_5 , the onset of jet quenching steph4_5 ; jetq2_5 , or the saturation of transverse flow in central collisions tflow_5 .
It seems that, for Cu+Cu collisions, this quantity is larger than for
Au+Au collisions which might indicate more correlations for the
smaller systems. However, the size of the errors in the current analysis does not allow a conclusive statement.
The correlation measure may change
due to changes in with incident energy and/or
collision centrality. To address these changes,
the square roots of the
measured correlations are scaled by .
Figure 3 (c) shows the corresponding quantity
plotted as a function of collision centrality for Cu+Cu and Au+Au collisions at
62.4 and 200 GeV.
It is observed that the correlation scaled by
is independent of collision system size and energy, but decreases with increasing .
The combined effect of multiplying correlations by and scaling with is shown in Fig. 3 (d). It seems that
this quantity increases with and shows
saturation for central Au+Au collisions, but is independent of
collision system and energy.
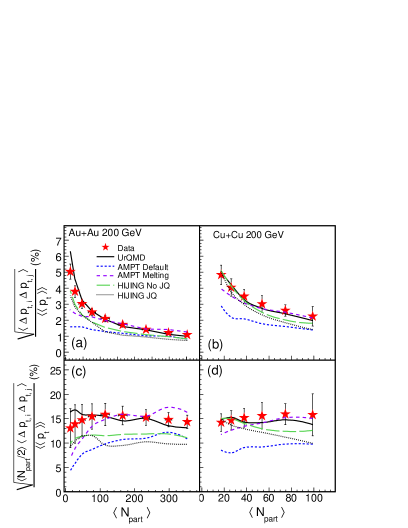
IV.2 Model Comparisons
It is interesting to compare the above
results with theoretical model calculations to understand the physical mechanism behind these
measurements.
The comparison is made with some widely used models in
heavy-ion collisions such as ultrarelativistic quantum molecular
dynamics (URQMD) urqmd , a multiphase transport model (AMPT) (default and string-melting) ampt ,
and the heavy-ion jet interaction generator (HIJING) (with jet quenching
switched off and on) hijing_5 .
The model results are obtained using UrQMD version 2.3, AMPT version
1.11 for default, and version 2.11 for AMPT string-melting.
HIJING is a
perturbative QCD-inspired model that
produces multiple minijet partons; these later get transformed into
string configurations and then fragment to hadrons. The fragmentation
is based on the Lund jet fragmentation model lund_model . A parametrized
parton-distribution function inside a nucleus is used to take into
account parton shadowing.
AMPT uses the same initial conditions as in HIJING. However, the
minijet partons are made to undergo scattering before they are allowed
to fragment into hadrons. The string-melting (SM) version of the AMPT
model (labeled here as AMPT Melting) is based on the idea
that for energy
densities beyond a critical value of 1 GeV/,
the system should be de-confined and strings (or hadrons) decomposed into their partonic components.
This is done by converting
the mesons to a quark-antiquark pair, baryons to three quarks, and
so on. The scattering of the quarks is based on a parton cascade.
Once the interactions stop, the partons then hadronize through
the mechanism of parton coalescence.
Figure 4: (Color online) Comparison of scaled correlations between
data and models for Au+Au [panels (a) and (c)] and Cu+Cu [panels (b)
and (d)] collisions at 200 GeV.
Au+Au data has been taken from Ref. prc_200_5 . The
curves represent different model calculations.
Figure 5: (Color online) correlations for varying rapidity
acceptance (0.25, 0.5, and 1.0) for Cu+Cu collisions at
200 GeV [panel (a)] and
62.4 GeV [panel (b)].
The URQMD model is based on a microscopic transport theory where the
phase-space description of the reactions is important. It allows for
the propagation of all hadrons on classical trajectories in
combination with stochastic binary scattering, color string formation,
and resonance decay.
Figure 4 shows the comparison of correlations
between data [(a) and (c) for Au+Au 200 GeV, and (b) and (d) for Cu+Cu
200 GeV] and the
models described above.
The
transport-based URQMD model calculations are observed to have a better
quantitative agreement with the measurements compared to models which
incorporate only jetlike correlations as in HIJING. HIJING gives
similar dependence on but under-predicts the magnitude. Inclusion
of the jet-quenching effect in HIJING leads to a smaller value of the
correlations in central collisions.
AMPT model calculation
incorporating coalescence as a mechanism of particle
production also compares well with data for central collisions. However
the default version of this model which incorporates additional initial and final state
scattering relative to HIJING yields smaller values of correlations.
IV.3 and Dependence
The and dependences of
correlations are also studied.
Figure 5 shows the correlations plotted as
a function of increasing rapidity acceptance for Cu+Cu collisions at
(a) 200 and (b) 62.4 GeV.
The data points for centralities 0%-10%, 20%-30%, and 40%-50% are shifted
by 0.01 in /2 for clarity. The correlations
are almost independent of the window for
the most central collisions. For peripheral
collisions, the correlations show a slight
rapidity dependence with maximum value for
.
Figure 6: (Color online) correlations for varying azimuthal
acceptance
for Cu+Cu collisions at 200 GeV [panels (a) and (c)] and
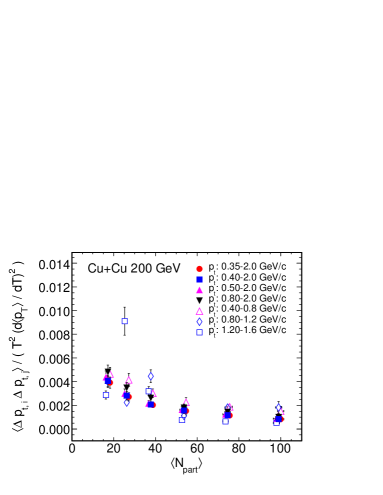
62.4 GeV [panels (b) and (d)]. Figure 7: (Color online)
correlations plotted as a function of for different ranges in Cu+Cu collisions at (a) 200 GeV and (b) 62.4 GeV.
Figure 6 shows the correlations for varying
azimuthal angle windows
for Cu+Cu collisions at
(a) 200 and (b) 62.4 GeV.
The data points for windows: and
are shifted by 0.5 units in for clarity.
The correlations are maximum for
(among the cases studied) and decrease with increasing
for a given window,
as expected.
The correlations multiplied by /2
[Fig. 6 (c) for Cu+Cu 200 GeV and Fig. 6 (d) for Cu+Cu
62.4 GeV] seem to increase and then saturate with increasing .
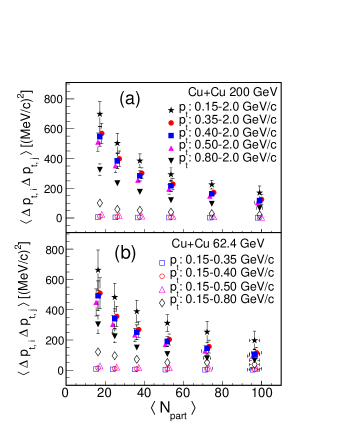
IV.4 Dependence
Figure 7 shows the correlations as a function of collision centrality for different
regions in Cu+Cu collisions at (a) 200 and
(b) 62.4 GeV.
The different ranges used are shown. These ranges are chosen to demonstrate the dependence of the correlations among tracks sets at lower , at higher , and in a set where all available values are included.
The data points for ranges (in GeV/): 0.15-0.5, 0.5-2.0,
0.15-0.35, and 0.35-2.0, are shifted by one unit in .
The
correlation is maximum (minimum) for charged particles
whose is in 0.15–2.0 GeV/ (0.15–0.35 GeV/).
The correlation values are small and fairly independent of if
a lower bound for the particles studied is fixed at 0.15 GeV/ and the
upper bound is progressively increased up to 0.50 GeV/. When the
analysis is carried out by keeping the higher bound fixed at 2.0
GeV/ and subsequently decreasing the lower bound to 0.15 GeV/,
the correlation values are found to increase.
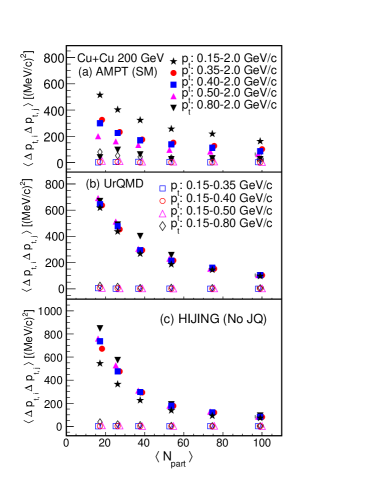
Figure 8 shows the variation of correlations as a
function of for different
windows as calculated using the (a) AMPT (string-melting),
(b) URQMD, and (c) HIJING (no jet quenching) model calculations for Cu+Cu
collisions at 200 GeV.
The AMPT calculations show correlations that are similar to
those observed in data for corresponding variations in the
windows.
The trend of the correlation values shown by both URQMD and HIJING is similar
to what is seen in the data for the low- windows where the lower
bound is fixed at 0.15 GeV/ and the upper bound is increased from
0.35 GeV/ to 0.50 GeV/.
However, for URQMD,
if the higher bound is fixed at 2.0 GeV/ and the lower bound
is subsequently decreased to 0.15 GeV/, correlation values
remain similar.
For the same case,
HIJING
shows a decrease in correlation values when the lower bound is
decreased to 0.15 GeV/.
This is just the opposite of what is observed
in data as seen in Fig. 7.
Figure 8: (Color online) Correlations for varying ranges
for different model calculations in Cu+Cu 200 GeV: (a) AMPT (SM),
(b) URQMD, and (c) Hijing (no JQ).
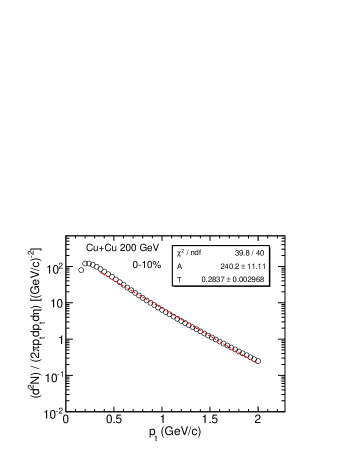
Figure 9: (Color online) Top panel: Uncorrected inclusive charged particle
spectrum for 0%–10% collision centrality for Cu+Cu 200 GeV (open circles).
The distribution is a fit to the exponential function:
(red dashed line).
Errors are statistical. Bottom panel: Correlations scaled by vs. for different ranges in Cu+Cu 200 GeV.
Because correlations are calculated for different ranges,
the acceptance effect on the
observed correlations, is examined.
The correlation values in different ranges may depend on the
range size and on the
fluctuations in the spectrum slope in that
range. It is, therefore, important to see the effect of slope fluctuations
on the correlation values in different ranges.
The correlations can be formulated in terms of the
fluctuations in the inverse slope parameter (effective temperature) by
the following relation voloshin_5 :
(7)
where describes the fluctuation in the inverse slope
parameter. The dependence
can be obtained from the function
that describes the inclusive uncorrected spectrum for the desired
range in the following manner. Figure 9 (top panel)
shows the measured inclusive
spectrum for 0%–10% collision centrality in Cu+Cu collisions
at 200 GeV. The dashed line represents the
exponential fit of the form
that is fit to these measurements for the
range 0.35–2.0 GeV/.
The expressions for and can be obtained using the following relation:
(8)
which gives,
(9)
Here, and are the lower and upper limits of a given
range, respectively.
The derivative of with respect to is obtained as:
(10)
where
(11)
Using the lower and upper limits of a given range, and the corresponding
from the spectrum fit for each range and collision
centrality,
are obtained
for every range in each centrality.
Figure 9 (bottom panel) shows
the measured two-particle correlations scaled by vs. for different ranges in Cu+Cu 200 GeV.
The data points for ranges (in GeV/): 0.4–0.8, 0.5–2.0,
1.2–1.6, and 0.35–2.0, are shifted by one unit in for clarity.
The scaled correlations for different ranges
become similar and show little dependence on the collision
centrality. This study seems to suggest that the difference in the
correlations for different ranges may due to the fluctuations in slope of the
spectrum in those ranges.
V Systematic Uncertainties
Systematic errors on the mean () and standard deviation () in the
distributions (discussed in Sec. III), and correlations
(discussed in Sec. IV) are mainly evaluated by varying the different
cuts used in the analysis,
re-doing the analysis using these changed cuts and determining the
resulting changes in the values of , , and the
correlations.
The difference is taken as the systematic error due to a particular
analysis cut.
The resulting systematic uncertainties, described below, are shown in
Tables 3 and 4
as a percentage of the result (, , and the
correlations) for various centralities for Cu+Cu collisions at both
62.4 and 200 GeV.
To study the effect of the z-vertex () cut,
the acceptance is increased to 50 cm from the default value of 30 cm.
No change in or or in the correlations is observed
when using the wider .
The effect of the cuts used to suppress background tracks is studied
by changing the DCA cut from the default, DCA 1 cm, to DCA 1.5
cm and separately, changing the required number of fit points along
the track, , from the default 20 to
15. The resulting systematic errors due to these
changes are listed in
Tables 3 and 4
in the columns labeled “DCA” and “”.
The effect of the size of the centrality bin on the
correlations is addressed by fitting as a function of (see
Sec. IV).
To determine the systematic uncertainty associated with this process,
different polynomial functions are used to fit vs. . The systematic
errors associated with this correction are listed in
Table 4
in the columns labeled “Poly.”.
The systematic uncertainty on the correlations that
may be associated with the application of the low-
cut is estimated by removing this cut in the HIJING hijing_5 model
calculations. The estimated systematic errors are shown in
Table 4
in the columns labeled “Low ”.
Table 3:
Systematic errors on and in event-wise distributions
as described in Sec. III for various collision centralities in Cu+Cu collisions
at = 62.4 and 200 GeV.
Cu+Cu 62.4 GeV
Cu+Cu 200 GeV
% cross
DCA
DCA
DCA
DCA
section
(%)
(%)
(%)
(%)
(%)
(%)
(%)
(%)
0-10
3.6
0.4
7.9
1.0
3.4
0.24
5.7
1.2
10-20
3.6
0.4
7.1
1.0
3.3
0.23
5.2
1.2
20-30
3.6
0.4
6.6
1.0
3.3
0.23
5.2
1.1
30-40
3.6
0.4
6.2
1.0
3.3
0.20
4.7
1.2
40-50
3.6
0.4
6.0
1.0
3.2
0.20
4.9
1.1
50-60
3.6
0.4
6.0
1.0
3.2
0.22
4.4
1.2
Table 4:
Systematic errors on correlations
as described in Sec. IV for various collision centralities in Cu+Cu collisions at 62.4 GeV
and 200 GeV.
Cu+Cu 62.4 GeV
Cu+Cu 200 GeV
% cross
DCA
Poly.
Low
DCA
Poly.
Low
section
(%)
(%)
(%)
(%)
(%)
(%)
(%)
(%)
0-10
30
1.4
1.9
7.2
16
0.05
1.9
22
10-20
23
0.8
3.6
13.1
13
0.09
3.6
3.2
20-30
18
0.6
1.9
3.4
13
1.1
1.9
12.3
30-40
17
1.0
0.004
9.0
8
1.2
0.004
9.7
40-50
19
3.0
0.009
1.0
10
2.0
0.009
8.4
50-60
20
3.6
0.009
4.0
7
5.0
0.009
8.3
The correlations may also include short range correlations such as
Coulomb interactions and Hanbury Brown-Twiss (HBT) correlations. These correlations
usually dominate among pairs of particles having relative transverse momentum
less than 100 MeV/. The effect of
these short-range correlations on the measured correlations is seen by calculating correlations
after removing the pairs of particles with relative momentum (), less than
100 MeV/.
The correlations are reduced by a maximum of
6% when short-range correlations are excluded.
The correlations also include the contributions from resonance decays and charge ordering.
These correlations are obtained for pairs of
particles having like (++ or ) and unlike () charges with respect to
inclusive charged particles.
A maximum of 15% decrease in the correlations is observed for pairs of particles
with like charges and about 12% increase is observed for pairs with unlike charges
with respect to the correlations for inclusive charged particle pairs for Cu+Cu
collisions at 62.4 GeV and 200 GeV.
VI Summary
We have reported measurements of fluctuations in Cu+Cu
collisions in the STAR detector at RHIC for 62.4 and
200 GeV, and compared with Au+Au collisions at the same energies to
investigate the system size dependence.
The dynamical fluctuations are observed by comparing data to mixed events in both Cu+Cu
and Au+Au collisions at these two beam energies. Moreover, for similar
mean number of participating nucleons, the fluctuations are observed
to be comparable for the Cu+Cu and Au+Au systems, suggesting that the
system size has little effect.
In addition, correlation measurements for Cu+Cu collisions at 62.4
and 200 GeV are compared with the published Au+Au measurements.
For both Cu+Cu and Au+Au systems, the correlation decreases with
increasing at both beam energies.
The dilution of the correlations with increasing could be due to the decrease in correlations
that are dominated by pairs of particles that originate from the same
nucleon-nucleon collision. A similar observation is found with other fluctuation and
correlation observables such as k2pi_star and
net charge netch_star .
The correlations are found to scale with number of participating
nucleon pairs for (when the
system size is larger than that of central Cu+Cu collisions).
This might indicate
the onset of thermalization gavin_5 , the onset of jet quenching steph4_5 ; jetq2_5 , or the saturation of transverse flow in central collisions tflow_5 .
The square root of the correlations normalized by eventwise
average transverse momentum for Cu+Cu and
Au+Au collisions is similar for systems with similar and is independent of the beam
energies studied.
The results described above are compared to predictions from several
relevant model calculations.
The transport-based URQMD model calculations are found to have a
better quantitative agreement with the measurements compared to models
which incorporate only jet-like correlations as in HIJING. HIJING
gives similar dependence on , but
under predicts the magnitude. Inclusion of the jet-quenching effect in HIJING leads to a smaller value of the correlations in central collisions. A multiphase transport model calculation incorporating coalescence as a mechanism of particle production also compares well with data for central collisions.
When studying the correlations for different intervals, the correlations
appear to be small and fairly independent
of interval,
if the lower bound is fixed at 0.15 GeV/ and
the higher bound is progressively
increased up to 0.50 GeV/. This suggests that correlations are weak for low-
particles. This low- trend observed in the data is also seen in
URQMD, AMPT, and HIJING models. When the analysis is carried out
keeping the higher bound fixed at 2.0 GeV/ and progressively
decreasing the lower bound to = 0.15 GeV/, the correlation
values in data are found to increase. This suggests that high
particles are more correlated with low- particles. The AMPT model shows
a rather similar variation of correlations for different intervals,
as observed in data.
The URQMD model calculations, however, show
no such variations in correlations for the different intervals
with higher bound fixed at 2.0 GeV/.
Finally, it is noted that the HIJING model calculations give correlations
that decrease with a decrease in the lower bound
for intervals with fixed higher (= 2.0 GeV/) bound,
i.e.,
opposite to what is observed in data.
Regarding the changes in correlations in different
intervals,
it is found that
the resultant fluctuations after considering
event-by-event variation in the slope of the spectra for different
bins are all of similar order.
The variation of correlation with the change in the accepted range
of pseudorapidity and azimuthal angle of the produced particles, are
also shown.
The correlation values increase when the - and
the -acceptance are reduced.
VII Acknowledgements
We thank the RHIC Operations Group and RCF at BNL, the NERSC Center at
LBNL and the Open Science Grid consortium for providing resources and
support. This work was supported in part by the Offices of NP and HEP
within the U.S. DOE Office of Science, the U.S. NSF, the Sloan
Foundation, CNRS/IN2P3, FAPESP CNPq of Brazil, Ministry of Education
and Science of the Russian Federation, NNSFC, CAS, MoST, and MoE of
China, GA and MSMT of the Czech Republic, FOM and NWO of the
Netherlands, DAE, DST, and CSIR of India, the Polish Ministry of
Science and Higher Education, the National Research Foundation
(NRF-2012004024), the Ministry of Science, Education and Sports of the Republic of Croatia, and RosAtom of Russia.
References
(1) H. Heiselberg, Phys. Rep. 351, 161 (2001).
(2)
H. Appelshauser et al. (NA49 Collaboration),
Phys. Lett. B 459, 679 (1999);
D. Adamova et al. (CERES Collaboration),
Nucl. Phys. A 727, 97 (2003);
K. Adcox et al. (PHENIX Collaboration),
Phys. Rev. Lett. 89, 212301 (2002).
(3)
S. S. Adler et al. (PHENIX Collaboration),
Phys. Rev. Lett. 93, 092301 (2004).
(4)
J. Adams et al. (STAR Collaboration),
Phys. Rev. C 71, 064906 (2005).
(5)
M. M. Aggarwal et al. (WA98 Collaboration),
Phys. Rev. C 65, 054912 (2002).
(6) K. Adcox et al. (PHENIX Collaboration),
Phys. Rev. C 66, 024901 (2002).
(7) J. Adams et al.,(STAR Collaboration),
J. Phys. G 34, 451 (2007);
J. Phys. G 32, L37 (2006).
(8) M. Stephanov, K. Rajagopal and E. Shuryak,
Phys. Rev. Lett. 81, 4816 (1998).
(9) M. Stephanov, K. Rajagopal and E. Shuryak, Phys. Rev. D 60,
114028 (1999).
(10) M. Stephanov, Phys. Rev. D 65, 096008 (2002).
(11) Q. Liu and T. A. Trainor, Phys. Lett. B 567, 184 (2003).
(12) J. D. Bjorken and E. A. Paschos,
Phys. Rev. 185, 1975 (1969).
(13) L. Stodolsky, Phys. Rev. Lett. 75, 1044 (1995).
(14) S. Mrowczynski, Phys. Lett. B 430, 9 (1998).
(15) K. Rajagopal,
hep-ph/9808348.
(16) B. Berdnikov and K. Rajagopal, Phys. Rev. D. 61, 105017 (2000);
(17) S. A. Voloshin, V. Koch and H. G. Ritter, Phys. Rev. C 60,
024901 (1999).
(18) S. A. Bass, M. Gyulassy, H. Stöcker and W. Greiner, J. Phys. G 25, R1 (1999).
(19) S. A. Bass, P. Danielewicz and S. Pratt, Phys. Rev. Lett. 85,
2689 (2000).
(20) S. Jeon and V. Koch, Phys. Rev. Lett. 85, 2076 (2000).
(21) M. Asakawa, U. Heinz and B. Müller, Phys. Rev. Lett. 85, 2072 (2000).
(22) Z.-W. Lin and C. M. Ko, Phys. Rev. C 64, 041901(R) (2001).
(23) H. Heiselberg and A. D. Jackson, Phys. Rev. C 63, 064904 (2001).
(24) E. V. Shuryak and M. A. Stephanov, Phys. Rev. C 63, 064903
(2001).
(25) C. Pruneau, S. Gavin and S. Voloshin, Phys. Rev. C 66, 044904 (2002).
(26) S. Gavin, Phys. Rev. Lett. 92, 162301 (2004).
(27)
M. Rybczynski et al. (for NA49 Collaboration),
J. Phys. G 35, 104091 (2008).
(28) T. Anticic et al. (NA49 Collaboration),
Phys. Rev. C 79, 044904 (2009); K. Grebieszkow (for the NA49 and NA61 Collaborations), Acta
Phys. Polon. B 41,
427 (2010).
(29)
B. I. Abelev et al. (STAR Collaboration), Phys. Rev. C 81,
024911 (2010); STAR Internal Note-SN0493, 2009; arXiv:1007.2613;
L. Kumar (STAR Collaboration), Nucl. Phys. A 830, 275C (2009);
L. Kumar (STAR Collaboration) ibid.862, 125 (2011); B. Mohanty ibid. 830, 899C (2009).
(30) J. Adams et al. (STAR Collaboration),
Phys. Rev. C 72, 044902 (2005).
(31) F. S. Bieser et al., Nucl. Instr. Meth. A 499, 766 (2003).
(32)
K. H. Ackermann et al. (STAR Collaboration),
Nucl. Instr. Meth. A 499, 624 (2003).
(33)
H. Bichsel, Nucl. Instr. Meth. A 562, 154 (2006).
(34)
B. I. Abelev et al. (STAR Collaboration),
Phys. Rev. C 79, 034909 (2009);
R. L. Ray and M. S. Daugherity, J. Phys. G: Nucl. Part. Phys. 35,
125106 (2008);
D. Kharzeev and M. Nardi, Phys. Lett. B 507, 121 (2001);
A. Timmins, Ph. D. Thesis, University of Birmingham, 2008 (unpublished).
(35) M. J. Tannenbaum, Phys. Lett. B 498, 29
(2001).
(36) S. V. Afanasiev et al. (NA49 Collaboration),
Phys. Rev. Lett. 86, 1965 (2001).
(37)
B. I. Abelev et al. (STAR Collaboration),
Phys. Rev. Lett. 103, 092301 (2009).
(38)
S. A. Voloshin,
Phys. Lett. B 632, 490 (2006).
(39) S. A. Bass et al., Prog. Part. Nucl. Phys. 41, 255 (1998);
M. Bleicher et al., J. Phys. G 25, 1859 (1999).
(40) Z.-W. Lin and C. M. Ko, Phys. Rev. C 65, 034904 (2002); Z.-W.
Lin, C. M. Ko, B. A. Li, B. Zhang, and S. Pal, ibid.72, 064901
(2005); L.-W. Chen et al., Phys. Lett. B 605, 95 (2005).
(41) X. N. Wang and M. Gyulassy, Phys. Rev. D 44, 3501
(1991).
(42)
B. Andersson, G. Gustafson, G. Ingelman, and T. Sjostrand,
Phys. Rep. 97, 31 (1983).
(43)
B. I. Abelev et al. (STAR Collaboration),
Phys. Rev. C 79, 024906 (2009).