Discovery of Relativistic Outflow in the Seyfert Galaxy Ark 564
Abstract
We present Chandra high energy transmission grating spectra of the narrow-line Seyfert-1 galaxy Ark 564. The spectrum shows numerous absorption lines which are well modeled with low velocity outflow components usually observed in Seyfert galaxies (Gupta et al. 2013). There are, however, some residual absorption lines which are not accounted for by low-velocity outflows. Here we present identifications of the strongest lines as transitions of O vii(two lines) and O vi at outflow velocities of . These lines are detected at , , and respectively and cannot be due to chance statistical fluctuations. Photoionization models with ultra-high velocity components improves the spectral fit significantly, providing further support for the presence of relativistic outflow in this source. Without knowing the location of the absorber, its mass and energy outflow rates cannot be well constrained; we find lower limit of % assuming a bi-conical wind geometry. This is the first time that absorption lines with ultra-high velocities are unambiguously detected in the soft X-ray band. The presence of outflows with relativistic velocities in AGNs with Seyfert-type luminosities is hard to understand and provides valuable constraints to models of AGN outflows. Radiation pressure is unlikely to be the driving mechanism for such outflows and magneto-hydrodynamic may be involved.
1 Introduction
There have been reports of ultra-high velocity outflows in the X-ray spectra of radio-quiet AGNs and quasars. These outflows are identified through blue-shifted Fe xxv and/or Fe xxvi absorption lines (at rest-frame energies of 7-10 keV) from highly ionized gas (111The ionization parameter , where is the ionizing luminosity between 1 Ryd and 1000 Ryd (1 Ryd=13.6 eV), n is the number density of the material and r is the distance of the gas from the central source. erg scm), with column densities as large as cm-2, and with relativistic velocities of 0.1c–0.3c (Pounds et al. 2003a; b, Tombesi et al. 2010, and references therein). The mass outflow rate of these high velocity outflows were comparable to the accretion rate and their kinetic energy was a significant fraction of the bolometric luminosity (Tombesi et al. 2012). These outflows can provide effective feedback that is required by theoretical models of galaxy formation to solve a number of astrophysical problems ranging from cluster cooling flows to structures of galaxies.
Although high velocity outflows are detected in a large number of sources, in all the cases identification are based on Fe K-shell transitions which fall in a region of the spectrum where instrumental resolution is much lower than in the soft X-ray band. The significance of the absorption line detections is often questioned and with only a few lines observed, accurate parametrization of the photoionized plasma becomes difficult. While the observed transitions are from highly ionized gas (ers scm), photoionization models predict that in such a plasma in addition to highly ionized iron, lighter elements should also be present, strongest of which are S, Si and O (e.g., Sim et al. 2010, Krongold et al. 2003). Absorption lines from these highly ionized elements lie in the soft X-ray band, so warm absorber signatures of relativistic outflows at soft X-rays should be present, but were never unambiguously observed until now (see §5.3 for existing evidence). For complete understanding of the properties of high velocity outflows it is necessary to detect transitions of other ions such as of O, Ne, Si and S as predicted by models.
In this paper, we report the serendipitous discovery of high velocity outflows in the soft X-ray band in Ark 564 (catalog ), identified during our detailed analysis of the Chandra archival data of this source (Gupta et al. 2013, hereafter Paper I).
Primary goal of Paper I was to self consistently analyze and model the grating spectra of typical (km s-1) warm absorbers in Ark 564 (catalog ). Here we present the discovery of warm absorbers (WA) with ultra-high velocities.
2 Data and Spectral Analysis
Ark 564 (catalog ) is a bright, nearby (), narrow-line Seyfert 1 (NLS1) galaxy, with luminosity of ergs s-1 (Turner et al. 2001, Matsumoto et al. 2004, Paper I). In Paper-I we have discussed the Chandra observation and data reduction of this source which we briefly summarize here. Ark 564 (catalog ) was observed with the Chandra High Energy Transmission Grating Spectrometer (HETGS) in 2008 in three separate exposures totaling 250 ks. We followed the standard procedure to extract spectra. We used the software package CIAO (Version 4.3) and calibration database CALDB (Version 4.4.2) developed by the Chandra X-ray center. We co-added the negative and positive first-order spectra and built the effective area files (ARFs) for each observation using the fullgarf CIAO script. The HETG-MEG spectra were analyzed using the CIAO fitting package Sherpa.
We co-added the spectra obtained with HETG-MEG and averaged the associated ARFs. We fitted the continuum with absorbed power law plus black body component and modeled all the statistically significant local absorption () features with Gaussian components. Further we used the photoionization model fitting code PHotoionized Absorption Spectral Engine (PHASE; Krongold et al. 2003), to fit the typical warm absorber features. The best fit model of intrinsic absorption requires two warm absorbers with two different ionization states (222The ionization parameter , where Q(H) is the rate of H ionizing photons, r is the distance to the source, is the hydrogen number density and c is the speed of light. For the Ark 564 (catalog ) spectrum, and ), both with moderate outflow velocities (km s-1) and relatively low line of sight column densities (cm-2). For detailed spectral analysis and best fit parameters, we refer readers to Paper-I.
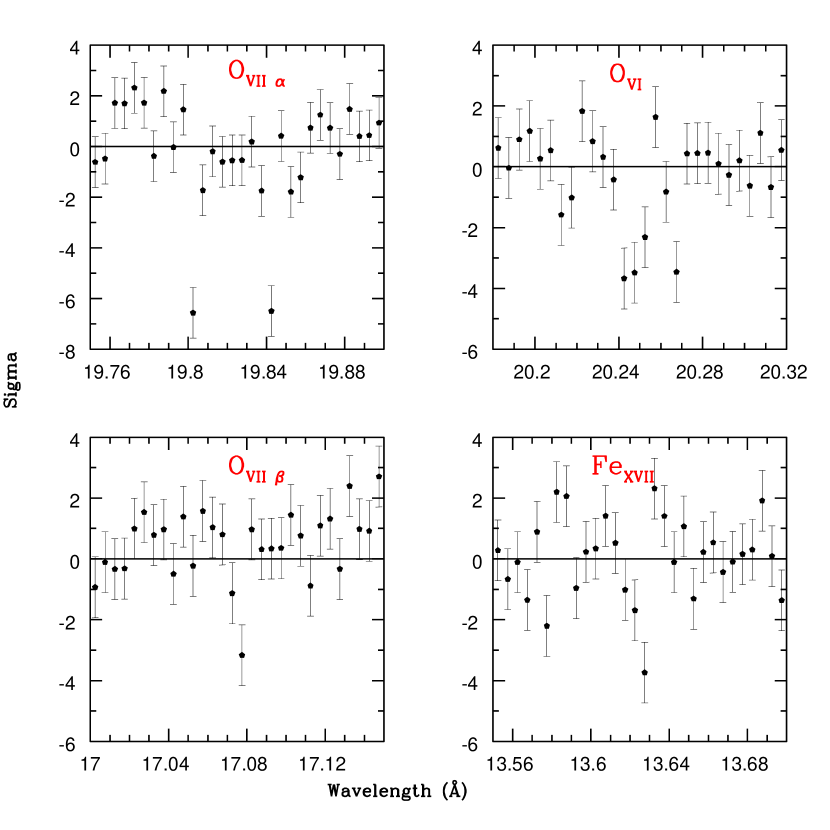
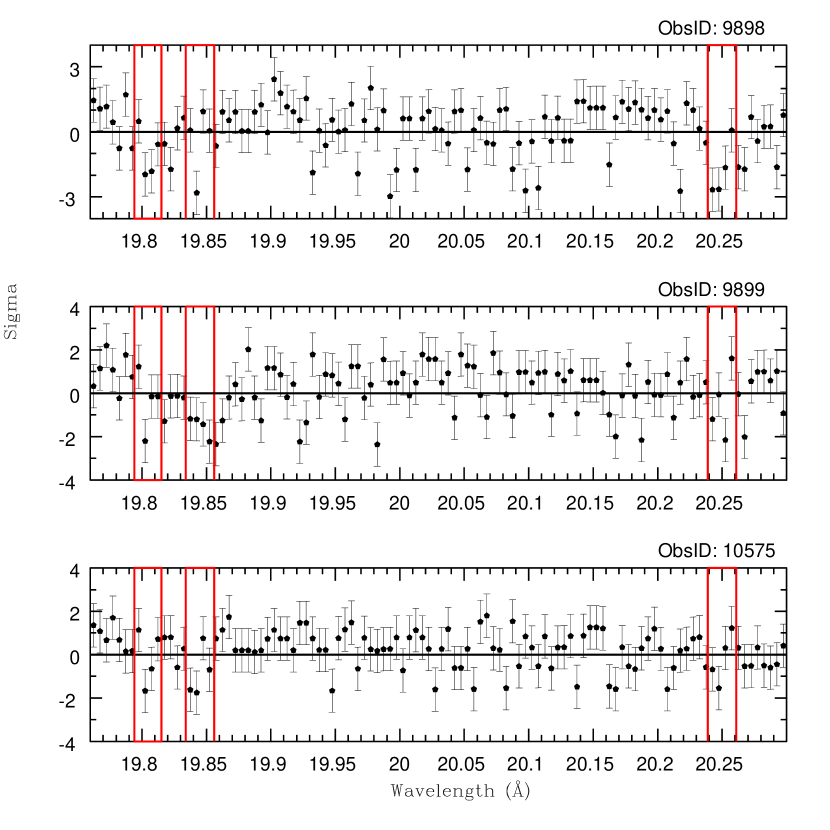
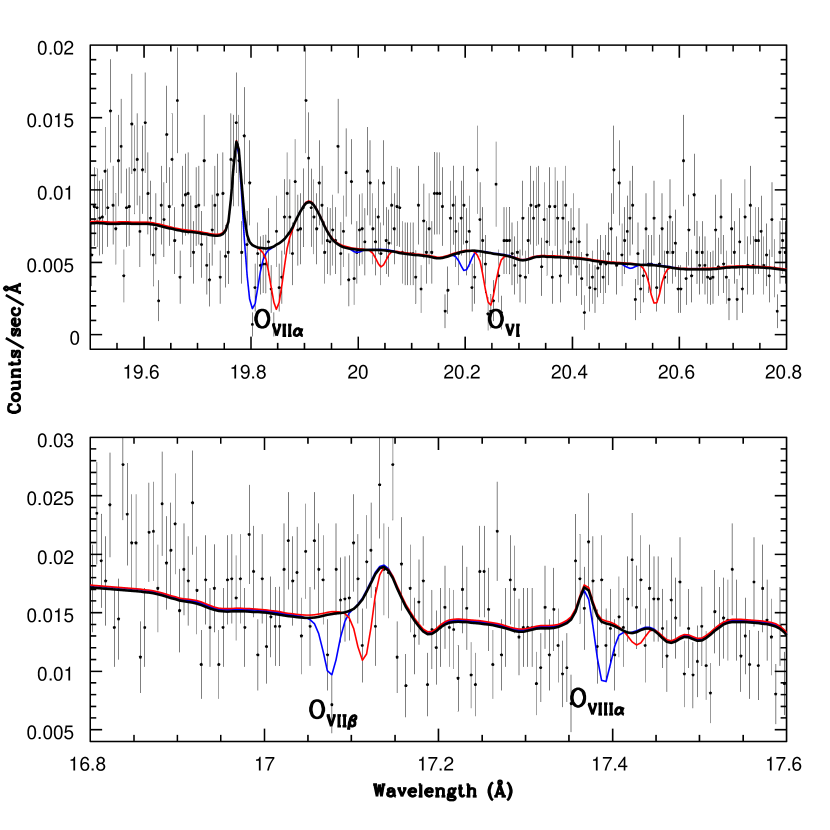
Though most of the intrinsic absorption features in the source spectrum are well fitted with two warm absorbers, there are residual absorption line-like features in the spectral regions of , and each with individual significance of sigma (Fig. 1). To check for the consistency of these residuals and to confirm that these are not the artifacts of co-adding spectra, we inspect individual Ark 564 (catalog ) HETGS-MEG spectra from the 2008 observations. After fitting the data with continuum, Galactic and two-phase WAs model (Model-A) as noted above, the same residuals are found in the same spectral region in all the three observations (Fig. 2). In the following sections, we discuss the identifications, statistical significance and possible origin of these absorption lines.
3 Discovery of high velocity outflows
3.1 Identification of the Absorption Lines
The strongest residual features in the co-added spectrum are present at , and (observed frame, Fig. 1). Errors refer to confidence level throughout the paper, unless noted otherwise. First we try to identify the features at and . There is no known instrumental feature near these energies (Chandra Proposers’ Observatory Guide, or POG). The z=0 lines are already included in the model; there are no permitted lines with oscillator strength at wavelength of either or . At the observed energies, there would be no intervening system with from the warm-hot intergalactic medium (WHIM; Mathur et al. 2003, Nicastro et al. 2005). Therefore, we assume that these absorption lines are intrinsic to the source. We identify these lines based on a combination of chemical abundance and line strength (the oscillator strength ). Given the detected wavelength and assuming a very broad range of inflow/outflow velocities to km s-1 the likely candidates are O vii at , O viii at , Ca xvii at , Ca xvi at , Ar xiv at , Ca xvi at and O vii at . Considering that argon and calcium are orders of magnitude less abundant than oxygen, and because O vii and O viii are by far the strongest possible lines, the most likely candidates are O viii with inflow velocities of and , or O vii with outflow velocities of and .
To distinguish between the two possibilities of inflow and outflow, we search for possible associations of other lines such as O viii , O vii , O vi and/or O v . We do not find any possible association for inflows. The absorption feature at corresponds to O vi () at the outflow velocity of . We also found an absorption feature at with significance, corresponding to O vii line at the outflow velocity of . The detection of O vi and O vii lines at the same velocity favors the outflow scenario.
3.2 Statistical Significance of Absorption Lines
To investigate whether the apparent absorption lines could be due to statistical fluctuations, we calculate the probability of detection of individual lines due to random statistical fluctuation. First we fit the lines with negative gaussians of fixed width 0.001Å, folding through the detector response and leaving other parameters (centroid and amplitude) free to vary. The addition of three gaussian lines at , and to our previous model (Model A) improves the fit statistic by , an improvement at more than 99.99% confidence by the F-test (Bevington and Robinson 1992). We measured the equivalent width (EW) of lines at , and of mÅ, mÅ and mÅ respectively. Errors are at 1 sigma confidence level and are calculated using the “projection” command in Sherpa. Thus the three absorption lines are detected with , and significance respectively. Further, using the Gaussian probability distribution, we looked for the probability of detection of these lines by chance. For the lines detected with , and significance, the probability of false detection is , and respectively. There are, however, 4801 wavelength bins in our spectrum (these are all the wavelength bins in the wavelength range of , beyond which data is of poor quality. The rest of the HETG spectrum was never used in any of the analysis, even in Paper I). Therefore the probability of finding absorption lines at the observed significance anywhere in the spectrum due to random statistical fluctuations is %, % and % respectively.
For the outflow system with velocity of , we also detected the O vii K line with chance probability of . Thus the combined chance detection probability of detecting both O vii K and O vii K lines is %. Similarly for the other system (at ) the combined chance detection probability of detecting both O vii K and O vi K is %. Thus we conclude that the detected absorption lines are not due to random statistical fluctuations, but are signatures of outflows.
3.3 Other Absorption lines at blueshift of
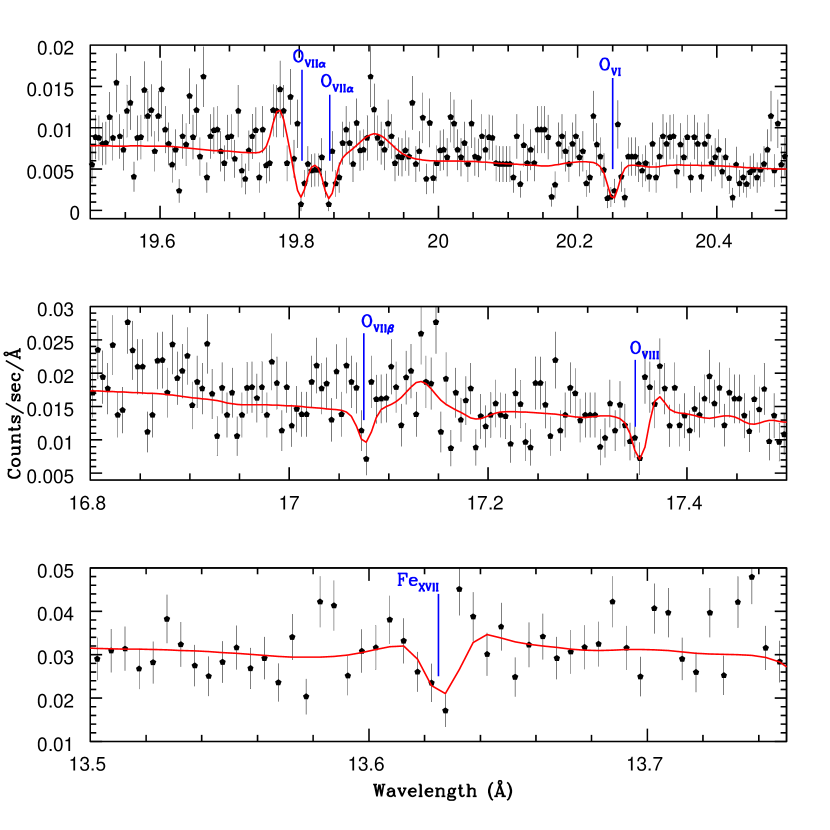
After confirming the high detection significance of O vii and O vi absorption lines identified with high velocity outflows, we searched the entire spectrum for other ionic transitions at similar blueshifts. We detected two other absorption features at and with EWs of and m (Fig. 3, Table 1). The feature at is also detected in the HEG spectrum. The tentative identification of these features are O viii and Fe xvii at outflow velocities and respectively. The outflow velocities of these systems are close to each other and to the above reported systems of high velocity outflow.
4 Photoionization Modeling of High Velocity Outflows
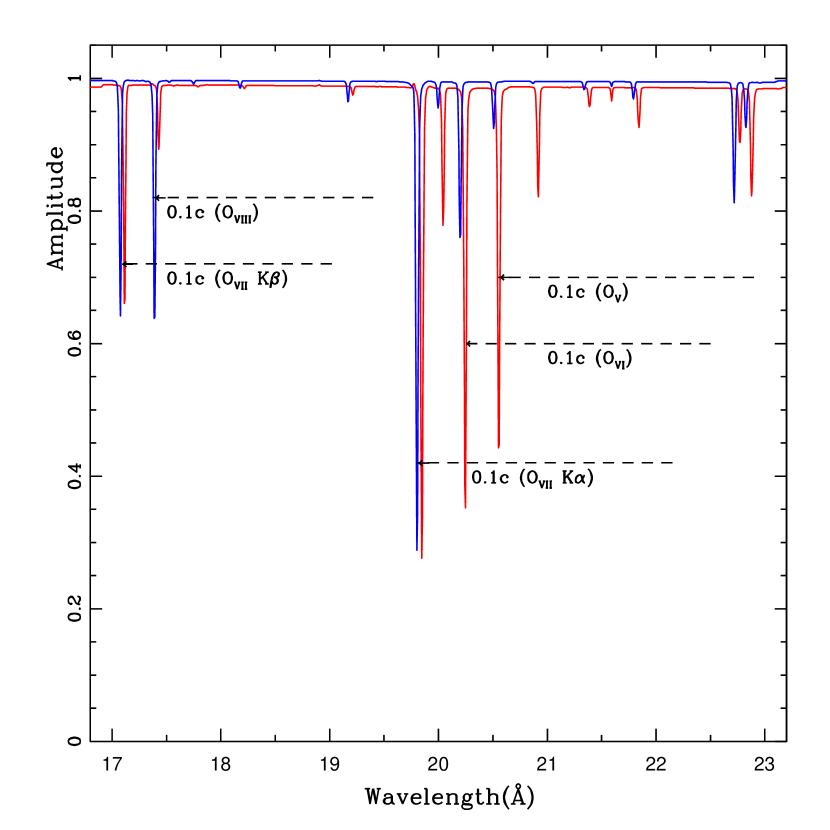
To determine the physical properties of the absorber responsible for producing highly blueshifted absorption features and to check for the physical consistency of line identifications, we modeled the negative Gaussian lines in the above fits with a photoionization model based on the code PHASE (Krongold et al. 2003). The PHASE code models self-consistently more than 3000 X-ray bound-bound and bound-free transitions imprinted by photoionized absorbers, given the ionization state of the absorber, its column density, and its internal turbulent motion. The parameters of the code are: 1) ionization parameter U; 2) equivalent hydrogen column density ; 3) outflow velocity of the absorbing material , and 4) micro-turbulent velocity of the material. The abundances have been set at the Solar values (Grevesse et al. 1993). Usually, the micro-turbulent velocity is not left free to vary, because different transitions due to ionized gas are heavily blended, or because different velocity components are also blended and cannot be resolved (e.g. Krongold et al. 2003, 2005 for NGC 3783). In the case of Ark 564 (catalog ), with the HETGS resolution, it is possible to distinguish two velocity components (see below). So, despite the fact that the individual absorption lines cannot be resolved, we have left the micro-turbulent velocity free to vary. We used the Ark 564 (catalog ) spectral energy distribution (SED) from Romano et al. (2004) to calculate the ionization balance of the absorbing gas in PHASE, same as in Paper-I.
A PHASE component (which we call system 1) with ionization parameter of and column of cm-2 successfully reproduced the O vii K and K lines at and , at the blueshift of km s-1 with respect to source (Fig. 4). The addition of PHASE component “System 1” to Model-A significantly improves the fit (). According to F-test, the absorber is present at confidence level of %. A second low ionization parameter component (we call this system 2) with and column of cm-2 is also required to fit other high velocity outflow absorption features such as of O vii and O vi , with outflow velocity of km s-1 (Fig. 4). Inclusion of this component improves the fit (, ) over the previous model at a confidence level of more than 99.999%, according to F-test. The best fit PHASE parameters are reported in Table 2 and the best fit model are shown in Fig. 5. Successfully modeling the residuals with two PHASE components robustly confirms the presence of high velocity outflows in Ark 564 (catalog ).
5 Discussion
5.1 Comparison with Theoretical Models
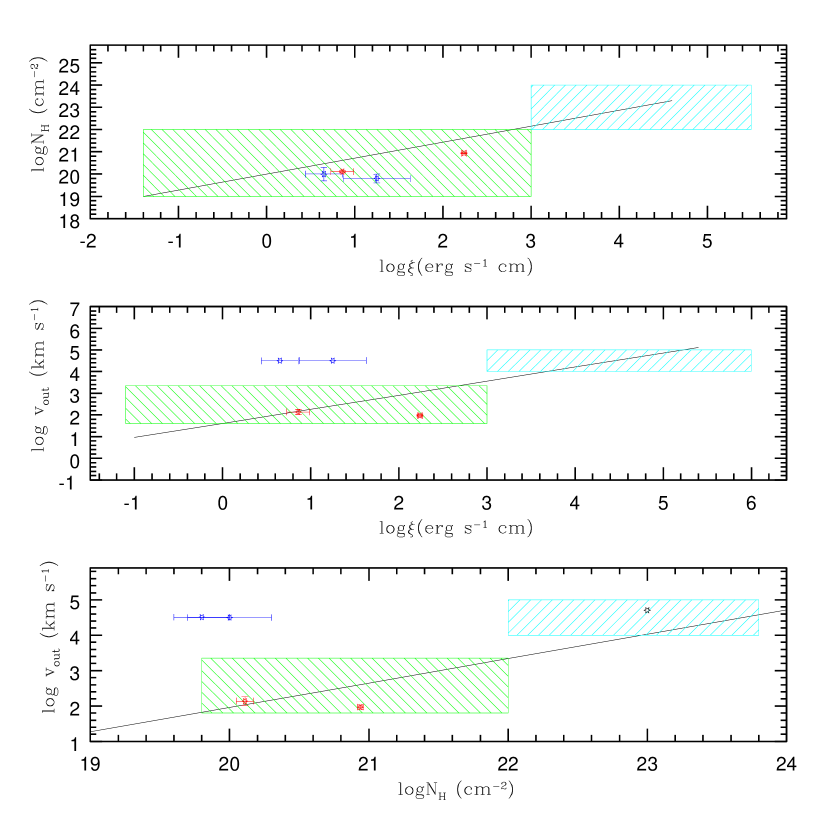
Several models suggest radiation pressure as the driving mechanism to produce the typical low velocity outflows observed in Seyfert galaxies (Proga & Kallman 2002; 2004, Krolik & Kriss 1995, Dorodnitsyn et al. 2008). But in radiation driven disk-wind models outflow velocities depend on AGN luminosity and these models cannot account for relativistic velocities in AGNs with Seyfert-type luminosities (Barai et al. 2011). Relativistic outflows in the UV have been detected only in most luminous broad absorption line quasars. Indeed, Laor & Brandt (2002) and Ganguly et al. (2008) have shown that the maximum outflow velocity is proportional to , close to what is expected from radiation pressure driven winds. Observations of relativistic outflows in X-rays in moderate luminosity AGNs therefore pose intriguing puzzles; as shown in figure 6, the relativistic outflows (from Tombesi et al. 2011) lie above the Ganguly et al. line of maximum velocity. The relativistic outflow we find in Ark 564 (catalog ), shown as a in figure 6, also lies above the line. Thus these high velocity outflows appear not to be driven by radiation line pressure mechanism.
King (2010) shock wind models produce winds with velocities , but in quasars accreting at Eddington limits. In this model a high velocity ionized outflow collides with the ISM of the host galaxy, losing much of its energy by efficient cooling resulting in a strongly shocked gas.
In the multi-dimensional Monte Carlo simulations of AGN disk-wind models of Sim et al., outflow velocities are assumed to be at escape velocities, and not from ab-initio calculations (Sim et al. 2008; 2010). It is possible that magnetic fields are important for launching such winds, as in jets (Sim et al. 2010); observations of relativistic outflows in moderate luminosity AGNs provide valuable constraints to the theory of magneto-hydrodynamic winds.
The magneto-hydrodynamic accretion-disk wind models of Fukumura et al. (2010a; b) predict high-velocity () outflows from ab-initio calculations. These models, however, explain only the high-ionization high-velocity outflows, similar to those observed by Tombesi et al. (2012). In these models, ultra-high velocities are produced when UV to X-ray spectral slope is steep (), i.e. the AGNs are relatively UV bright (or X-ray faint). Another feature of these models is that density scales as , leading to a clear prediction that the outflow velocity depends on ionization parameter. Perhaps some of the model assumptions can be modified to explain the ultra-high velocity warm absorbers we present here.
5.2 Mass and Energy Outflow Rates
In Paper-I we have showed that the typical warm-absorbers in Ark 564 (catalog ) (km s-1) are not energetic enough to provide the effective feedback as required by theoretical models. Here we estimate the total mass and kinetic energy outflow rate of relativistic outflows in Ark 564 (catalog ) to determine if these can possibly be important for feedback. To measure the mass and energy outflow rates, we must know the location of the absorber which is measured only in a few sources (e.g. NGC 4051, Krongold et al. 2007). Since we do not know the location of the high velocity outflow in Ark 564 (catalog ), we estimate the mass and energy outflow rates in several different ways.
It is often assumed that the observed outflow velocity is the escape velocity at the launch radius : i.e. . There is no justification for this assumption, as shown by Mathur & Stoll (2009). Nonetheless, making this assumption provides us with a lower limit on the absorber location. Romano et al. (2004) determine the central black hole mass of Ark 564 (catalog ) to be . This leads to the minimum distance of system 1 and system 2 absorbers of and respectively (in units of the Schwarzschild radius; for Ark 564 (catalog ) pc). The estimate of maximum distance from the central source can be derived assuming that the depth of the absorber is much smaller than the radial distance of the absorber () and using the definition of ionization parameter (), i.e. . Using the best fit values of ionization parameter and column density, we estimated the upper limits on system 1 and system 2 absorber locations of kpc and kpc respectively, which are not very interesting limits.
For a bi-conical wind, the mass outflow rate is (Krongold et al. 2007). Substituting with and using outflow velocities of 32365 km s-1 and 31735 km s-1, we obtain lower limit on mass outflow rates of g s-1 and g s-1 for system 1 and system 2 absorbers respectively. Similarly we obtained the constraints on kinetic luminosity of the outflows of erg s-1 and erg s-1 for the system 1 and system 2 absorbers respectively. In comparison to the Ark 564 (catalog ) bolometric luminosity of erg s-1, the total kinetic luminosity of these high velocity outflows is %. This lower limit is much smaller than the ratio of % expected if the outflow is to be important for feedback (Hopkins & Elvis 2010, Silk & Rees 1998, Scannapieco & Oh 2004, di Matteo et al. 2005).However, with very large uncertainties between and , the ratio between the mechanical power of these outflows and the bolometric luminosity cannot be well constrained.
5.3 Comparison with other high velocity outflows
Before this work, the high velocity outflows were detected mostly with Fe xxv and/or Fe xxvi absorption lines in hard X-ray band (§1). In a handful of quasar such as PG11211+143 (Pounds et al. 2003a), PG0844+349 (Pounds et al. 2003b) and MR 2251-178 (Gibson et al. 2005) high velocity outflows were detected at soft X-ray energies, but these detections were either based on absorption lines of low statistical significance or have strong contamination from absorption lines from the halo of our Galaxy.
Here we present the detection of high velocity outflows in Ark 564 (catalog ); this is the first time such outflows are found in the soft X-ray band in a Seyfert galaxy. We firmly establish the presence of high velocity WAs first through identifying number of ionic transitions at similar velocity and further successfully modeling these features with photoionization models. Papadakis et al. (2007) also detected an absorption line at 8.1 keV in the low resolution CCD spectra of Ark 564 (catalog ) and assuming that this line corresponds to Fe xxvi , they suggested the presence of highly ionized, absorbing material of cm-2 outflowing with relativistic velocity of 0.17c. If the presence of such a feature and its identification are correct, then this is suggestive of a velocity gradient with higher charge states such as Fe xxvi at higher velocity. Interestingly, the two “other” lines we identified in Ark 564 (catalog ) (§3.0.3) also have somewhat higher velocity than System 1 and System 2 and have higher charge states. This is exactly as expected from the models of King (2010) and Fukumura et al. (2010a; b).
Recently Tombesi et al. (2013) presented the connection between ultra-fast outflows (UFOs) and soft X-ray WAs. They strongly suggest that these absorbers represent parts of a single large-scale stratified outflow and they continuously populate the whole parameter space (ionization, column, velocity), with the WAs and the UFOs lying always at the two ends of the distribution (Fig. 7). The Ark 564 (catalog ) low-velocity WAs (Paper-I) and UFOs (Papadakis et al.) are in well agreement with linear correlation fits from Tombesi et al. 2013. However, our low-ionization low-column high-velocity outflows in the Ark 564 (catalog ) probe a completly different parameter space. Figure 7 clearly shows that Ark 564 (catalog ) high-velocity outflows have ionization parameter and column density as of typical WAs, but much higher velocity, probing a distinct region in velocity versus ionization/column parameter space.
6 Conclusion
We report on the discovery of high velocity outflows in the NLS1 Galaxy Ark 564 (catalog ). These absorbers are identified through multiple absorption lines of O vi , O vii , O vii , O viii and Fe xvii at blueshifts of (with respect to the source) detected in the Chandra HETG-MEG spectra. The two observed velocity components are well fitted with two photoionization model components. Both absorbers have low ionization parameter of and and low column densities of and cm-2 and are required at high significance of 99.87% and 99.99% respectively.
Without knowing the location of the absorber, its mass and energy outflow rates cannot be well constrained; we find lower limit of % assuming a bi-conical wind geometry. Determining the absorber location is therefore very important for providing meaningful constraints. This can be achieved through studying the response of absorption lines to continuum variations. This is the first time that absorption lines with ultra-high velocities are unambiguously detected in the soft X-ray band. The presence of outflows with relativistic velocities in AGNs with Seyfert-type luminosities is hard to understand and provides valuable constraints to models of AGN outflows. Radiation pressure is unlikely to be the driving mechanism for such outflows and magneto-hydrodynamic may be involved. Finding such relativistic outflows in several other AGNs and measuring their mass/energy outflow rates is therefore important.
Acknowledgement: Support for this work was provided by the National Aeronautics and Space Administration through Chandra Award Number TM9-0010X issued by the Chandra X-ray Observatory Center, which is operated by the Smithsonian Astrophysical Observatory for and on behalf of the National Aeronautics Space Administration under contract NAS8-03060. YK acknowledges support from CONACyT 168519 grant and UNAM-DGAPA PAPIIT IN103712 grant.
References and Notes
- Barai et al. (2011) Barai, P., Proga, D., & Nagamine, K. 2011, MNRAS, 418, 591
- di Matteo et al. (2005) di Matteo, T., Springel, V., Hernquist, L. 2005, Nature, 433, 604
- Dorodnitsyn et al. (2008) Dorodnitsyn, A., Kallman, T., & Proga, D. 2008, ApJ, 687, 97
- Fukumura et al. (2010a) Fukumura, K., Kazanas, D., Contopoulos, I., Behar, E. 2010a., ApJ, 715, 636
- Fukumura et al. (2010b) Fukumura, K., Kazanas, D., Contopoulos, I., Behar, E. 2010b, ApJ, 723, 228
- Ganguly et al. (2008) Ganguly, R., & Brotherton, M. S. 2008, ApJ, 672, 102
- Gibson et al. (2005) Gibson, R.R., Marshall, H.L., Canizares, C.R. & Lee, J.C. 2005, ApJ, 627, 83
- Grevesse et al. (1993) Grevesse, N., Noels, A., & Sauval, A. J. 1993, A&A, 271, 587
- Gupta et al. (2013) Gupta, A., Mathur, S., Krongold, Y., & Nicastro, F. 2013 (submitted, Paper-I)
- Hopkins & Elvis (2010) Hopkins, P. & Elvis, M. MNRAS, 401, 7
- King (2010) King, A. R. 2010, MNRAS, 402, 1516
- Krolik & Kriss (1995) Krolik, J.H., & Kriss, G.A. 1995, ApJ, 447, 512
- Krongold et al. (2003) Krongold, Y., Nicastro, F., Brickhouse, N.S., Elvis, M., Liedahl D.A. & Mathur, S. 2003, ApJ, 597, 832
- Krongold et al. (2007) Krongold, Y. et al. 2007, ApJ, 659, 1022
- Mathur et al. (2003) Mathur,S., Weinberg, D.H., & Chen, X. 2003,ApJ, 582, 82
- Mathur & Stoll (2009) Mathur, S., & Stoll, R. 2009, AIPC, 1201, 33
- Matsumoto et al. (2004) Matsumoto, C., Leighly, K. M., & Marshall, H. L. 2004, ApJ, 603, 456
- Nicastro et al. (2005) Nicastro, F., et al. 2005, nature, 433, 49
- Laor & Brandt (2002) Laor, A. & Brandt, N. 2002, ApJ, 569, 641
- Papadakis et al. (2007) Papadakis, I. E., Brinkmann, W., Page, M. J., McHardy, I., & Uttley, P. 2007, A&A, 461, 931
- Pounds et al. (2003a) Pounds, K. A. et al. 2003, MNRAS, 345, 705
- Pounds et al. (2003b) Pounds, K. A. et al. 2003, MNRAS, 346, 1025
- Pounds & Vaughan (2011) Pounds, K. A., & Vaughan, S. 2011, MNRAS, 413, 125
- Proga & Kallman (2002) Proga, D., & Kallman, T.R. 2002, ApJ, 565, 455
- Proga & Kallman (2004) Proga, D., & Kallman, T. R. 2004, ApJ, 616, 688
- Proga (2007) Proga, D. 2007, ASPC, 373, 267
- Romano et al. (2004) Romano, P., Mathur, S., & Turner, T. J. 2004, ApJ, 602, 635
- Sim et al. (2008) , Sim, S. A., Long, K. S., Miller, L., & Turner, T. J. 2008, MNRAS 388, 611
- Sim et al. (2010) Sim, S. A., Long, K. S., Miller, L., & Turner, T. J. 2010, MNRAS, 408, 1396
- Scannapieco & Oh (2004) Scannapieco, E. & Oh, S., 2004 ApJ, 608, 62
- Silk & Rees (1998) Silk, J. & Rees, M.J. 1998, A&A, 331, 1
- Tombesi et al. (2010) Tombesi, F. et al. 2008, A&A, 521, 57
- Tombesi et al. (2011) Tombesi, F. et al. 2011, ApJ, 742, 44
- Tombesi et al. (2012) Tombesi, F. et al. 2012, MNRAS, 422, L1
- Tombesi et al. (2013) Tombesi, F. et al. 2013, MNRAS, 430, 110
- Turner et al. (2001) Turner, T. J. et al. 2001, ApJ, 561, 131
| Ion | ||||
|---|---|---|---|---|
| Å | km s-1 | m | ||
| O vi | ||||
| O vii | ||||
| O vii | ||||
| O viii | ||||
| O vii | ||||
| Fe xvii |
| Parameter | System 1 | System 2 |
|---|---|---|
| cm | ||
| km s | ||
| km s | ||
| 15 | 31 | |
| erg s | ||
| aafootnotemark: Improvement in to fit after adding model component |
.
.