CG-content log-ratio distributions of Caenorhabditis elegans and Drosophila melanogaster mirtrons
Abstract
Mirtrons are a special type of pre-miRNA which originate from intronic regions and are spliced directly from the transcript instead of being processed by Drosha. The splicing mechanism is better understood for the processing of mRNA for which was established that there is a characteristic CG content around splice sites. Here we analyse the CG-content ratio of pre-miRNAs and mirtrons and compare them with their genomic neighbourhood in an attempt to establish key properties which are easy to evaluate and to understand their biogenesis. We propose a simple log-ratio of the CG-content comparing the precursor sequence and is flanking region. We discovered that Caenorhabditis elegans and Drosophila melanogaster mirtrons, so far without exception, have smaller CG-content than their genomic neighbourhood. This is markedly different from usual pre-miRNAs which mostly have larger CG-content when compared to their genomic neighbourhood. We also analysed some mammalian and primate mirtrons which, in contrast the invertebrate mirtrons, have higher CG-content ratio.
Introduction
During the last decade, a wealth of small RNAs were discovered and with them new classes of biological regulators emerged. Among those, microRNAs (or miRNAs) due to their crucial role in genomic regulation are perhaps the most intensively studied. miRNAs are involved in the regulation of numerous cellular processes including differentiation, development, apoptosis, proliferation, the stress response and they change the expression of genes in several human diseases such as diabetes, cancer and neuromuscular dystrophy zhang07 ; iorio12 ; hussain12 .
miRNAs are non-coding RNAs first identified in 1993 in the nematode Caenorhabditis elegans lee93 . Canonical miRNAs are derived from primary miRNA transcripts (pri-miRNA), usually long nucleotide sequences that form specific hairpin-shaped stem–loop secondary structures. Pri-miRNA may originate one or more hairpins typically with 55–70 nucleotide (nt) in length. In animals, pri-miRNAs are cleaved by the nuclear Drosha RNase III enzyme to release precursor miRNA (pre-miRNA) hairpins. These are then transported to the cytoplasm by Exportin-5 (Exp5) and cleaved by the Dicer RNase III enzyme to generate a very short miRNA/miRNA* duplex kim09 . One of the strands, called mature miRNA (22–25nt), is incorporated into a RISC complex (RNA induced silencing complex) and guides the complex to the target mRNA to regulate gene expression while the other strand seems to take on other biological functions kim09 ; okamura08 ; bhayani11 . In animals, most of the miRNA functions are related to down-regulation of genes.
Ruby et al. ruby07 showed the existence of intronic pre-miRNAs in Drosophila melanogaster and C. elegans that bypass Drosha processing providing an alternative pathway for miRNA biogenesis okamura07 . These pre-miRNAs were called ‘mirtrons’ and the main difference between them and canonical miRNAs is that intronic sequences form lariats and the mirtrons are originated by splicing okamura07 ; ruby07 ; berezikov07 . Flynt et al. flynt10 reclassified a subset of mirtrons in D. melanogaster as “tailed mirtrons”, which have substantial overhangs and are targets of exosome-mediated trimming, which allows functional pre-miRNA to be generated. The existence of mirtrons in mammalians (human, macaque, chimpanzee, rat and/or mouse) was reported by Berezikov et al. berezikov07 where they identified, using computational and experimental strategies, 3 well conserved mirtrons expressed in diverse mammals, 16 primate specific mirtrons, and 46 candidate mirtrons in primates.
For mRNA, which is processed by splicing, Zhang et al. zhang11 determined that there is a characteristic CG content around splice sites. Also, it was shown that alternative splicing is promoted by the secondary RNA structure shepard08 which is strongly determined by CG content weber06 . MicroRNAs are co-expressed with mRNAs morlando08 ; shomron09 and, in particular, mirtrons are seemingly not processed by the Drosha microprocessor but by splicing only. With splicing being dependent on thermodynamic stability could there be some characteristic CG content which would set aside mirtrons from ordinary pre-miRNAs? Of special interest would be properties which would help to understand the splicing mechanism proposed for mirtrons okamura07 .
Here we set out to characterise precursor sequences of miRNAs and mirtrons in terms of CG-content and also Gibbs free energies for D. melanogaster and C. elegans. We found that the CG-content shows marked differences for both types of small RNA. Also, we performed the same analysis for mammalian mirtrons reported by Berezikov et al. berezikov07 , again our results show important differences albeit opposite of those for the two invertebrates.
Methods
To characterise the small RNAs we compare the CG-content of the precursor sequences which originate the pre-miRNAs and mirtrons to the CG-content of their neighbouring regions. The rationale for this approach is that if the neighbouring DNA sequence has an important difference in thermodynamic stability, when compared to the precursor sequence there should be tell tale signs of it in the CG-content fractions. We define the CG-content fraction as
| (1) |
Two types of CG-content fractions are used, one is related to either the precursor miRNA or the precursor mirtron. The other accounts for the total CG-contents of the 150 base pairs downstream and upstream of the precursor sequence which forms the neighbourhood of the precursor. The flanking sequence length was chosen to be of the same order of magnitude of the length of canonical pre-miRNAs. We perfomed the same analysis with longer flanking sequences (up to 250 nt, not presented), but found no difference from the results reported in this work. Both CG-contents are combined to form a log-ratio between the precursor and its neighbourhood
| (2) |
A positive ratio means that the CG-content of the precursor sequence is larger than that of its neighbours. Since CG-content is related to thermodynamic stability we may infer that generally means that the flanking DNA region is less stable that the precursor region. To ease the notation we use
To evaluate the statistical significance of our findings we use the Kolmogorov-Smirnov test press92 . Even though this statistical test is well established, given the question which is posed in this work it is perhaps more intuitive and simpler to quantify the significance by using simple combinatorial probabilities. Therefore, we also calculate the probability of drawing pre-miRNAs, all with , purely by chance
| (3) |
where and are number of known pre-miRNAs with and , respectively.
The database used to obtain the precursor miRNA and mirtrons of D. melanogaster and C. elegans was from mirBASE version 16 griffiths-jones06 ; kozomara11 , which is one of the main on-line repositories for microRNA sequences. For extracting the flanking sequences we used the complete genome file of D. melanogaster version r5.34 drysdale05 and version WS223 for C. elegans stein01 . We retrieved the precursor miRNA/mirtron sequences by searching for an exact match within the complete genome files. For each sequence four types of matches were performed: the original sequence, the reversed sequence, the complementary sequence and the reversed-complementary sequence.
The mirtrons reported by Berezikov et al. berezikov07 were collected from the supplemental data, the neighbouring sequences for each these mirtrons were obtained from Ensemble API and databases hubbard02 .
To complete our analysis we also calculated the average Gibbs free energies of mirtrons and ordinary pre-miRNA. In this work we use the RNAfold program from the Vienna package hofacker03 with default parameters to obtain the Gibbs free energies, .
Results and Discussion
| Organism | RNA type | total | (kcal/mol) | (nt) | ||||
|---|---|---|---|---|---|---|---|---|
| C. elegans | mirtrons | 5 | 0 | 5 | ||||
| D. melanogaster | mirtrons | 18 | 0 | 18 | ||||
| D. melanogaster | tailed mirtrons | 7 | 2 | 5 | ||||
| C. elegans | canonical miRNAs11footnotemark: 1 | 170 | 131 | 39 | ||||
| D. melanogaster | canonical miRNAs11footnotemark: 1 | 151 | 97 | 54 |
mirtrons excluded.
| Organism | RNA type | (kcal/mol) | (nt) | ||
|---|---|---|---|---|---|
| C. elegans | canonical miRNAs | 39 | |||
| D. melanogaster | canonical miRNAs | 54 |
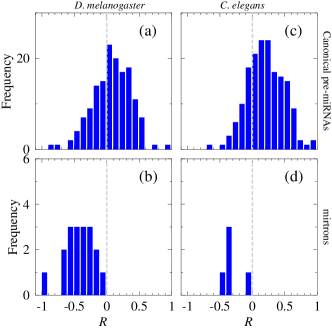
In Fig. 1 we show the distribution of CG-content log-ratio for canonical pre-miRNAs and mirtrons, defined in Methods, of D. melanogaster and C. elegans. The content log-ratio for canonical pre-miRNAs, Fig. 1a, is roughly gaussian with a peak around . This means that for this type pre-miRNA there appears to be no strong preferential ratio for CG-content within the precursor sequence and its neighbours, although a bias towards is clearly noticeable. In stark contrast, all 18 mirtrons of D. melanogaster have () as shown in Fig. 1b. Even though the number of reported mirtrons is still small, the probability of picking 18 small RNAs with by chance alone, considering the distribution for canonical pre-miRNA, is , see Eq. (3). The Kolmogorov-Smirnov distibution test yields which essentially confirms the simple combinatorial probability. Therefore, the occurrence of 18 pre-miRNA entirely by chance is very unlikely.
Some authors describe mirtrons as tightly packed between exons hussain12 , but in our analysis we have found that this is not the case. Most mirtrons are surrounded by intronic sequences not exons. This seems consistent if one considers that intronic regions of D. melanogaster are about 750 to 1000 nt in length on average presgraves06 and that mirtrons are typically 60 nt in length. Therefore, means that the immediate flanking region which is also intronic is more stable than the precursor region. One possible explanation for the predominance of would be if intronic regions were of highest CG-content. However, the intronic regions of D. melanogaster have one of the smallest CG-content in this genome: 0.4 as compared to 0.52 for coding regions. The fact that the surrounding region of mirtrons has a higher CG content, which is unusual for intronic regions, suggest a role in the processing of these special types of miRNAs. Therefore, we may speculate that may play a role in the mirtron splicing mechanism in a similar fashion to what happens for messenger RNA zhang11 .
For canonical C. elegans pre-miRNAs we observe a similar gaussian shaped distribution of the ratio (Fig. 1c) but with strong bias towards . Tab. 2 shows that the ratio is of three pre-miRNAs for each pre-miRNA. To date there are only five mirtrons reported and they all show (Fig. 1d), similar to the mirtrons of D. melanogaster. Even though this number is very small, it is still intriguing given the strong bias toward in canonical pre-miRNAs. Indeed, the probability of picking 5 pre-miRNAs all with is small, the combinatorial probability being . Again, the Kolmogorov-Smirnov test provides in agreement with the combinatorial probability.
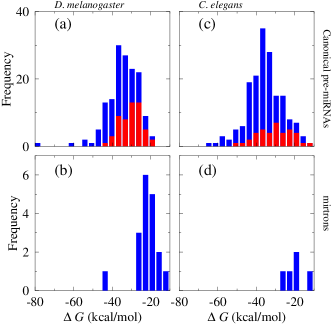
To complete our comparative analysis of mirtrons and canonical pre-miRNAs, we also calculated the Gibbs free energies. Clearly, given the nature of the mirtons, one would expect these to be generally less stable than the average pre-miRNAs. In Fig. 2 we show the distribution of free energy for both invertebrates, and detailed quantities are also given in Tab. 2. Except for one notable exception, all mitrons show larger than kcal/mol, confirming their instability. In contrast, canonical pre-miRNAs are distributed over a much larger range of energies. Certainly, the fact that mirtrons are much shorter than canonical pre-miRNAs, 60 nt compared to 90 nt on average, largely accounts for this. But is a free energy larger than kcal/mol sufficient to result in ? To answer this, we isolated all canonical pre-miRNAs with and recalculated the their distribution, which are shown as red bars in Figs. 2a and 2c and summarised in Tab. 2. Essentially, we find a considerable number of pre-miRNAs with kcal/mol. In other words, a pre-miRNAs with kcal/mol does not imply in . Therefore, the free energy distribution alone does not explain why all mirtrons of D. melanogaster and C. elegans are .
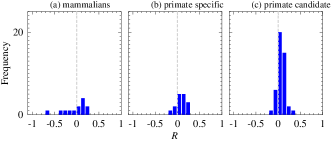
The next question is whether other types of reported mirtrons, such as primate and mammalian mirtrons show the same distribution as D. melanogaster and C. elegans? As shown in Tab. 3, in terms of CG-content ration and average free energy these mirtrons appear not to be biased to any particular value. Berezikov et al. berezikov07 found that the GC content of mammalian mirtrons was much higher than that of invertebrate miRNAs but, in comparison with their neighbours regions, we found that they tend generally to (precursor region has larger CG-content), see Fig. 3. We have not attempted to generate the distribution of mammalian pre-miRNAs due to the number of large genomes which would have to be processed.
| Organism | RNA type | total | (kcal/mol) | (nt) | ||||
| mammalians | putative mirtrons | 13 | 8 | 5 | ||||
| primates | specific mirtrons | 16 | 13 | 3 | ||||
| primates | candidate mirtrons | 4522footnotemark: 2 | 40 | 5 |
Ref. berezikov07, reports 46 candidates mirtrons for primates, yet supplementary tables only show 45 sequences.
Conclusions
We have introduced the concept of CG-content log-ratio of precursor sequences and flanking regions and discovered that all D. melanogaster and C. elegans mirtrons are . This cannot be explained by the CG-content of the intronic region and neither by the fact that mirtrons are generally shorter and less stable than pre-miRNAs. Usual pre-miRNAs of these organisms only show a moderate bias towards . This finding appears to support the notion that mirtrons are spliced in a similar fashion to mRNA instead of being processed by Drosha. For mammalian mirtrons we have found no such bias, but we noticed that these also display several important differences when compared to the vertebrate mirtrons which were considered in this work, such as differences in length and free energy.
Acknowledgements
We are grateful to J. M. Ortega for helpful suggestions. Funding: CNPq, Fapemig and National Institute of Science and Technology for Complex Systems.
References
- 1 Zhang B, Pan X, Cobb GP, Anderson TA: microRNAs as oncogenes and tumor suppressors. Developmental Biology 2007, 302:1–12.
- 2 Iorio M, Croce C: MicroRNA dysregulation in cancer: diagnostics, monitoring and therapeutics. A comprehensive review. EMBO Molecular Medicine 2012.
- 3 Hussain M: Micro-RNAs (miRNAs): genomic organisation, biogenesis and mode of action. Cell and Tissue Research 2012, :1–9.
- 4 Lee RC, Feinbaum RL, Ambros V: The C. elegans heterochronic gene lin-4 encodes small RNAs with antisense complementarity to lin-14. Cell 1993, 75(5):843–854.
- 5 Kim V, Han J, Siomi M: Biogenesis of small RNAs in animals. Nature Reviews Molecular Cell Biology 2009, 10(2):126–139.
- 6 Okamura K, Chung WJ, Lai E: The long and short of inverted repeat genes in animals: microRNAs, mirtrons and hairpin RNAs. Cell cycle 2008, 7(18):2840.
- 7 Bhayani M, Calin G, Lai S: Functional relevance of miRNA* sequences in human disease. Mutation Research/Fundamental and Molecular Mechanisms of Mutagenesis 2011.
- 8 Ruby J, Jan C, Bartel D: Intronic microRNA precursors that bypass Drosha processing. Nature 2007, 448(7149):83–86.
- 9 Okamura K, Hagen JW, Duan H, Tyler DM, Lai EC: The mirtron pathway generates microRNA-class regulatory RNAs in Drosophila. Cell 2007, 130:89–100.
- 10 Berezikov E, Chung W, Willis J, Cuppen E, Lai EC: Mammalian mirtron genes. Molecular Cell 2007, 28(2):328–336.
- 11 Flynt AS, Greimann JC, Chung WJ, Lima CD, Lai EC: MicroRNA Biogenesis via Splicing and Exosome-Mediated Trimming in Drosophila. Molecular cell 2010, 38(6):900–907.
- 12 Zhang J, Kuo C, Chen L: GC content around splice sites affects splicing through pre-mRNA secondary structures. BMC genomics 2011, 12:90.
- 13 Shepard P, Hertel K: Conserved RNA secondary structures promote alternative splicing. Rna 2008, 14(8):1463.
- 14 Weber G, Haslam N, Whiteford N, Prügel-Bennett A, Essex JW, Neylon C: Thermal equivalence of DNA duplexes without melting temperature calculation. Nature Physics 2006, 2:55–59.
- 15 Morlando M, Ballarino M, Gromak N, Pagano F, Bozzoni I, Proudfoot N: Primary microRNA transcripts are processed co-transcriptionally. Nature structural & molecular biology 2008, 15(9):902–909.
- 16 Shomron N, Levy C: MicroRNA-biogenesis and pre-mRNA splicing crosstalk. Journal of Biomedicine and Biotechnology 2009, 2009.
- 17 Press W, Teukolsky S, Vetterling W, Flannery B: Numerical recipes in C. Cambridge Univ. Press Cambridge 1992.
- 18 Griffiths-Jones S, Grocock R, van Dongen S, Bateman A, Enright A: miRBase: microRNA sequences, targets and gene nomenclature. Nucleic Acids Research 2006, 34:D140–D144.
- 19 Kozomara A, Griffiths-Jones S: miRBase: integrating microRNA annotation and deep-sequencing data. Nucl. Acids. Res. 2011, 39(suppl 1):D152.
- 20 Drysdale RA, Crosby MA: FlyBase: genes and gene models. Nucleic Acids Research 2005, 33(suppl 1):D390.
- 21 Stein L, Sternberg P, Durbin R, Thierry-Mieg J, Spieth J: WormBase: network access to the genome and biology of Caenorhabditis elegans. Nucleic Acids Research 2001, 29:82.
- 22 Hubbard T, Barker D, Birney E, Cameron G, Chen Y, Clark L, Cox T, Cuff J, Curwen V, Down T, et al.: The Ensembl genome database project. Nucleic Acids Research 2002, 30:38.
- 23 Hofacker IL: Vienna RNA secondary structure server. Nucl. Acids. Res. 2003, 31:3429–3431.
- 24 Presgraves D: Intron length evolution in Drosophila. Mol. Biol. Evol. 2006, 23(11):2203–2213.