The Exceptional Soft X-ray Halo of the Galaxy Merger NGC 6240
Abstract
We report on a recent 150-ks long Chandra observation of the ultraluminous infrared galaxy merger NGC 6240, which allows a detailed investigation of the diffuse galactic halo. Extended soft X-ray emission is detected at the 3 confidence level over a diamond-shaped region with projected physical size of 11080 kpc, and a single-component thermal model provides a reasonably good fit to the observed X-ray spectrum. The hot gas has a temperature of 7.5 million K, an estimated density of 2.510-3 cm-3, and a total mass of 10, resulting in an intrinsic 0.4–2.5 keV luminosity of 41041 erg s-1. The average temperature of 0.65 keV is quite high to be obviously related to either the binding energy in the dark-matter gravitational potential of the system or the energy dissipation and shocks following the galactic collision, yet the spatially-resolved spectral analysis reveals limited variations across the halo. The relative abundance of the main -elements with respect to iron is several times the solar value, and nearly constant as well, implying a uniform enrichment by type II supernovae out to the largest scales. Taken as a whole, the observational evidence is not compatible with a superwind originated by a recent, nuclear starburst, but rather hints at widespread, enhanced star formation proceeding at steady rate over the entire dynamical timescale (200 Myr). The preferred scenario is that of a starburst-processed gas component gently expanding into, and mixing with, a pre-existing halo medium of lower metallicity ( solar) and temperature ( keV). This picture cannot be probed more extensively with the present data, and the ultimate fate of the diffuse, hot gas remains uncertain. Under some favorable conditions, at least a fraction of it might be retained after the merger completion, and evolve into the hot halo of a young elliptical galaxy.
1 Introduction
NGC 6240 (; Downes et al. 1993) is one of the most impressive galaxy mergers in the local Universe. In the framework of hierarchical structure assembly, the remnant of the collision between two gas-rich spirals likely goes through a bright quasar phase, and eventually relaxes into a quiescent elliptical galaxy (e.g., Toomre & Toomre 1972; Schweizer 1986; Barnes & Hernquist 1992; Hopkins et al. 2008; and references therein). The gravitational instabilities at work during a major merger trigger an extensive gas redistribution, which consequently fuels both intense star formation and efficient black-hole accretion. Due to the large dust opacity to the intrinsic radiation field of this composite energy source (i.e., starburst and active galactic nucleus, AGN), the bulk of the bolometric luminosity possibly emerges at infrared wavelengths. The ultimate merging systems are thus found among the so-called Ultraluminous Infrared Galaxies (ULIRGs, ; Lonsdale et al. 2006). With an energy output of 710 at 8–1000 m (e.g., Sanders & Mirabel 1996), NGC 6240 falls slightly below this threshold, yet its global features are ordinary in ULIRGs, and it is usually included in this class (Genzel et al. 1998).
The optical morphology of NGC 6240 is highly disturbed, with long tidal tails and a distorted disk obstructed by broad dust lanes (Fosbury & Wall 1979; Gerssen et al. 2004). The central kpc harbors two nuclei, whose position and relative separation are wavelength-dependent owing to the significant obscuration (Schulz et al. 1993; Max et al. 2007). A huge amount (several 10) of molecular gas is concentrated in between (Tacconi et al. 1999; Iono et al. 2007), giving rise to exceptional, shock-excited H2 line emission in the near-IR (Joseph et al. 1984; Ohyama et al. 2003). The surrounding butterfly-shaped H nebula shows filaments and loops, consistent with the expansion of superwind bubbles (Heckman et al. 1987; Lira et al. 2002). When not destroyed by the hard X-ray photons, also some dust is apparently entrained in these outflows (Bush et al. 2008). A soft X-ray component extended out to 10 kpc, and possibly beyond, was first detected by ROSAT (Komossa et al. 1998), while Chandra enabled the discovery of a buried AGN in each of the two nuclei (Komossa et al. 2003). This dual AGN character has been later supported by radio (Gallimore & Beswick 2004) and mid-IR (Risaliti et al. 2006) observations.
By virtue of its proximity and overall complexity, NGC 6240 is a unique source in various respects, whose study is extremely relevant to address many critical issues, including the transformation of galaxies through major mergers, the connection between AGN and starburst activity, the impact of AGN feedback and starburst superwinds, the chemical enrichment of the interstellar and intergalactic medium, the correlation between the host-galaxy bulges and their central supermassive black holes. In particular, as a dual AGN encounter close to the final coalescence, NGC 6240 represents a rare opportunity to directly witness a phenomenon thought to be common in the earlier cosmic epochs (Engel et al. 2010a), but still not completely understood because of the dearth of observational constraints available in the present-day Universe.
Taking advantage of the great improvement in data quality achieved through a recent Chandra observation, here we explore the physical properties of the diffuse gas responsible for the large-scale ( kpc), soft X-ray emission of NGC 6240, and investigate into its nature to extract some crucial information on the origin and evolution of the whole system. The luminosity of this 100-kpc wide, hot halo is quite high for normal early-type galaxies (Fabbiano et al. 1992), and more typical of the central objects in small groups and clusters (O’Sullivan et al. 2001a). If this were the case, the X-ray halo would be almost in virial equilibrium, and its luminosity would persist even after the merger completion. A companion paper (Wang et al. 2013a, in prep.) deals with the sub-arcsec resolution X-ray image of the nuclear region, focusing on the diffuse 5.5–8 keV emission, and indicating the presence of fast shocks in the 70 million K hot gas phase. The detailed analysis of the soft X-ray emission in the intermediate nebular region (), which is pervaded by a starburst-driven wind, will be presented in a third, forthcoming paper (Wang et al. 2013b, in prep.).
This work is organized as follows: in Section 2 we provide the basic details about observations and data reduction. Sections 3 and 4 concern the analysis of the X-ray images and spectra, respectively. The implications of our results on the nature of the halo are discussed in Section 5, and conclusion are drawn in Section 6. The luminosity distance of 107 Mpc and the angular scale of 492 pc arcsec-1 are assumed throughout for NGC 6240, based on the latest concordance cosmological parameters ( km s-1 Mpc-1, , ; Komatsu et al. 2011).
2 Observations and Data Reduction
This work is motivated by the most recent Chandra observation of NGC 6240 (ObsID 12713; PI: G. Fabbiano), which started on 2011 May 31 and yielded the deepest exposure of the source available to date (145 ks). NGC 6240 had been previously targeted within the Chandra guaranteed observing time program on several occasions. The imaging snapshot taken in February 2000 with the High Resolution Camera revealed the highly complex morphological properties in the central region, with the remarkable correlation between the X-ray emission contours and the H filamentary structures (Lira et al. 2002). The following 37-ks observation (hereafter ObsID 1590) performed with the Advanced CCD Imaging Spectrometer (ACIS-S) detector clearly established the AGN nature of the two nuclei, which are both characterized by flat reflection spectra and prominent iron K lines, and definitely confirmed the tight connection between the circumnuclear soft X-ray emission and starburst activity (Komossa et al. 2003). ACIS-S was also used in combination with the High-Energy Transmission Grating (HETG) in two consecutive observations in May 2006 (ObsID 6908/9), for an integration time of 300 ks. The first order spectrum is quite faint (Shu et al. 2011), but results in a better resolution of the complex iron K-shell emission at 6.4–7.1 keV with respect to previous XMM-Newton-based studies (Boller et al. 2003; Netzer et al. 2005).
The ACIS-S data products for ObsID 12713 provided by the Chandra X-ray Center, as well as all the archival ones, were reprocessed through the chandra repro script using the v4.4.6 Calibration Database (CALDB), and analyzed with the ciao v4.4 and heasoft v6.12 software packages. In the preliminary stages we also considered the two grating observations. However, differently from the spatially-resolved analysis of the nuclear hard X-ray emission presented in Wang et al. (2013a), the HETG zeroth orders turned out to be unsuitable for the study of soft, extended emission in the halo. Indeed, the 0.5–1.5 keV background level of ObsID 6908/9 is nearly 5 times higher than that of ObsID 12713. Combined with the large difference in effective area (by roughly a factor of 12 around 1 keV),111http://cxc.harvard.edu/cgi-bin/build_viewer.cgi?ea. this leads to a significant worsening of the overall signal-to-noise ratio (S/N) when all data sets are taken into account, against a modest improvement in terms of cumulative net counts (less than 10%; Table 1). In addition, the soft X-ray emission clearly stretches out to the area of the detector over which the diffracted spectral orders are projected, preventing an accurate determination of the halo surface brightness along the HETG dispersion cones.222As a further caveat to the use of grating observations in the study of the halo, note that the estimated number of source counts for ObsID 6908/9 does not obviously scale with the exposure time (see Table 1).
We therefore dropped ObsID 6908/9, and employed in this work the two standard ACIS-S observations only. In both cases the source was imaged on the back-illuminated S3 chip, due to its enhanced soft response. The background was low and fairly stable, with average rates of 0.0028 and 0.0039 counts s-1 arcmin-2 for ObsID 12713 and ObsID 1590; adopting a time bin of 300 s, the fit of the background light curves with a constant gives a reduced of 0.96 and 1.09, respectively. No time filtering of flaring background periods was then required, delivering a total exposure of 182.05 ks. By checking the field of view for X-ray counterparts of the optical point sources in the NOMAD catalogue (Zacharias et al. 2004), and comparing the positions of all the bright point-like X-ray sources in the two observations, we verified the accuracy of the absolute astrometry and the absence of any relative offset to within 1 native pixel (0.5). The shorter-exposure ObsID 1590 was then reprojected to the coordinate frame of ObsID 12713, and the two images were merged.333The choice of a specific script is not influential, hence we used reproject events plus dmmerge for the event files, and reproject image later on for the exposure maps.
| ObsID∗ | Date | Expa | Grating | Bkgdc | Countsd | |
|---|---|---|---|---|---|---|
| 1590 | 2001-07-29 | 36.7 | None | 630 | 0.0039 | 1960 |
| 6909 | 2006-05-11 | 141.2 | HETG | 45 | 0.0014 | 430 |
| 6908 | 2006-05-16 | 157.0 | HETG | 45 | 0.0015 | 350 |
| 12713 | 2011-05-31 | 145.4 | None | 520 | 0.0028 | 5750 |
Since the shape and the spatial extent of the diffuse emission are not known in advance, the regions for spectral extraction were optimized on the basis of the image inspection described in the next Section. Background spectra and count rates have been obtained from a circular region with radius of 1, centered at a distance of 3 from the nuclear region of NGC 6240, to the North-East, and devoid of both point sources and excess diffuse emission. Source and background spectra and weighted response files were generated and combined with the specextract tool.
The X-ray halo is rather soft, and lies above the background level only in the 0.5–1.5 keV energy range (which serves as reference throughout this work). It is therefore critical to adopt a correct spectral binning method. In order to allow the use of minimization, we have grouped the background-subtracted spectra to a significance threshold of 4 for each energy channel. At the same time, we have also employed the ungrouped spectra, with the requirement of at least one count per bin to ensure a proper application of the Poissonian -statistic (Cash 1979) even if no background model is supplied.444Since the background cannot be described by a simple shape (e.g., a power law), we did not conform to the ideal procedure with Poissonian statistics of modeling the total and background spectra simultaneously. However, it is still possible to obtain correct results within xspec, provided that no empty bin is involved. The results of this dual approach are always self-consistent, and are presented interchangeably in the following, depending on the specific discussion purposes. Indeed, while carries direct information on the goodness of the fit, -stat allows us to preserve a better energy resolution at lower S/N. The spectral analysis was performed with the xspec v12.7 fitting package.555http://heasarc.gsfc.nasa.gov/xanadu/xspec/. Unless otherwise stated, all the uncertainties are given at the 90% confidence level, and energies in the observer’s frame. Radial profiles have been analyzed and fitted within Sherpa,666http://cxc.harvard.edu/sherpa4.4/. while images were visualized and manipulated through SAOImage DS9.777http://hea-www.harvard.edu/RD/ds9/.
3 Image Analysis
3.1 Halo Morphology
Besides the ordinary image reprocessing, further corrections are necessary in the study of extended X-ray sources to convert counts into physical units, properly taking into account the dependence of the collecting area on energy and position, as well as the effective exposure in the different regions of the detector. With this aim, we have first built an instrument map using the ciao tool mkinstmap, and then generated an exposure map (see Davis 2001) for each observation with mkexpmap. The input spectral weights were calculated by extracting a preliminary halo spectrum from the –80 annulus centered on the brightest, nuclear hard X-ray source, and modeling it with a phenomenological two-component thermal model. The individual maps were then reprojected and combined to match the merged image.
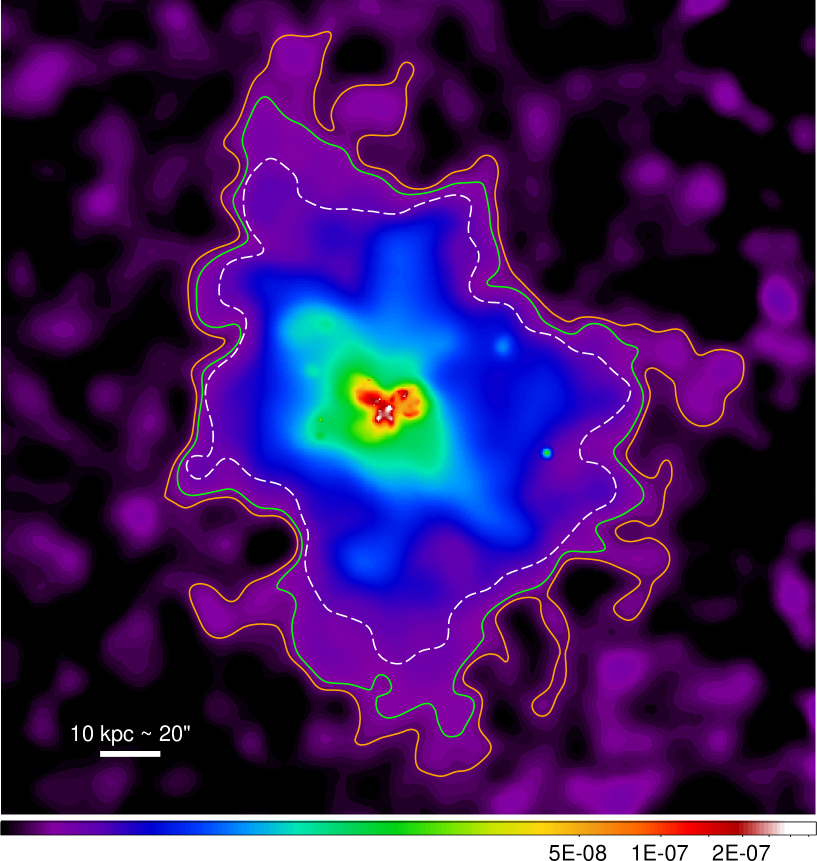
In order to assess the maximum halo extent along the various directions, we initially focused our attention on the 0.7–1.1 keV band, which represents the optimal compromise between the requirements of both high S/N and total net counts. At the standard soft X-ray energies of 0.3–2 keV, in fact, the source counts amount to 10000, but this is only 59% of the whole number of events collected over that range. By restricting to 0.7–1.1 keV, instead, the same fraction rises to 77% while retaining 6000 net counts. This improves the sensitivity at low surface brightness (see Fig. 1).
In ObsID 12713, the nuclear region of NGC 6240 lies 2 from the western edge of the S3 chip. Even after applying the exposure correction, this puts a rough empirical limit on the area that can be effectively explored for the presence of diffuse emission (at least in the East–West direction), as the large exposure disparity () would affect the significance of any detection. This notwithstanding, we have adaptively smoothed the 0.7–1.1 keV image to emphasize the faint extended features while preserving the local details with the highest S/N, using csmooth (Ebeling et al. 2006). This tool convolves the raw image with increasing Gaussian kernels; we set a nominal significance between 2.5 and 5 over the local background under each kernel, and imposed a maximum kernel size of 10 pixels to prevent any oversmoothing. The same smoothing scales were applied to the exposure map, which was eventually used to normalize the source image.
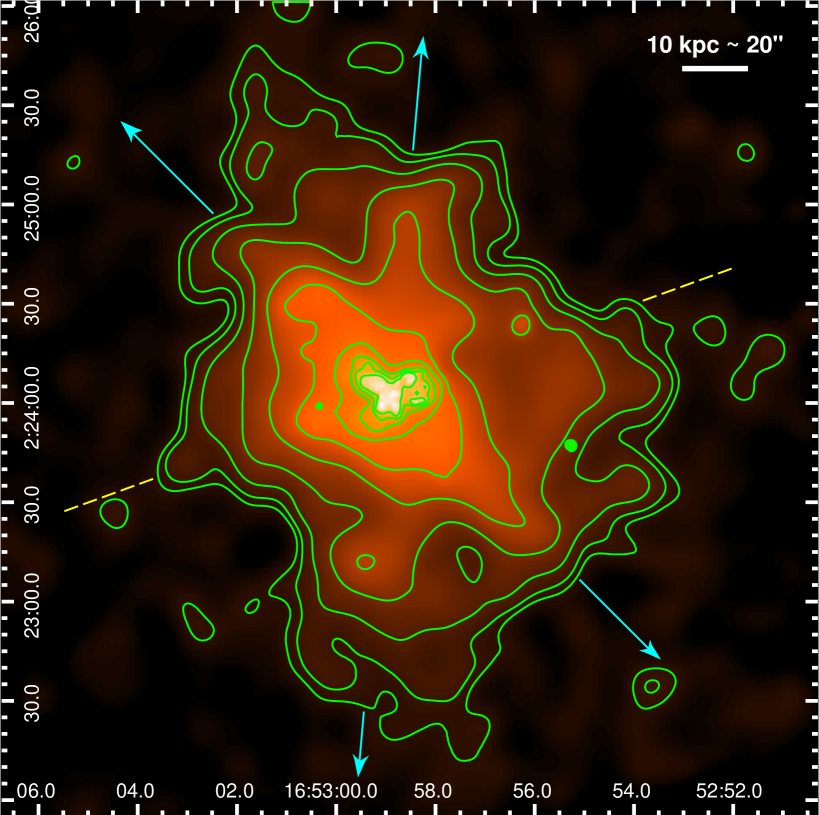
The final, exposure-corrected image is shown in Fig. 1, where also the detection contours at the 2 and 3 confidence level above the average background have been computed. The latter curve is taken to represent the outer boundary hereafter, although its mean radius of 80 can still be regarded as conservative measure with some respect (e.g., the overly fine spatial resolution; see below). According to this estimate, the X-ray halo of NGC 6240 appears to have a somewhat distorted, elongated, diamond-like shape. The directions of minimum and maximum extension intersect to the South-East of the nucleus and are almost exactly perpendicular, corresponding to position angles of 16 and 107, respectively. The physical size at full length is then 11080 kpc (225162). In Fig. 2 we draw the logarithmic contours starting at the fiducial detection limit, with a surface brightness cutoff that brings out the structures within the halo. As already pointed out by Bush et al. (2008), the most conspicuous feature is the stretched, cross-like pattern characterizing the central region, whose arms generate a bicone with an aperture angle of 130. This is even more evident below in Fig. 4, where the emission clumpiness is visibly enhanced. Notably, the axis of symmetry of this bicone is virtually normal to the plane of the optical disk, and its apex is coincident with the hard X-ray source. This is all commensurate with a galactic outflow arising from the nuclear starburst similar to that observed in M82 (Griffiths et al. 2000), and possibly sweeping across a pre-existing halo medium. The physical scales involved, however, are rather challenging (see Section 5).
3.2 Surface Brightness Profile
Compared to the oblong structure above, at larger distance ( kpc) and out to the detection boundary the hot gas distribution tends to recover a rounder shape. In spite of the overall slight asymmetry, a radial analysis can provide valuable information on the system. We have then computed the surface brightness profile of NGC 6240 up to a galactocentric distance of 128, sampling this region with successive, 4-wide annuli. The surrounding field is quite crowded, hence we employed the wavelet-based algorithm wavdetect (Freeman et al. 2002) to isolate any contaminating point-like sources, three of which lie just within the outer border. As their non-negligible contribution to the respective annuli might alter substantially the slope of the faint emission tail and the detection significance, we excluded a circle of 4-pixel radius around each of these sources.
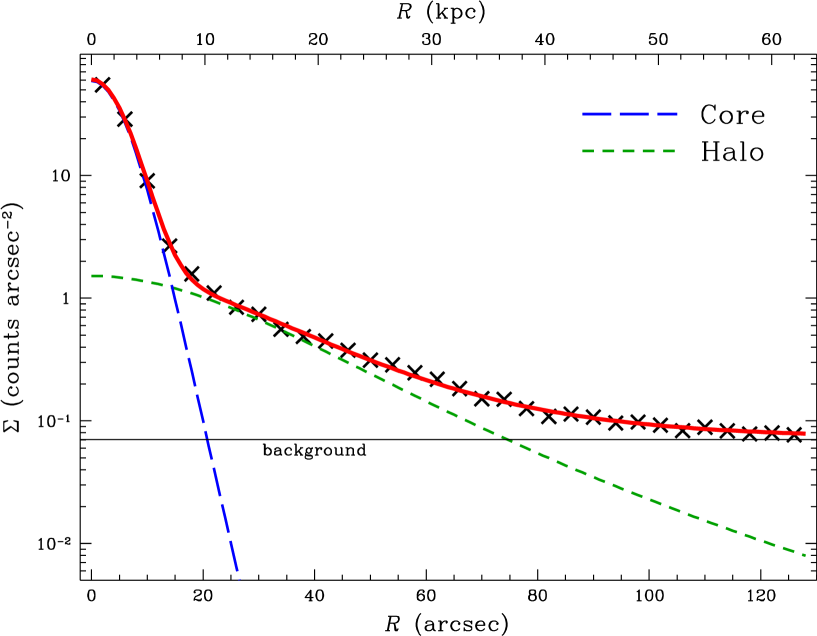
The resulting background-subtracted surface brightness profile was fitted with a two-component -model, which is a convenient analytical expression widely-used in the study of galaxies and clusters, defined as:
where is the central surface brightness, the scale radius of the gas distribution and the power-law index. With , for instance, at . Based on the shorter ObsID 1590 only, Huo et al. (2004) already suggested that a double -model better accounts for the radial profile of NGC 6240 than the simpler form above. Besides the confirmation of these earlier findings, we are now able to show that the core and halo components can be completely disentangled (Table 2; Fig. 3). In particular, the extended, slowly declining component equals its compact, steeply falling counterpart 7 kpc away from the center, and becomes dominant straight beyond. We have consequently assumed as the inner boundary of the halo in our later spectral analysis. This is consistent with a rough estimate from visual inspection of the X-ray morphology.
According to the radial surface brightness profile, diffuse emission associated with NGC 6240 is detected at the 3 confidence level out to a galactocentric distance of 100 (50 kpc). Since counts are now integrated over a given annulus, this measure naturally overrides the single pixel-based 3 contour formerly supplied, and is our best approximation to the actual average extension of the halo.
| Par | Core∗ | Halo∗ |
|---|---|---|
| 59.21.3 | 1.50.1 | |
| 10.01.5 | 23.82.5 | |
| 3.30.8 | 1.00.1 |
3.3 Small-Scale Structures
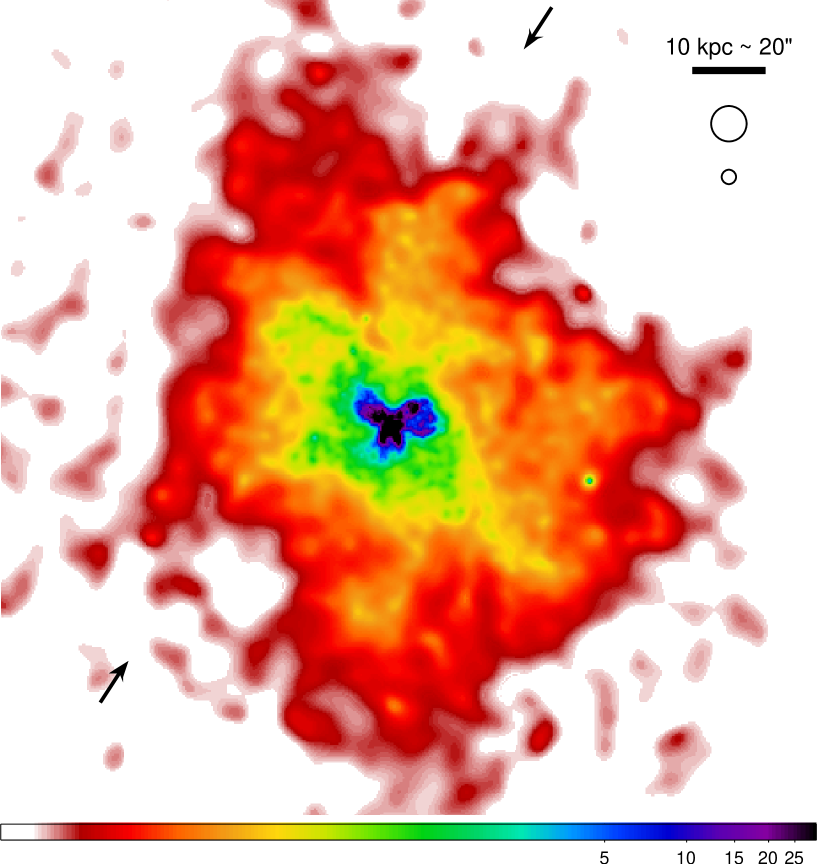
The clumpiness of the morphological appearance suggested by Fig. 1, as opposed to a possible flatness, can be itself indicative of the nature of the halo. In order to assess the degree of complexity, we have performed the adaptive smoothing with the alternative ciao tool dmimgadapt, which is also available within DS9.888http://cxc.harvard.edu/ciao/ahelp/dax.html. Differently from csmooth, in this case the underlying algorithm returns a superior resolution of the bright small-scale structures. Indeed, within csmooth the kernel significance is computed with respect to the local background. This magnifies the faint, diffuse component close to the halo border, yet inner structures may be not significant enough with respect to the neighboring area. Such features are then smoothed at the widest scale allowed, and any clumpiness is lost. On the contrary, dmimgadapt is based on the raw number of counts. We then switched to the 0.5–1.5 keV image, due to its 13000 total counts, 71% of which are associated with the source. We adopted the same maximum size as before (10 pixels), and required at least 16 counts under each kernel. Given the background expected, this corresponds to a minimum significance of 1, growing up to 3.5 for the finest (i.e., -wide) structures. The results are illustrated in Fig. 4, where knots and filaments are clearly visible throughout the physical scales across the halo.
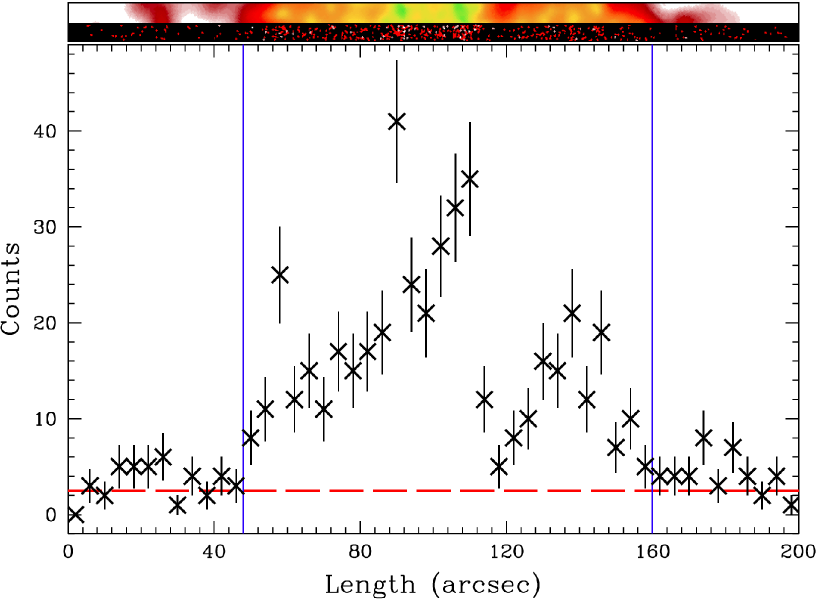
We further addressed this issue from a quantitative point of view by selecting a sample direction across the halo, off the nuclear region but intersecting several apparent, local intensity peaks. We extracted the number of counts along a 2004 stripe, divided in 50 square cells. Fig. 5 shows the tight correlation between the raw and the smoothed image; the actual difference of count density substantiates the statistical significance of the small-scale structures. In conclusion, these features are not consistent with a fully relaxed environment in nearly thermal and hydrostatic equilibrium, but rather they are reminiscent of the loops, bubbles and cavities seen in the central kpc region of NGC 6240, where the shock-heated gas is subject to violent starburst-driven winds and, possibly, to massive AGN feedback (Lira et al. 2002; Komossa et al. 2003; Feruglio et al. 2012). A spatially-resolved spectral analysis can then provide crucial information to constrain the properties of the hot gas in the halo, and to shed light on the origin and evolution of the whole system.
3.4 Line-Strength Map
The preliminary spectrum extracted during the calculation of the exposure map hinted at soft X-ray line emission within the halo. Using the XMM-Newton spectrum (70 extraction radius) presented by Boller et al. (2003) as a reference, we were able to identify the Fe-L complex, possibly blended with O vii–viii and Ne ix–x (0.55–1.12 keV), and also Mg xi–xii (1.24–1.5 keV) and Si xiii–xiv lines (1.7–1.93 keV). Following Baldi et al. (2006a) and Wang et al. (2009), we generated three narrow-band images to encompass the features listed above, in order to obtain a visual map of line strengths and metal abundances in the hot, diffuse interstellar medium. For the continuum subtraction, another image was extracted from the joint 0.4–0.55, 1.12–1.24 and 1.5–1.7 keV energy range. All the line and continuum bands were selected to achieve an optimal compromise between line strength and continuum contamination. No culling was applied for the few point sources. The O–Fe–Ne image was adaptively smoothed (with csmooth) as described earlier. Due to its highest S/N and largest number of line counts (4000), the same smoothing scales were adopted for the other images. The background level appropriate to each energy range was then subtracted, while the continuum contribution to each line image was determined by fitting the halo spectrum with an absorbed bremsstrahlung model, after excluding the strong emission features. The resulting scaling factors (2.2, 0.4 and 0.1 for the O–Fe–Ne, Mg and Si bands, respectively) were assumed as relative weights in the final continuum subtraction.
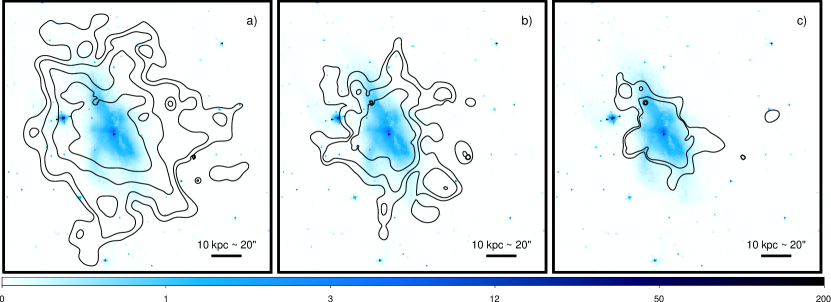
The accuracy of this procedure is corroborated by the little spectral variations across the halo (see below), which allowed us to employ the average continuum. Indeed, this is not the case for the core region, where the source emission is much more complex and position-dependent. As a result, most of the structures found in the line-strength maps within the central 15 have no physical meaning. For this reason, in Fig. 6 we only show the lowest significance contours of the soft X-ray emission lines under examination. The comparison with the archival Hubble Space Telescope ACS/WFC F814W image reveals that metals are spread out far beyond the optical limits of the galaxy. Not surprisingly, given the energy band and the line intensity, the O–Fe–Ne morphology turns out to be very similar to that illustrated in Fig. 2. Once the intrinsic difference in S/N is taken into account, also the spatial distribution of Mg and Si line emission displays a close overlap. In particular, the prominent cross-like shape is clearly recovered in the 3 Mg contours. This suggests that the halo of NGC 6240 has already experienced a significant, nearly uniform metal enrichment out to very large distances.
4 Spectral Analysis
4.1 Full Halo
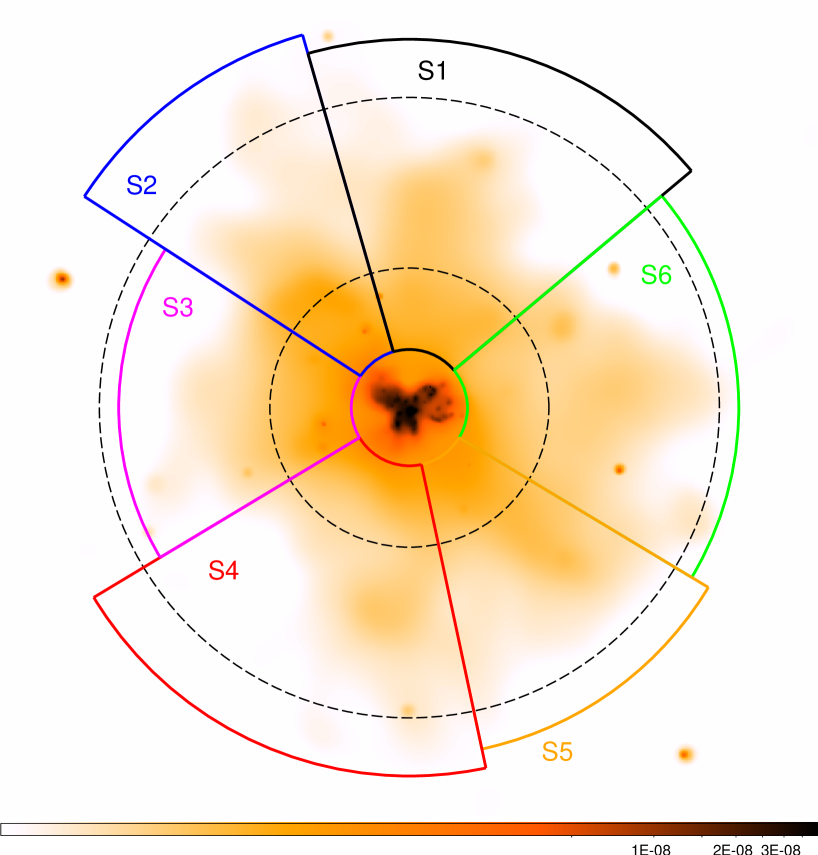
The radial surface brightness profile of Fig. 3 indicates a sharp separation at kpc between the core and the halo components. Starting at this inner boundary, we followed the contours of the 0.5–1.5 keV image to define the width of the extraction region for the spectral analysis. Due to the slight asymmetry, the outer border is not fixed, but varies from 75 to 100 over six azimuthal sectors (labeled S1–S6; see Fig. 7). Qualitatively then, the full halo (FH) region has the shape of an irregular windmill, and contains 11300 net counts over the entire 0.3–8 keV energy range. With no loss of statistical information, we restricted to 0.4–2.5 keV (10700 net counts) for the spectral fitting.
Ten point-like, soft X-ray sources were identified within the halo extraction boundaries by running wavdetect over the selected band. Each of them yields a few tens of counts at most, for an aggregate contribution to the extended emission of less than 3%. Given their minor weight, these point sources were not excluded. Their cumulative spectrum is well reproduced by an absorbed ( cm-2) power law with photon index set to 1.8, whose intrinsic 0.3–8 keV luminosity is 1040 erg s-1 at the distance of NGC 6240. Owing to their location, six are allegedly background AGN (but no optical counterpart is known), while the remaining four, if local to the galaxy, would be definitely ultraluminous X-ray sources (ULXs; e.g., Zezas & Fabbiano 2002). The observed spectral shape is also consistent with the unresolved populations of X-ray active objects, including high- and low-mass X-ray binaries, active binaries, cataclysmic variables (e.g., Fabbiano 2006; Boroson et al. 2011). These sources are associated with the stellar population, hence their contribution to the halo is expected to be negligible. We accounted for any residual emission from the latter classes (as well as for the resolved point sources) by keeping the power-law component in our model.
The bulk of the soft X-ray emission in the halo is presumed to arise from diffuse hot gas, and was then modeled as a thermal spectrum through the vapec code (Smith et al. 2001), which makes use of the AtomDB v2.0.1 atomic database.999http://atomdb.org. An update to v2.0.2 has been recently released (Foster et al. 2012), but our results are not modified (best-fit abundances are only affected at the third digit). The gas emission measure (EM) can be expressed as a function of the vapec normalization through the relation , where and are the electron and hydrogen densities, and is the angular diameter distance to NGC 6240 (102 Mpc). We first considered a single-temperature plasma component, allowing for local (i.e., at the redshift of the source) absorption in addition to the Galactic column density ( cm-2; Kalberla et al. 2005). The model form is then expressed within xspec as wabs*zwabs*(vapec+powerlaw). As mentioned, the halo region provides 10700 counts, almost 90% of which are detected at 0.5–1.5 keV, with an improvement by a factor of 4 with respect to ObsID 1590 alone. This enabled us to assess for the first time individual abundances for iron and each of the main -elements (O, Ne, Mg, Si). For all the other elements we have adopted solar abundances (from Anders & Grevesse 1989). Even if this standard practice might lead to some inaccuracies, it is not really critical here, as the overall contribution of the frozen elements to the best fit is marginal ( 20%). The only possible exception is represented by nickel L-shell emission (6%; see later). We refer to Kim 2012 for a review of all the systematic uncertainties affecting the measure of elemental abundances through X-ray spectral fitting to CCD data.
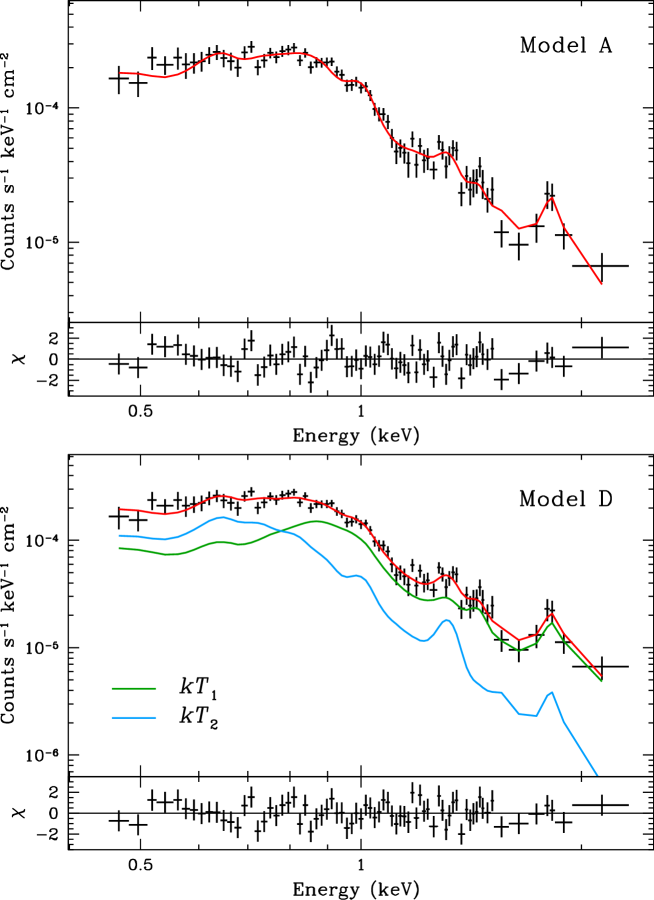
The spectrum of the halo region is plotted in Fig. 8, while the best-fitting parameters are listed in Table 3. Model A applies to the rebinned spectrum, for which the statistic is assumed, while model B is relative to the ungrouped data, treated with -stat (see the Appendix for an overview). The results are in full agreement. Interestingly, the amplitude of the power-law continuum and the column density of the local absorber have a null best-fit value, implying that both components are not required, and that the diffuse, soft X-ray emission can thus be accounted for within a simple thermal scenario (). The upper limit to the 0.3–8 keV power-law luminosity is 4.11040 erg s-1, encompassing the contribution estimated above for the point sources. On the other hand, NGC 6240 is known to host a huge amount of cold gas, but this is concentrated in the nuclear regions (Baan et al. 2007). In model C we fitted the six halo subregions S1–S6 simultaneously with a wabs*vapec model, where the thermal emission is modified by Galactic absorption only. Individual temperatures and metal abundances are tied, and are found to be in good agreement with the fiducial values.
| Mod∗ | A | B | C | D | E |
|---|---|---|---|---|---|
| … | … | … | |||
| … | … | … | |||
| 0.65 | 0.66 | 0.66 | 0.89 | 0.77 | |
| … | … | … | 0.42 | 0.26 | |
| EM1 | 40.5 | 38.7 | 39.5 | 20.1 | 28.1 |
| EM2 | … | … | … | 17.5 | 38.9 |
| 3.76 | 3.73 | 3.74 | 3.81 | 3.84 | |
| 0.50 | 0.54 | 0.53 | 0.44 | 0.22 | |
| 0.57 | 0.62 | 0.58 | 0.39 | 0.83 | |
| 0.43 | 0.46 | 0.43 | 0.68 | 0.76 | |
| 0.46 | 0.47 | 0.44 | 0.59 | 0.57 | |
| 0.11 | 0.12 | 0.11 | 0.18 | 0.15 | |
| 74.2/65 | … | … | 66.1/65 | 63.4/65 | |
| -stat/ | … | 118/124 | 684/685 | … | … |
The main result is a general metal underabundance (by a factor of 2 for -elements) with respect to solar (Table 3). Absolute abundances should be taken with some caution, since they strongly depend on the determination of the continuum, which, in turn, is affected by unknown factors such as absorption, non-thermal components and multi-temperature gas emission (e.g., Kim 2012). We then tried introducing a second thermal component to probe the possible presence in the halo of multi-temperature gas. Due to the heavy degeneracy between the column density and the temperature of the additional gas phase, which favors a statistically equivalent (but physically unacceptable) solution,101010A column of cm-2 over the full halo extent would imply a mass of cold gas of 10. we have dropped both local absorption and power-law continuum, adopting a wabs*(vapec+vapec) form (model D). The goodness of fit is significantly increased (), and calls for a mixed plasma with keV and keV, while the two emission measures are comparable. The results are illustrated in Fig. 8, and summarized in Table 3. Notably, there is no substantial change in the abundances of iron and of the main -elements, which were still allowed to be different fractions of solar, but were tied between the two gas components since they cannot be constrained separately. In model E, instead, abundance was fixed to 0.1 solar for all the elements in the low-temperature component. Both and decrease by 0.15 keV, yet the fit is further improved ( with the same degrees of freedom), supporting the presence of complex physical conditions in the halo of NGC 6240. This notwithstanding, the single-temperature model clearly represents a sound approximation to the data, and provides useful parameters for the purpose of this work.
As a further test, we considered the possibility that collisional ionization equilibrium (the underlying assumption of the vapec code) is not met by the shock-heated gas in the halo. NGC 6240 is undergoing a violent, merger-induced starburst phase, which is responsible for most of the system’s 10 IR luminosity (Lutz et al. 2003; Nardini et al. 2009). The last major burst of star formation is estimated to have occurred 20 Myr ago (Tecza et al. 2000). Whether a pre-existing halo medium is swept up and shock-heated by a starburst-driven wind, or shocks are taking place inside the wind material itself, a low-density ( cm-3) gas may have not recovered ionization equilibrium conditions yet. The typical, density-weighted time-scale for plasma to reach equilibrium is cm-3 s (Masai 1994; Smith & Hughes 2010). We then switched from vapec to the non-equilibrium model vnei (Borkowski et al. 2001), fixing the ionization time-scale parameter at cm-3 s. This returned a much poorer spectral description (), hence we did not pursue this interpretation any further. Incidentally, by taking cm-3 s we obtained , proving that vnei, if unconstrained, tends to converge towards an equilibrium solution.
Finally, we investigated the nickel L-shell issue in more detail, by repeating the spectral fits (model A) with different values of nickel abundance. This was in turn fixed to half-solar, solar and twice-solar, tied to iron and left free. This check delivers a nearly evenly-spaced grid of values, from which we can draw some qualitative considerations in spite of the large uncertainties involved. Although the corresponding best fit is still broadly acceptable (null hypothesis probability of 11%), the assumption of results in a significant worsening on statistical grounds (). Indeed, nearly solar values of are definitely preferred. Equivalent results were found with -stat on the ungrouped spectra. Once an obvious nickel underabundance is ruled out, most elements are virtually unaffected by the exact entry for , due to the substantial difference from nickel in either total contribution (Fe) or energy (O, Mg, Si). Conversely, neon abundance varies systematically with , decreasing by a factor of 3 as nickel changes from half to twice solar, as the two elements are very similar in both flux and energy. Thawing has a negligible effect on the goodness of fit (). An -test gives a probability of chance improvement of 48%. The best-fit value is , but poorly constrained in the 0.5–2.5 range. We have therefore kept nickel abundance frozen to solar for all the subsequent analysis.
4.2 Radial Analysis
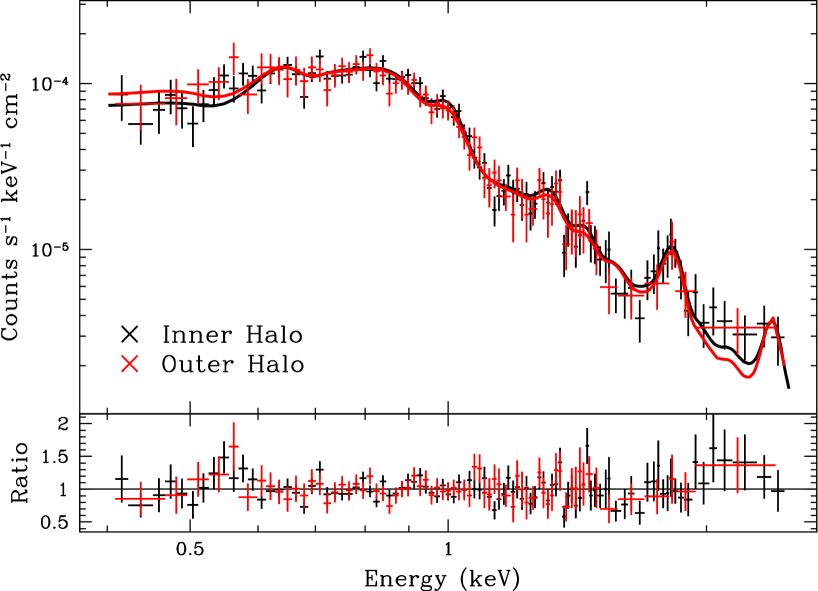
Given the fairly large amount of total net counts available, the next step is to embark upon a spatially-resolved analysis aimed at revealing any temperature and/or metallicity gradient within different zones of the halo. We first searched for some trend in the radial direction, and selected two annular regions corresponding to the inner (IH; –36) and outer (OH; –80) halo (see Fig. 7). The IH/OH transition radius was adaptively chosen to ensure an equal number of source counts (4500) in the 0.5–1.5 keV energy band. Due to the different areas (by a factor of 5), however, the S/N in the two subregions is quite different (see Table 4). In the following, we systematically refer to the analysis of the ungrouped spectra, which preserve the intrinsic ACIS-S energy resolution. This entails sounder measures and more reliable comparisons among elemental abundances, as Mg and Si lines fall in a rather noisy spectral range. Even the O–Fe–Ne blend can be affected by a conservative rebinning like the one adopted to employ the minimization.
| Reg | Reg | ||||||
|---|---|---|---|---|---|---|---|
| FH | 9463147 | 10675173 | 63.7 | IH | 456072 | 517679 | 86.2 |
| S1 | 157752 | 174260 | 58.2 | OH | 4526103 | 5084120 | 56.6 |
| S2 | 157548 | 177754 | 67.3 | H1 | 183744 | 210848 | 91.6 |
| S3 | 158347 | 177552 | 70.5 | H2 | 180245 | 204450 | 84.8 |
| S4 | 157953 | 177561 | 57.4 | H3 | 182648 | 203253 | 76.7 |
| S5 | 158147 | 178853 | 69.3 | H4 | 181652 | 203059 | 66.6 |
| S6 | 156850 | 182057 | 63.3 | H5 | 180470 | 204683 | 44.7 |
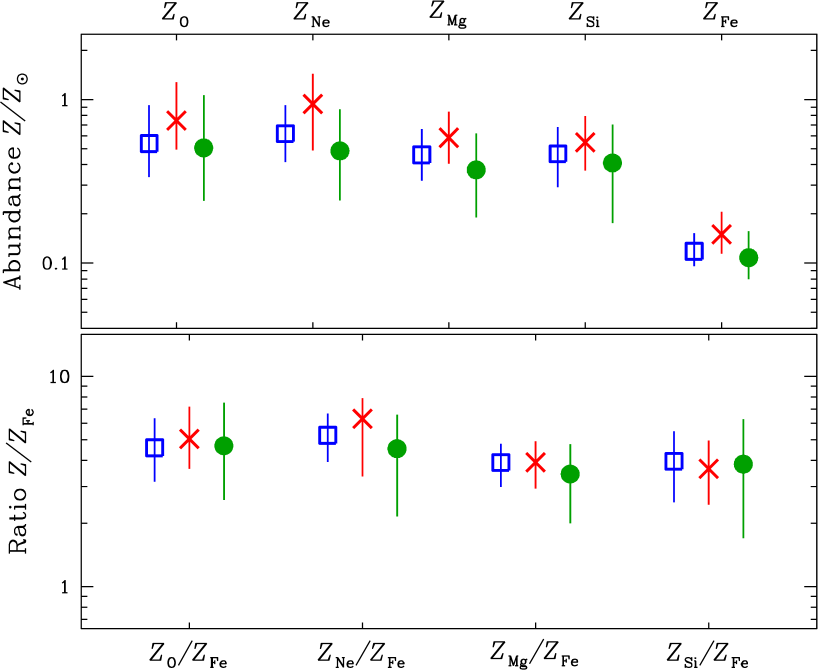
We have then used model B for the IH and OH fits. A marginal power-law component is possibly present in the IH region, consistent with the luminosity of the point sources that fall in that field. The upper limit to the total power-law contribution is in good agreement with the previous estimates in Table 3. The two IH and OH plasma temperatures are identical to the fiducial FH value, and again no local absorber is required. Ultimately, the two spectra are remarkably alike (Fig. 9). The most significant comparison concerns abundances, as illustrated in Fig. 10. In spite of the overlapping error bars, for each element the best-fitting OH values are systematically lower than the IH ones, suggesting a slight metallicity drop at larger distances. By disentangling the core and halo spectra, a similar result had been already found by Huo et al. (2004), who used a simplified model to fit the ObsID 1590 data (see also Grimes et al. 2005). Although negligible when considering the single element, the overall effect is significant at the 2 level. As already mentioned, however, absolute abundances can be somewhat misleading. Relative abundances (i.e., abundance ratios between two elements) are usually more reliable, as the prominence of the different lines is altered in a similar way by any incorrect subtraction of the underlying emission. The decreasing trend is not seen in the abundance ratios. This can be explained in either of the following ways: (1) the observed metallicity drop is artificial, likely induced by an inaccurate determination of the continuum; (2) the negative radial gradient has a physical origin, possibly related to the dilution of a metal-enriched gas outflow. Both interpretations are consistent with the apparent behavior of absolute and relative abundances.
Although the IH/OH analysis revealed no clear trend for either temperature or metallicity, we proceeded with a finer annular sampling of the halo. This is desirable in order to obtain a radial profile of the gas density as a function of the emission measures (see later). Following the same adaptive criterion, we selected five regions within –80 (H1–H5, with intermediate radii of 21.8, 30.8, 41.8, and 55.5), containing 1800 net counts each at 0.5–1.5 keV (Table 4). Model C was applied in the spectral analysis, with temperatures free and abundances tied to their average values. We also made use of the deprojection technique available through the xspec model component projct. Indeed, since we can only probe the footprint of the emitting source on the plane of the sky, a system with a rough spherical symmetry is subject to some degree of radial mixing: the emission observed in a given annulus also includes a contribution from material located at larger distances. In this case, however, deprojection does not result in any significant difference, confirming the suggested lack of strong radial gradients. Only emission measures experience some variations, but the correction involved for the gas density is still limited ( 30%), and therefore has been disregarded.
4.3 Azimuthal Analysis
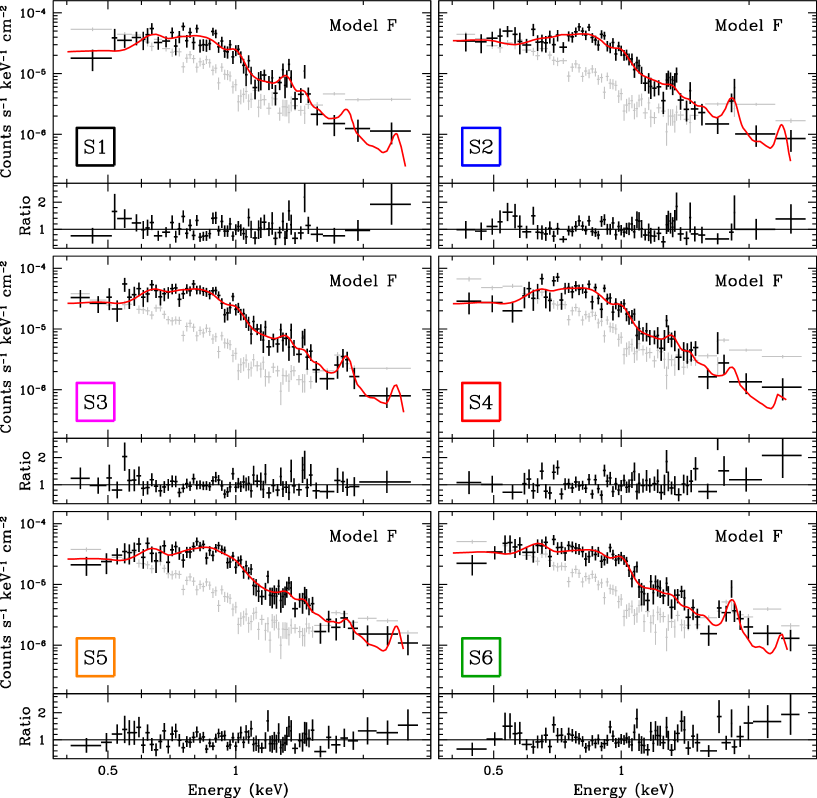
As discussed above, radial variations, if any, are limited. A possible, partial explanation is that the integration over the polar angle smooths out most of the existing differences. From Figs. 1 and 4, in fact, one can easily appreciate that the surface brightness profile depends on the direction along which it is evaluated. Several structures, outstanding for intensity and/or extent, are confined in narrow azimuthal sectors, so that the relative information might be lost in a purely radial analysis. The aforementioned azimuthal regions S1–S6 (Fig. 7) were adaptively selected following the morphological appearance, and imposing that each key feature is sharply singled out, most notably the wings of the cross-like pattern. Each sector includes 1800 net counts at 0.4–2.5 keV, which represent 60–70% of the total collected events (see Table 4). We then made use of two new models, F and G, both based on the simple wabs*vapec form. This choice is fully justified by our preliminary analysis, demonstrating that any additional spectral component is redundant, apart from a thermal one (which, however, cannot be explored over the individual zones).111111The presence of localized absorption and non-thermal emission in the single regions has been ruled out by adding back into the model, one at a time, the corresponding spectral component.
| Reg | Mod | EM | -stat/ | ||||||
|---|---|---|---|---|---|---|---|---|---|
| S1 | F | 0.65 | 4.9 | 0.85 | 0.92 | 0.98 | 0.40 | 0.16 | 119.5/103 |
| G | 0.66 | 6.5 | 0.60 | 0.52 | 0.66 | 0.27 | 0.11 | 125.4/103 | |
| S2 | F | 0.63 | 8.3 | 0.22 | 0.35 | 0.20 | 0.48 | 0.10 | 114.4/114 |
| G | 0.67 | 6.5 | 0.42 | 0.51 | 0.24 | 0.51 | 0.14 | 120.9/114 | |
| S3 | F | 0.66 | 5.9 | 0.69 | 0.54 | 0.56 | 0.54 | 0.14 | 83.3/108 |
| G | 0.66 | 6.5 | 0.64 | 0.37 | 0.43 | 0.45 | 0.13 | 86.6/108 | |
| S4 | F | 0.64 | 5.8 | 0.62 | 0.65 | 0.58 | 0.31 | 0.16 | 102.8/99 |
| G | 0.64 | 6.6 | 0.60 | 0.41 | 0.37 | 0.18 | 0.15 | 108.7/99 | |
| S5 | F | 0.82 | 6.1 | 0.78 | 0.23 | 0.47 | 0.19 | 0.14 | 102.8/117 |
| G | 0.78 | 7.0 | 0.34 | 0.88 | 0.57 | 0.34 | 0.09 | 121.0/117 | |
| S6 | F | 0.65 | 7.4 | 0.55 | 0.67 | 0.21 | 0.74 | 0.07 | 106.5/114 |
| G | 0.75 | 5.5 | 0.64 | 0.86 | 0.37 | 0.88 | 0.08 | 121.9/114 |
At first, we took the most general approach of dealing with each subregion independently (model F). The six spectra and their best fits are shown in Fig. 11. The results for the individual gas temperatures and abundances are summarized in Table 5, and plotted in Figs. 12 and 13. Evidence for a slightly hotter gas component is found in S5, and also abundance measures provisionally hint at sizable gradients. The error bars are quite large, though. With model G, we have therefore adopted an alternative strategy to reduce both the systematic and the statistical uncertainties on absolute and relative abundances. The basic idea is to take advantage of the fact that the extent of any variation across the halo has proven to be rather limited. This allowed us to extract some additional information by investigating the behavior of each of the key spectral parameters separately, with all the other variables tied (but not frozen) to their average value.
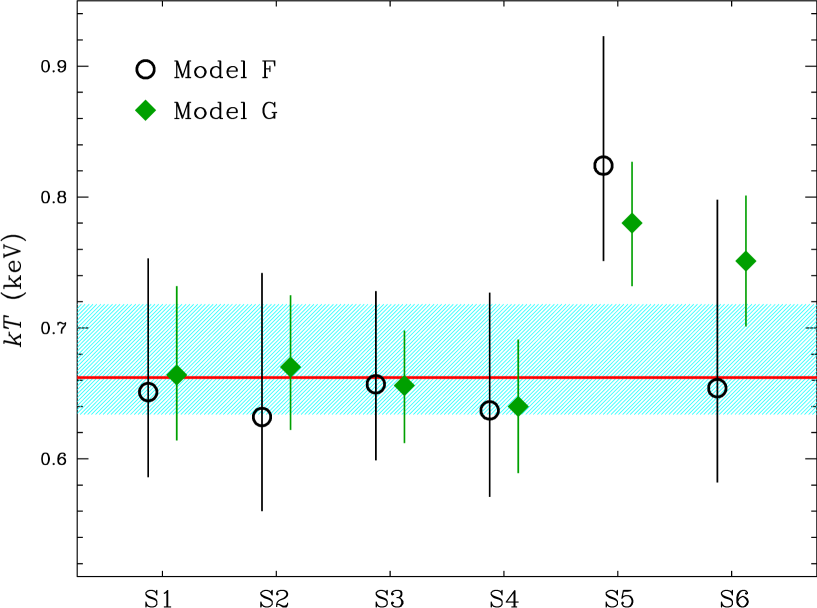
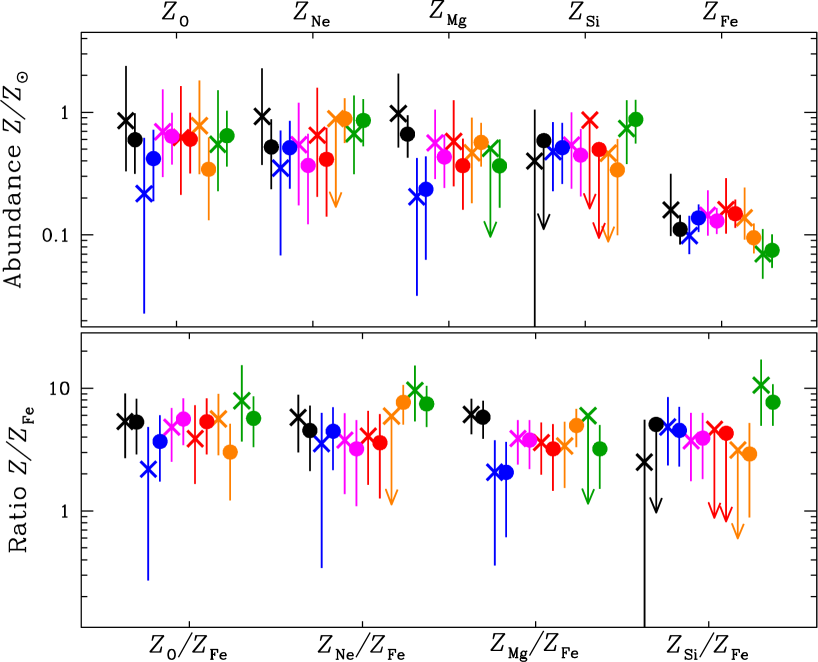
We created in turn six spatial maps for , and O, Mg, Ne, Si, Fe abundances by performing a simultaneous fit of the S1–S6 regions, with the single observable of interest free to vary in the different spectra and the other parameters (apart from the normalization) tied to a common value. According to this method, Table 5 should be read along rows for model F only. The physical information from model G is conveyed by columns, which correspond to a specific temperature or abundance map. Since no quantity is frozen, every fit delivers an independent set of average values for the collateral parameters. Not surprisingly, these are always coincident (typically within 5–10%) with the results of model C, where temperatures and abundances are all tied over S1–S6, and from which the entries for emission measure and -stat (evaluated on the single region of interest) have been taken.
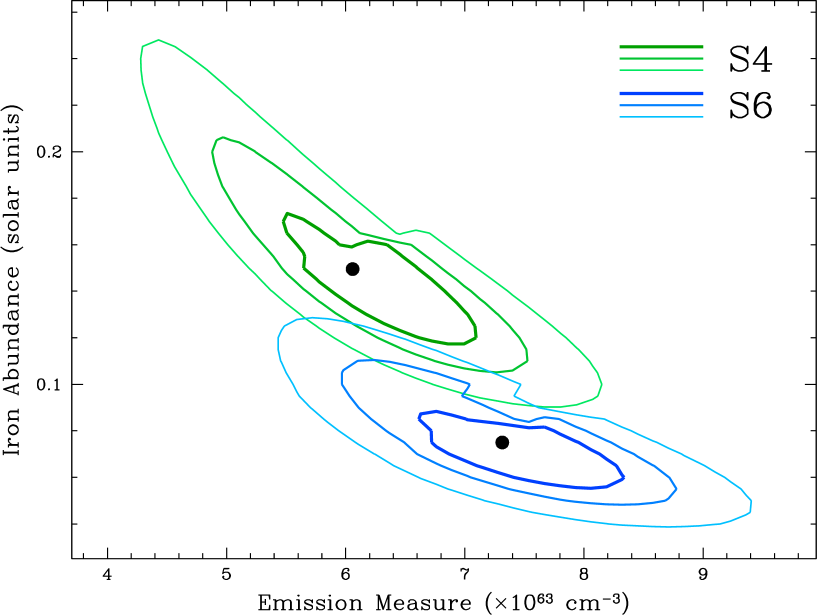
Model G effectively returns smaller error bars, as illustrated in Figs. 12 and 13. This result is not actually achieved at the expense of accuracy. The measure of individual abundances, in first approximation, relies on a specific, narrow energy range, whose continuum is now constrained over the full halo. The fact that -stat undergoes just tiny increments with respect to model F, when assessed over the single regions, implies that the entire soft X-ray spectrum is well reproduced, not only the band of interest for each abundance map. This further confirms the reliability of our approach. The last sensitive issue to investigate is the possible degeneracy between iron abundance and emission measure, which can partly weaken the significance of any gradient. In spite of the low value, iron L-shell contribution is still dominant, and it is difficult to disentangle from the continuum at CCD resolution. In Fig. 14 we show the –EM confidence contours for the two regions (S4 and S6) with the larger difference (2.8) in , proving that such effect is minimal. A gradient of iron abundance in the halo is then detected with a 2 significance. With little dependence on the specific model (see Fig. 13), a similar result possibly holds for magnesium, while for all the other -elements error bars are still too large to draw any conclusion.
4.4 Physical Parameters
The key physical properties (density, mass, pressure, thermal energy) of the X-ray emitting gas can be inferred from the results of the spectral analysis, provided that the volume of the halo is estimated. We assumed that the thickness of the system is comparable to its width. This is a reasonable approximation for a merger about to enter the final coalescence stage like NGC 6240. Moreover, the main galactic body in the optical is reminiscent of a distorted edge-on disk (Gerssen et al. 2004), implying a substantial span along the line of sight. A nearly face-on configuration (like in the case of the Antennae, NGC 4038/4039; Fabbiano et al. 2003) does not seem to apply here, and can be safely ruled out. Based on this conjecture, we computed the volume of the halo as follows:
where is the surface derived for each of the six azimuthal regions S1–S6 from the 3 contour of Fig. 1, and and are the outer radius (in kpc) and the central angle (in radians) of the individual sectors. We eventually obtained that kpc3. In the detailed calculations we have also taken into account the geometrical projection effects. This is mainly relevant to the volumes of the annular regions H1–H5, which strongly depend on the radius of the embedding sphere, taken to be 100 (). Such correction is negligible (roughly 1%) on , also in the light of the large systematic uncertainties.
| Reg | Mod | ||||||
|---|---|---|---|---|---|---|---|
| FH | B | 6.31 | 2.5 | 13.1 | 5.2 | 49 | 3.7 |
| H1 | C | 0.54 | 3.6 | 1.7 | 8.3 | 6.7 | 2.6 |
| H2 | C | 1.00 | 2.6 | 2.2 | 5.6 | 8.5 | 3.3 |
| H3 | C | 1.63 | 2.1 | 2.8 | 4.4 | 10.7 | 4.2 |
| H4 | C | 2.48 | 1.7 | 3.5 | 3.7 | 13.7 | 5.5 |
| H5 | C | 2.95 | 1.5 | 3.8 | 3.0 | 13.2 | 5.3 |
| S1 | F | 1.02 | 2.2 | 1.9 | 4.5 | 7.0 | 3.4 |
| S2 | F | 1.06 | 2.8 | 2.5 | 5.7 | 9.0 | 3.9 |
| S3 | F | 0.67 | 3.0 | 1.7 | 6.3 | 6.3 | 2.8 |
| S4 | F | 1.25 | 2.1 | 2.3 | 4.4 | 8.2 | 3.8 |
| S5 | F | 0.99 | 2.5 | 2.1 | 6.5 | 9.7 | 4.4 |
| S6 | F | 1.32 | 2.4 | 2.6 | 5.0 | 9.9 | 4.3 |
It is actually the effective volume occupied by the gas that matters for the estimate of the physical properties. This is related to the geometrical volume through the expression , where encompasses both the filling factor of the emitting gas and any correction scale factor. Assuming , the emission measure can be written as , from which we extracted the electron density, and hence the gas pressure , mass and thermal energy . The cooling time was estimated as the ratio between the thermal energy content and the 0.3–8 keV thermal luminosity, inferred from the spectral fits. Our results for the full halo and its different subregions are presented in Table 6, and their main implications are discussed in the next Section.
All the physical quantities mentioned above contain the unknown filling factor , which cannot be directly constrained. Hydrodynamic simulations suggest that the low-density, hot gas component ( cm-2, K) in starburst-driven winds is volume-filling (), even if its contribution to the soft X-ray emission may not be dominant (e.g., Strickland & Stevens 2000). Since the dependence from is mild (, , while , , ), the estimates given in Table 6 correspond to , keeping in mind that the actual values can differ by a factor of two or more.
5 Discussion
The smoothed soft X-ray images of NGC 6240 reveal a spectacular halo of hot gas, with an average radial extent of 50 kpc. Its total luminosity in excess of 41041 erg s-1 is comparable to that of small groups of galaxies (Mulchaey 2000) and giant ellipticals (Canizares et al. 1987; Mathews & Brighenti 2003), while its age can be provisionally estimated through the sound-crossing time. The adiabatic sound speed in a gas with keV (7.5 million K), and mean molecular weight (as per a fully-ionized, primordial plasma), is km s-1, resulting in a dynamical age of 200 Myr. In this Section we consider thoroughly all the viable physical explanations for the observed halo luminosity, size, temperature, morphology, and metallicity, in order to achieve a self-consistent interpretation, and discuss the origin and possible evolution of the system.
5.1 Galaxy Merger
Close interactions and mergers represent the most critical stage of galaxy evolution over cosmic time. Both models and observations indicate that, after the collision of a pair of massive, gas-rich spirals, the kinematic and structural properties of the remnant are consistent with elliptical galaxies (e.g., Barnes 1988; Dasyra et al. 2006). The relation between mergers and hot gaseous halos, instead, is still rather controversial. The first encounter of the progenitor disks may lead to substantial heating, through the dissipation of the kinetic energy in the gas components and the formation of copious shocks in the contact layers. In the present case, the former mechanism is largely insufficient. Assuming two identical progenitors, the amount of kinetic energy deposited during the merger is roughly , where is the mass of the X-ray emitting gas and is the relative speed during the collision. The thermal energy content of the halo (1058 erg) corresponds to km s-1, which is nearly twice the velocity observed in the Taffy Galaxies (Braine et al. 2003), a characteristic example of a head-on collision.121212Note that this estimate is independent of the filling factor and the actual values of and , since both quantities vary as .
On the other hand, the same halo luminosity is probably too large for the interaction of two galaxies with properties similar to the Milky Way. The peak of the X-ray luminosity in galaxy mergers is attained with the final coalescence, or shortly before (Brassington et al. 2007). According to simulations, its value depends on several factors, among which the size and the gas fraction of the progenitors, the orbital parameters, and the relative orientation. The overall complexity is a possible reason for which extended X-ray emission is not systematically found in mergers. In principle, also the presence of a supermassive black hole has an important role in the gas heating and its subsequent dispersion (Cox et al. 2006). In NGC 6240, the AGN pair is believed to contribute significantly to the bolometric luminosity (Lutz et al. 2003; Egami et al. 2006), yet their direct feedback on the circumnuclear environment is difficult to establish. Their impact has presumably been negligible so far, as both nuclei are still completely enshrouded by a thick shell of dust and gas (Iwasawa & Comastri 1998; Vignati et al. 1999). In this view, unless the aforementioned physical parameters are unusually fine-tuned, a maximum erg s-1 can be reached only if the progenitors are much more massive than the Milky Way (see also below). This makes of NGC 6240 an exceptional case study with respect to both the observations of known systems and the numerical simulations of mergers. Accepting that NGC 6240 is now at its peak X-ray luminosity, in fact, it should be kept in mind that the entire, diffuse X-ray emission is 3 times that of the halo alone.
The tidal forces can be responsible for the presence of hot gas at large distance from the center. The arms of the wide, cross-like morphological feature are openly suggestive of the typical tidal tails observed in mergers, but they have no detected counterpart at different wavelengths. Another problematic point resides in the gas temperature. When swept by an adiabatic shock, the gas is heated to , where is the speed of the shock front (Hollenbach & McKee 1979). The velocity required to produce a temperature of 0.65 keV is km s-1, which is still too high when compared to the inferred orbital velocity of the two nuclei of NGC 6240 (155 km s-1; Tecza et al. 2000), even if the rotation of the parent disks is taken into account. Finally, the inelastic nature of the galaxy merger does not seem capable of accounting for the energetics of the X-ray halo. Yet, the ongoing nuclear starburst is itself triggered by the global redistribution of the gas components that follows the strong gravitational disturbances, and represents a much more efficient energy source.
5.2 Starburst Wind
During a starburst, the formation of young, massive stars persists until the depletion of the molecular gas reservoir and/or the onset of some self-regulation mechanism. This activity leads to intense mass loss, stellar winds and frequent supernova (SN) explosions. The resultant deposition of energy, momentum and metals into the intergalactic medium is a key driver of galaxy evolution. Based on the stellar -band emission of NGC 6240, Tecza et al. (2000) evinced that a short (5 Myr) burst of star formation took place 20 Myr ago, possibly coincident with the latest perigalactic passage (but see Engel et al. 2010b). As the mechanical energy injected by a starburst is roughly 1% of its bolometric luminosity (e.g., Leitherer et al. 1999), and the total luminosity of NGC 6240 is 1045 erg s-1 (Armus et al. 2006), it takes at least 50 Myr for the starburst to supply the estimated thermal energy content of the X-ray halo, neglecting the AGN contribution to . It is therefore highly questionable whether the halo is a direct consequence of the most recent starburst episode, also considering its huge size, which calls for an average outflow velocity of 2500 km s-1 over the last 20 Myr. This would be actually consistent with the fastest shocks we identified in the central 5 kpc (Wang et al. 2013a), so the key issue is whether an outflow could sustain a similar expansion rate for several tens of kpc.
In the classical model of starburst-driven winds (Chevalier & Clegg 1985), the terminal outward velocity is , where and are the energy and mass injection rates, respectively. By adopting a standard mechanical energy input of 1051 erg per SN (Chevalier 1977), and an average SN mass of 10 with intrinsic mass deposition fraction of 10%, we can write km s-1, where the thermalization efficiency accounts for any radiative losses, and the mass-loading factor is the ratio between the total mass of the gas heated within the starburst and the mass of the direct SN ejecta (Veilleux et al. 2005). The obvious effect of radiative losses and mass loading is to slow down the wind. In the absence of observational constraints for and , the previous expressions can be rearranged further into the fully equivalent , which brings out the dependence on the central gas temperature only (Strickland & Heckman 2009). By approximating with the nearly constant halo temperature, we obtain that km s-1, commensurate with the average width of the optical line-emitting gas (Heckman et al. 1990), and with the terminal velocity of the nuclear outflow determined from the blueshifted Na i 5890, 5896 doublet (Na D) absorption (Heckman et al. 2000).
Alternatively, we assume that , and attempt to assess for a constant mass injection rate since the putative epoch of the most recent starburst. The SN rate in NGC 6240, as derived from the non-thermal radio continuum emission, is 2 yr-1 (van der Werf et al. 1993; Beswick et al. 2001). This value strongly depends on the star formation history adopted (continuous, instantaneous or merger-induced), and is possibly overestimated by up to an order of magnitude (Engel et al. 2010b). At least, it represents a useful upper limit for the present purpose.131313Interestingly, among the various estimates considered in Wang et al. (2013a), we obtained a SN rate of 3 yr-1, using the correlation between [Fe ii] at 1.26 m and SN rate found in nearby starburst galaxies (Rosenberg et al. 2012). A total mass of hot gas in the halo of 10 (Table 6) indicates that . Taken at the face value, this would imply a mass loading efficiency (i.e., the mass outflow rate normalized to the star formation rate) larger than one, which is not unusual among ULIRGs (Rupke et al. 2005), and is comparable to that inferred for similar IR-luminous, merging systems like Mrk 266 (Wang et al. 1997) and Arp 299 (Heckman et al. 1999). In both of the latter cases, however, the dynamical age of the X-ray nebula is broadly consistent with the typical starburst lifetime. In NGC 6240, such a substantial mass loading would correspond to km s-1, in excellent agreement with our previous estimate. In conclusion, any galactic wind originating some 20 Myr ago must have traveled for 10–15 kpc at most. Remarkably, this is just beyond the size of the optical nebula and of the soft X-ray core.
The two equivalent expressions for the terminal velocity used above are derived from wind models that neglect both ambient gas and gravitational forces. The mass-loading is centralized (i.e., it takes place within the starburst region itself), and is typically limited to a few per SN (; Suchkov et al. 1996). The archetypal source to which these analytical models and hydrodynamical simulations are compared is M82, since it is isolated, contains no AGN, and the hot gas is free to escape perpendicular to the galactic plane (Griffiths et al. 2000). The huge mass loading required for mergers, instead, implies the entrainment of tens to hundreds of per SN in the ambient material swept by the wind. In a ULIRG-like system, due to the high density and the disturbed geometry, it is plausible that the conversion of mechanical energy into radiation is much less efficient than in M82-like starbursts (e.g., Colina et al. 2004), and even that outflows expand only over little distances before terminating. However, as the clumpy morphological structures in NGC 6240 reach out to the largest physical scales, a wind nature for the entire halo cannot be conclusively rejected. Enhanced star formation with respect to quiescent galaxies has been likely in place since the beginning of the interaction, dated to several hundreds of Myr ago. Moreover, in these earlier times the additional momentum injection due to the AGN radiation pressure could have been non negligible, with a possible boost effect on the starburst outflows.
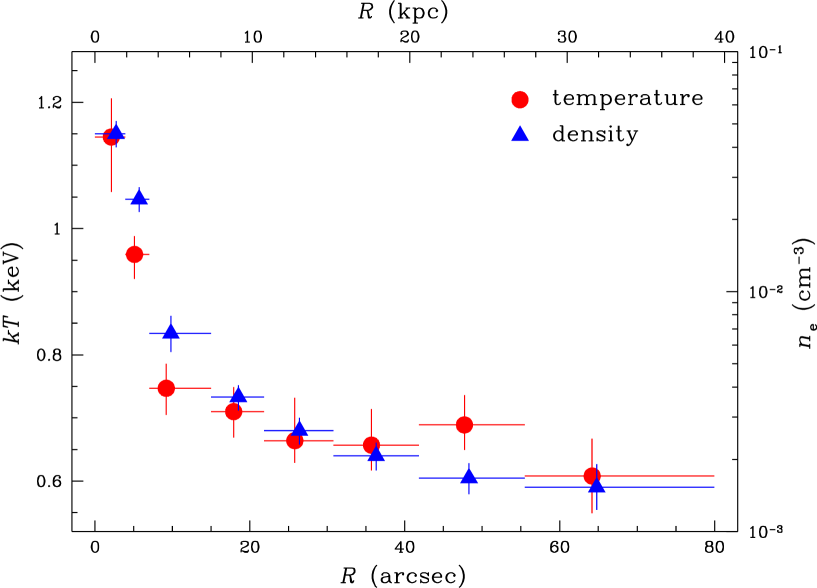
The secular wind scenario, in keeping with the dynamical age of 200 Myr, can be probed through the average halo properties. In particular, the gas density in a freely expanding wind should decrease as , as a consequence of the mass conservation law with constant outflow velocity at large distances. If the gas is nearly isothermal, the observed luminosity is related to the emission measure in a straightforward manner, hence the surface brightness is expected to exhibit a power-law dependence on radius as well: qualitatively, . Incidentally, this behavior was first observed in M82 with Einstein (Fabbiano 1988). We have then fitted the radial profile of Fig. 3 at distances kpc, to avoid any contamination from the core component. As already indicated by the large scale radius in the -model fit (Table 2), a power-law shape gives a very poor description () of the average surface brightness. Indeed, over the range explored, follows very well () an exponential decline with scale length kpc. The temperature and density profiles are plotted in Fig. 15. Although only five measurements are available from the spectral fits to regions H1–H5, and the relative uncertainties are quite large, the halo gas density decreases with radius as with , showing a milder trend with respect to a single adiabatic flow. The temperature is consistent with being constant beyond 5 kpc. These features could be explained by the superposition of successive winds emanating from different locations, suggesting a widespread rather than centrally-concentrated starburst.
For completeness, we have extended the and profiles to smaller radii by extracting the spectra from three annular regions in the core, which provides twice as many counts as the halo over the 0.5–1.5 keV energy range. In this case, our single thermal model is purely phenomenological, since a multi-temperature plasma is known to be present in the nuclear environment (Netzer et al. 2005; Wang et al. 2013a). This was partly compensated through the power-law component, whose photon index was left free to vary and constrained up to 5 keV. Moderate column densities (a few 1021 cm-2 around the nuclei, then reducing with distance) were also required. In brief, within the inner regions the gas density becomes compatible with the trend, while a central temperature –1.5 keV does not substantially modify the wind expansion range suggested above. This simplified, preliminary analysis confirms that the soft X-ray emission in the core of NGC 6240, which is spatially correlated with the H filaments, is most likely dominated by shock-heated material in a recent starburst-driven wind, whose connection with the simultaneous black hole growth (e.g., King 2005) is hard to determine. As the detailed study of this component is the subject of a companion paper (Wang et al. 2013b), its physical properties are not discussed further in this context.
5.3 Dark Matter
The large deviations from a classical wind model, in particular the flat temperature distribution, hint at near-isothermal, hydrostatic equilibrium. Together with the long cooling time (a few Gyr), this implies some form of gravitational confinement. Given the extent of the hot-gas halo, the baryonic matter is likely just a fraction of the total gravitating mass. Assuming the existence of a dark matter halo with an NFW density profile (Navarro et al. 1997), the gas virial temperature can be written as follows:
where is the virial radius, usually taken to enclose an overdensity by a factor of 200 with respect to either the mean or the critical cosmic value at the time of the gravitational collapse, and the virial mass within the corresponding volume, serving as a proxy for the total halo mass. Accordingly, the dark halo of NGC 6240 has to be both massive and compact in order to confine the soft X-ray emitting gas within its potential well. Making use of the relations in Mo & White (2002) we can render explicit the dependence of on mass and redshift, obtaining that keV, where is the virial mass expressed in units of 10.
A possible evolutionary scenario consistent with the observed gas temperature of 0.65 keV is that of a cold dark matter halo formed at , with a total mass of 10. This value marks the standard separation between galaxy-scale and group-scale halos (see Humphrey et al. 2006). For comparison, the Milky Way is estimated to have a virial mass of 1.310 (McMillan 2011). NGC 6240 is then consistent with the central remnant of a group of galaxies. This interpretation was first proposed by Huo et al. (2004), considering the huge content of hot gas (), the low metallicity of the outer halo, and the large velocity dispersion (the full width at zero intensity of CO emission lines reaches up to 1400 km s-1; Feruglio et al. 2012). However, no evidence has been reported so far of a present-day galaxy overdensity in the surroundings of NGC 6240. Any other group member may have experienced a merger in the past, but in this case the progenitors of the final coalescence we are now witnessing would be elliptical-like, or highly irregular, rather than disk-like.
The degree of the uncertainties involved in linking the spectroscopic and virial temperatures (e.g., Ciotti & Pellegrini 2008), and some ambiguity in the definitions themselves (e.g., Voit 2005), should also be kept in mind. Moreover, the gas temperature estimated through the single thermal model is only a first approximation, and could be somewhat unreliable. The best fit to the full halo spectrum calls for two components with different temperatures and abundances (model E). It is then reasonable to associate the warmer ( keV) and metal-richer ( solar) component with the chemically-evolved, starburst-injected gas, and to identify the cooler ( keV) and metal-poorer ( solar) component with the gravitationally-bound, pre-existing halo material. Also the energy dissipated during the merger process may contribute to the heating of the ambient gas. In this view, a fossil group nature for the system would not be strictly required, and the dark matter halo of NGC 6240 would be broadly consistent with just a pair of massive spiral galaxies.
The lower temperature of 0.25 keV would be also in good agreement with the virial temperature keV derived from the average stellar velocity dispersion, –220 km s-1 (Engel et al. 2010b). This comparison is physically motivated only for early-type galaxies (e.g., Pellegrini 2011), which are actually believed to represent the ultimate evolutionary stage of a major merger such as NGC 6240. Although the potential of the nuclear dynamical mass is expected not to be dominant on the halo scales, the stellar radial surface brightness profile follows the law typical of elliptical galaxies out to 20–25 kpc (Bush et al. 2008). While some of the disk-like structures are still present, the whole remnant has apparently entered the final relaxation phase.
5.4 Metal Enrichment
Another primary source of information to understand the nature of the X-ray halo is the metallicity pattern, including absolute and relative abundances and their dependence on galactocentric distance. The average -element to iron abundance ratio turns out to be generally supersolar all across the halo (Table 7). This is a key observable to trace the chemical evolution of the interstellar matter, due to the different production yields and typical time-scales of the various SNe populations involved. Synthesis models for type II SNe (i.e., core-collapsed massive stars) predict Si/Fe ratios up to 3–5 solar (e.g., Nomoto et al. 2006), while these drop to 0.5 solar for type Ia SNe (i.e., exploded white dwarfs in close binary systems). Evidence for a supersolar Si/Fe ratio, for instance, was found in galaxy mergers like the Antennae (Baldi et al. 2006a,b), and has been recently revealed in the central regions of young elliptical galaxies, which are the sites of the latest (a few tens of Myr), merger-induced star formation (Kim et al. 2012).
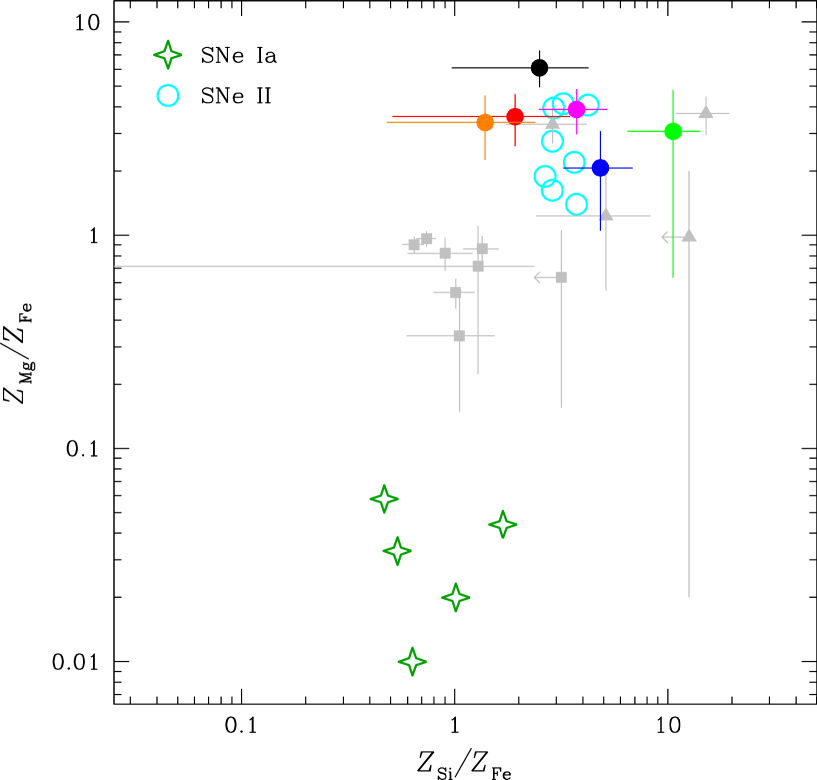
In Fig. 16 the abundance ratios and are plotted against each other as diagnostics of the enrichment history in the six azimuthal sectors of the halo. For comparison, the same values are shown for different regions of the disturbed spiral galaxy NGC 4490, which is interacting with the nearby irregular companion NGC 4485 (Richings et al. 2010), and of the elliptical galaxies analyzed by Kim et al. (2012). In such a diagram, the theoretical yields from various models of type Ia SNe (Nomoto et al. 1997) and type II SNe (Nagataki & Sato 1998) have a wide separation. All of the S1–S6 halo subregions definitely occupy the typical location of starburst environments, dominated by a young stellar population and type II SNe. From an evolutionary perspective, NGC 6240 should gradually move towards the intermediate position of early-type galaxies, following the takeover by type Ia SNe after the merger completion and the starburst fading.
There is actually a possible caveat to the picture outlined above. By assuming in our fits a solar abundance for nickel, we obtain a nominal Ni/Fe ratio 7 times above solar in the full halo. Similar findings have been discussed over the past two/three decades for SN remnants (based on the strength of forbidden optical/near-IR [Ni ii] lines; e.g., Bautista et al. 1996) and galaxy clusters (e.g., Dupke & White 2000). On average, type Ia SNe are expected to have a much higher production yield for nickel with respect to type II SNe. A large relative abundance of nickel, if real, would imply a more complex enrichment history. As mentioned before, however, can only be poorly constrained, due to its degeneracy with . Our assumption of a single thermal component might also introduce some bias. Indeed, by tying nickel and iron abundances in the two-temperature model D we achieve a statistically equivalent fit, with , and just an increase of to 0.6 solar. In general, the best-fitting abundance ratios from model D are slightly lower (Table 7), but still in excellent agreement with the predicted yields of type II SNe for all elements, nickel included.
Based on the above considerations, the whole halo of NGC 6240 appears to have experienced a significant metal enrichment by type II SNe. The constant abundance ratios in the inner and outer halo imply that the enrichment process has been uniform. As a consequence, the gas redistribution cannot be associated to recent starburst episodes, but has rather proceeded in the whole course of the interaction, whose timescale up to now is presumably 1 Gyr. Mergers of identical disk galaxies with massive stellar bulges are characterized by a single, intense peak of star formation during the nuclear coalescence (Springel et al. 2005; Cox et al. 2008). Entering this major burst, NGC 6240 is going to exceed the ULIRG luminosity threshold (Tacconi et al. 1999). The final stage is not imminent yet, since the two nuclei (which are the remnant of the progenitors’ bulges) still have a projected separation of 0.8 kpc (1.5; Max et al. 2007) and are possibly in the process of separating again (Tecza et al. 2000; Engel et al. 2010b). This notwithstanding, the identification of several tens of young circumnuclear star clusters, with ages in the range 5–15 Myr, confirms that enhanced star formation activity compared to isolated, quiescent galaxies is currently ongoing (Pasquali et al. 2003; Pollack et al. 2007). A steady star formation rate of this kind (61 yr-1; Yun & Carilli 2002) over the past 200 Myr (the dynamical age of the soft X-ray halo), perhaps involving the peripherical regions, can easily account for the energy and metallicity content of the hot gas component. The tentative decrease with radius of the absolute abundances hints at the gentle mixing of the starburst-driven outflows with a pre-existing halo medium, as also suggested by the best-fitting spectral model E. If no dilution effect were present and the dispersion of metal-rich gas were highly efficient, the observed metallicity gradient would be positive, with supersolar abundances at the larger distances (Cox et al. 2006).
The fate of the starburst-processed gas is not clear. Some merger remnants, and young ellipticals bearing the signatures of recent interactions, are under-luminous in the X-rays with respect to relaxed early-type galaxies (Fabbiano & Schweizer 1995; Read & Ponman 1998), while different mechanisms of halo regeneration have been proposed (O’Sullivan et al. 2001b). If the wind temperature is much larger than the virial temperature, most of the hot gas is not bound and will eventually escape the system, becoming undetectable in the X-rays due to the density drop. In NGC 6240, the single-temperature cooling time of a few Gyr implies that the halo luminosity will not be fully extinguished after the merger conclusion. In the more complex scenarios, the different gas phases might have much shorter cooling times, depending on their degree of mixing. According to model E, unless the filling factors are very small (), the radiative cooling of the warmer gas component will take several hundreds of Myr at least. Provided that some favorable conditions are met (e.g., the ultimate AGN feedback is not dramatically powerful, the cooler gas component exerts a sufficient drag, and the gravitational potential well is deep enough), NGC 6240 could be a case of major merger with no complete blow-out.
| Reg | Mod | ||||
|---|---|---|---|---|---|
| FH | A | 4.44 | 5.07 | 3.83 | 4.13 |
| B | 4.58 | 5.25 | 3.90 | 3.95 | |
| C | 4.63 | 5.10 | 3.80 | 3.85 | |
| D | 2.44 | 2.13 | 3.73 | 3.28 | |
| S1 | F | 5.34 | 5.77 | 6.10 | 2.50 |
| G | 5.29 | 4.52 | 5.80 | 2.36 | |
| S2 | F | 2.19 | 3.54 | 2.07 | 4.83 |
| G | 3.68 | 4.46 | 2.06 | 4.53 | |
| S3 | F | 4.80 | 3.77 | 3.89 | 3.73 |
| G | 5.60 | 3.20 | 3.77 | 3.91 | |
| S4 | F | 3.87 | 4.05 | 3.60 | 1.92 |
| G | 5.33 | 3.59 | 3.20 | 1.60 | |
| S5 | F | 5.60 | 1.67 | 3.38 | 1.39 |
| G | 3.01 | 7.67 | 4.96 | 2.91 | |
| S6 | F | 7.89 | 9.59 | 3.07 | 10.6 |
| G | 5.67 | 7.44 | 3.20 | 7.67 |
6 Summary and Conclusions
We have presented an X-ray spectral and imaging analysis of the ultraluminous infrared galaxy merger NGC 6240, based on the combined 182-ks exposure from a pair of new (145 ks) and archival (37 ks) Chandra observations. NGC 6240 is a very complex system at all the physical scales, sporting a heavily-obscured, dual AGN in the central kpc, a circumnuclear environment swept by powerful starburst-driven winds, and a spectacular halo of hot gas, which definitely make of this source one of the most intriguing extragalactic targets. In this work, we have focused on the diffuse, soft X-ray emission at (7.5 kpc) from the visual centroid, coincident with the southern nucleus. Our main results can be summarized as follows:
-
1.
In the soft X-rays, the surface brightness of NGC 6240 exceeds the background at the 3 confidence level out to an average radius of 50 kpc. This huge halo shows a slightly elongated, diamond-like shape, with nearly perpendicular directions of maximum and minimum extension and a projected size at full length of 11080 kpc. The global morphology is clumpy and filamentary throughout this range.
-
2.
The X-ray emission from the full halo is consistent with a single-temperature gas heated at 0.65 keV (7.5 million K), with a typical density of a few 10-3 cm-3 and a total mass of 1.310. Given the estimated thermal energy content of 51058 erg, the intrinsic 0.4–2.5 keV luminosity of 41041 erg s-1 implies a cooling time larger than a Gyr, under the assumption of a filling factor .
-
3.
The spatially-resolved spectral analysis, feasible thanks to the adequate number of net counts available, reveals limited variations, with no apparent correlation of the gas physical parameters with the main morphological features. In the radial direction, the inferred properties clearly differ from those expected for an adiabatic outflow, being the temperature virtually constant and the density slowly decreasing.
-
4.
Absolute abundances are generally subsolar, with possible gradients among the azimuthal sectors, whose statistical significance is anyway marginal. In spite of the large error bars, a tentative metallicity drop with radius is found with a cumulative 2 confidence. Abundance ratios between the main -elements and iron are several times the solar value, calling for a metal enrichment dominated by type II SNe.
Based on the luminosity of its X-ray halo, NGC 6240 might even be the remnant of a small group of galaxies, on its way to becoming a massive elliptical. The gas heating can be ascribed to different mechanisms, including the dissipation of kinetic energy during the galactic collision, the fast shocks within a starburst-driven superwind, the virialization by a group-like gravitational potential. When examined individually, none of the latter interpretations accounts in a self-consistent manner for the observational evidence in its entirety. Although the application of a simple thermal model provides useful information on the basic properties of the halo, the actual physical conditions are likely much more complex. Indeed, the best-fitting spectral model consists of a multi-phase gas with different temperature and metallicity, and suggests the mixing of two primary gas components. In our favorite scenario, the warmer one ( keV) has been chemically-contaminated ( solar) by a regular, widespread star formation activity over the past 200 Myr, following the dynamical interaction of the parent galaxies; the cooler one ( keV) is related to the metal-poor ( solar), pre-existing ambient material, which has been heated up to X-ray emitting temperatures due to either the merger-induced dissipation and shocks or the binding energy of the dark matter halo. The present data quality does not allow us to probe this picture in more depth. Subject to such a high spatial resolution, a further improvement (by at least a factor of 5) in the amount of net counts available would be needed to clearly disentangle the gas components of different temperature, and to significantly constrain any abundance gradient within the halo. While the system is already relaxing, and the final coalescence of the two nuclei will ultimately lead to the formation of a young elliptical galaxy, it is still unclear how much of the hot, diffuse gas can be retained in the form of an X-ray bright, hydrostatic halo.
In conclusion, this work confirms NGC 6240 as one of the most striking sources in the local Universe, whose study delivers plenty of challenging information for both theoretical models and numerical simulations, with far-reaching implications in all the fields of galaxy formation and evolution.
Acknowledgments. This research is supported by NASA grant GO1-12123X (PI: G. Fabbiano). We thank the anonymous referee for a careful reading, and constructive comments that helped improving the clarity of this paper. We acknowledge support from the Chandra X-ray Center (CXC), which is operated by the Smithsonian Astrophysical Observatory (SAO) for and on behalf of NASA under contract NAS8-03060. We have made use of software provided by the CXC in the application packages ciao and Sherpa, and of SAOImage DS9, developed by SAO. The X-ray data were retrieved from the Chandra Data Archive, and the HST image was obtained from the MAST data archive at the Space Telescope Science Institute. STScI is operated by the Association of Universities for Research in Astronomy, Inc., under NASA contract NAS5-26555.
Appendix
We summarize below the spectral models employed in this work, and their
underlying assumptions in the application to the different halo regions. The
basic form involves thermal emission from hot gas in collisional ionization
equilibrium, modified by Galactic absorption only. We also probed the possible
presence of neutral column density local to the source, and the contribution
of an additional power-law or thermal component. Abundances of Fe, O, Ne,
Mg, and Si are allowed to be different fractions of solar values.
A – wabs*zwabs*(vapec+powerlaw) – Full halo spectrum, grouped to a
4 significance per energy channel and fitted with the statistic.
B – wabs*zwabs*(vapec+powerlaw) – Ungrouped (with at least
one count per bin) spectra of the full, inner and outer halo regions, fitted with
the -statistic.
C – wabs*vapec – Ungrouped spectra of the azimuthal regions S1–S6,
fitted simultaneously with both temperatures and abundances tied, and of the
radial regions H1–H5, fitted simultaneously in the spatially-resolved analysis
with temperatures free and abundances tied.
D – wabs*(vapec+vapec) – Grouped spectrum of the full halo, with
abundances tied between the two thermal components.
E – wabs*(vapec+vapec) – Grouped spectrum of the full halo, with abundance
set to 0.1 solar for all the elements in the low-temperature component.
F – wabs*vapec – Ungrouped spectra of the individual S1–S6 regions,
fitted independently in the spatially-resolved azimuthal analysis.
G – wabs*vapec – Ungrouped S1–S6 spectra, fitted simultaneously with
a single parameter of interest free to vary, in turn, over the different regions, and
tied otherwise.
References
- Anders & Grevesse (1989) Anders, E., & Grevesse, N. 1989, Geochim. Cosmochim. Acta, 53, 197
- Armus et al. (2006) Armus, L., Bernard-Salas, J., Spoon, H. W. W., et al. 2006, ApJ, 640, 204
- Baan et al. (2007) Baan, W. A., Hagiwara, Y., & Hofner, P. 2007, ApJ, 661, 173
- Baldi et al. (2006) Baldi, A., Raymond, J. C., Fabbiano, G., et al. 2006a, ApJS, 162, 113
- Baldi et al. (2006) Baldi, A., Raymond, J. C., Fabbiano, G., et al. 2006b, ApJ, 636, 158
- Barnes (1988) Barnes, J. E. 1988, ApJ, 331, 699
- Barnes & Hernquist (1992) Barnes, J. E., & Hernquist, L. 1992, ARA&A, 30, 705
- Bautista et al. (1996) Bautista, M. A., Peng, J., & Pradhan, A. K. 1996, ApJ, 460, 372
- Beswick et al. (2001) Beswick, R. J., Pedlar, A., Mundell, C. G., & Gallimore, J. F. 2001, MNRAS, 325, 151
- Boller et al. (2003) Boller, T., Keil, R., Hasinger, G., et al. 2003, A&A, 411, 63
- Borkowski et al. (2001) Borkowski, K. J., Lyerly, W. J., & Reynolds, S. P. 2001, ApJ, 548, 820
- Boroson et al. (2011) Boroson, B., Kim, D.-W., & Fabbiano, G. 2011, ApJ, 729, 12
- Braine et al. (2003) Braine, J., Davoust, E., Zhu, M., et al. 2003, A&A, 408, L13
- Brassington et al. (2007) Brassington, N. J., Ponman, T. J., & Read, A. M. 2007, MNRAS, 377, 1439
- Bush et al. (2008) Bush, S. J., Wang, Z., Karovska, M., & Fazio, G. G. 2008, ApJ, 688, 875
- Canizares et al. (1987) Canizares, C. R., Fabbiano, G., & Trinchieri, G. 1987, ApJ, 312, 503
- Cash (1979) Cash, W. 1979, ApJ, 228, 939
- Chevalier (1977) Chevalier, R. A. 1977, ARA&A, 15, 175
- Chevalier & Clegg (1985) Chevalier, R. A., & Clegg, A. W. 1985, Nature, 317, 44
- Ciotti & Pellegrini (2008) Ciotti, L., & Pellegrini, S. 2008, MNRAS, 387, 902
- Colina et al. (2004) Colina, L., Arribas, S., & Clements, D. 2004, ApJ, 602, 181
- Cox et al. (2006) Cox, T. J., Di Matteo, T., Hernquist, L., et al. 2006, ApJ, 643, 692
- Cox et al. (2008) Cox, T. J., Jonsson, P., Somerville, R. S., Primack, J. R., & Dekel, A. 2008, MNRAS, 384, 386
- Dasyra et al. (2006) Dasyra, K. M., Tacconi, L. J., Davies, R. I., et al. 2006, ApJ, 651, 835
- Davis (2001) Davis, J. E. 2001, ApJ, 548, 1010
- Downes et al. (1993) Downes, D., Solomon, P. M., & Radford, S. J. E. 1993, ApJ, 414, L13
- Dupke & White (2000) Dupke, R. A., & White, R. E., III 2000, ApJ, 528, 139
- Ebeling et al. (2006) Ebeling, H., White, D. A., & Rangarajan, F. V. N. 2006, MNRAS, 368, 65
- Egami et al. (2006) Egami, E., Neugebauer, G., Soifer, B. T., et al. 2006, AJ, 131, 1253
- Engel et al. (2010) Engel, H., Tacconi, L. J., Davies, R. I., et al. 2010a, ApJ, 724, 233
- Engel et al. (2010) Engel, H., Davies, R. I., Genzel, R., et al. 2010b, A&A, 524, A56
- Fabbiano (1988) Fabbiano, G. 1988, ApJ, 330, 672
- Fabbiano et al. (1992) Fabbiano, G., Kim, D.-W., & Trinchieri, G. 1992, ApJS, 80, 531
- Fabbiano & Schweizer (1995) Fabbiano, G., & Schweizer, F. 1995, ApJ, 447, 572
- Fabbiano et al. (2003) Fabbiano, G., Krauss, M., Zezas, A., Rots, A., & Neff, S. 2003, ApJ, 598, 272
- Fabbiano (2006) Fabbiano, G. 2006, ARA&A, 44, 323
- Feruglio et al. (2012) Feruglio, C., Fiore, F., Maiolino, R., et al. 2012, arXiv:1211.0841
- Fosbury & Wall (1979) Fosbury, R. A. E., & Wall, J. V. 1979, MNRAS, 189, 79
- Foster et al. (2012) Foster, A. R., Ji, L., Smith, R. K., & Brickhouse, N. S. 2012, ApJ, 756, 128
- Freeman et al. (2002) Freeman, P. E., Kashyap, V., Rosner, R., & Lamb, D. Q. 2002, ApJS, 138, 185
- Gallimore & Beswick (2004) Gallimore, J. F., & Beswick, R. 2004, AJ, 127, 239
- Genzel et al. (1998) Genzel, R., Lutz, D., Sturm, E., et al. 1998, ApJ, 498, 579
- Gerssen et al. (2004) Gerssen, J., van der Marel, R. P., Axon, D., et al. 2004, AJ, 127, 75
- Griffiths et al. (2000) Griffiths, R. E., Ptak, A., Feigelson, E. D., et al. 2000, Science, 290, 1325
- Grimes et al. (2005) Grimes, J. P., Heckman, T., Strickland, D., & Ptak, A. 2005, ApJ, 628, 187
- Heckman et al. (1987) Heckman, T. M., Armus, L., & Miley, G. K. 1987, AJ, 93, 276
- Heckman et al. (1990) Heckman, T. M., Armus, L., & Miley, G. K. 1990, ApJS, 74, 833
- Heckman et al. (1999) Heckman, T. M., Armus, L., Weaver, K. A., & Wang, J. 1999, ApJ, 517, 130
- Heckman et al. (2000) Heckman, T. M., Lehnert, M. D., Strickland, D. K., & Armus, L. 2000, ApJS, 129, 493
- Hollenbach & McKee (1979) Hollenbach, D., & McKee, C. F. 1979, ApJS, 41, 555
- Hopkins et al. (2008) Hopkins, P. F., Hernquist, L., Cox, T. J., & Kereš, D. 2008, ApJS, 175, 356
- Humphrey et al. (2006) Humphrey, P. J., Buote, D. A., Gastaldello, F., et al. 2006, ApJ, 646, 899
- Huo et al. (2004) Huo, Z. Y., Xia, X. Y., Xue, S. J., Mao, S., & Deng, Z. G. 2004, ApJ, 611, 208
- Iono et al. (2007) Iono, D., Wilson, C. D., Takakuwa, S., et al. 2007, ApJ, 659, 283
- Iwasawa & Comastri (1998) Iwasawa, K., & Comastri, A. 1998, MNRAS, 297, 1219
- Joseph et al. (1984) Joseph, R. D., Wade, R., & Wright, G. S. 1984, Nature, 311, 132
- Kalberla et al. (2005) Kalberla, P. M. W., Burton, W. B., Hartmann, D., et al. 2005, A&A, 440, 775
- Kim (2012) Kim, D.-W. 2012, Astrophysics and Space Science Library, 378, 121
- Kim et al. (2012) Kim, D.-W., Fabbiano, G., & Pipino, A. 2012, ApJ, 751, 38
- King (2005) King, A. 2005, ApJ, 635, L121
- Komatsu et al. (2011) Komatsu, E., Smith, K. M., Dunkley, J., et al. 2011, ApJS, 192, 18
- Komossa et al. (1998) Komossa, S., Schulz, H., & Greiner, J. 1998, A&A, 334, 110
- Komossa et al. (2003) Komossa, S., Burwitz, V., Hasinger, G., et al. 2003, ApJ, 582, L15
- Leitherer et al. (1999) Leitherer, C., Schaerer, D., Goldader, J. D., et al. 1999, ApJS, 123, 3
- Lira et al. (2002) Lira, P., Ward, M. J., Zezas, A., & Murray, S. S. 2002, MNRAS, 333, 709
- Lonsdale et al. (2006) Lonsdale, C. J., Farrah, D., & Smith, H. E. 2006, Astrophysics Update 2, 285
- Lutz et al. (2003) Lutz, D., Sturm, E., Genzel, R., et al. 2003, A&A, 409, 867
- Masai (1994) Masai, K. 1994, ApJ, 437, 770
- Mathews & Brighenti (2003) Mathews, W. G., & Brighenti, F. 2003, ARA&A, 41, 191
- Max et al. (2007) Max, C. E., Canalizo, G., & de Vries, W. H. 2007, Science, 316, 1877
- McMillan (2011) McMillan, P. J. 2011, MNRAS, 414, 2446
- Mo & White (2002) Mo, H. J., & White, S. D. M. 2002, MNRAS, 336, 112
- Mulchaey (2000) Mulchaey, J. S. 2000, ARA&A, 38, 289
- Nagataki & Sato (1998) Nagataki, S., & Sato, K. 1998, ApJ, 504, 629
- Nardini et al. (2009) Nardini, E., Risaliti, G., Salvati, M., et al. 2009, MNRAS, 399, 1373
- Navarro et al. (1997) Navarro, J. F., Frenk, C. S., & White, S. D. M. 1997, ApJ, 490, 493
- Netzer et al. (2005) Netzer, H., Lemze, D., Kaspi, S., et al. 2005, ApJ, 629, 739
- Nomoto et al. (1997) Nomoto, K., Iwamoto, K., Nakasato, N., et al. 1997, Nuclear Physics A, 621, 467
- Nomoto et al. (2006) Nomoto, K., Tominaga, N., Umeda, H., Kobayashi, C., & Maeda, K. 2006, Nuclear Physics A, 777, 424
- O’Sullivan et al. (2001) O’Sullivan, E., Forbes, D. A., & Ponman, T. J. 2001a, MNRAS, 328, 461
- O’Sullivan et al. (2001) O’Sullivan, E., Forbes, D. A., & Ponman, T. J. 2001b, MNRAS, 324, 420
- Ohyama et al. (2003) Ohyama, Y., Yoshida, M., & Takata, T. 2003, AJ, 126, 2291
- Pasquali et al. (2004) Pasquali, A., Gallagher, J. S., & de Grijs, R. 2004, A&A, 415, 103
- Pellegrini (2011) Pellegrini, S. 2011, ApJ, 738, 57
- Pollack et al. (2007) Pollack, L. K., Max, C. E., & Schneider, G. 2007, ApJ, 660, 288
- Read & Ponman (1998) Read, A. M., & Ponman, T. J. 1998, MNRAS, 297, 143
- Richings et al. (2010) Richings, A. J., Fabbiano, G., Wang, J., & Roberts, T. P. 2010, ApJ, 723, 1375
- Risaliti et al. (2006) Risaliti, G., Sani, E., Maiolino, R., et al. 2006, ApJ, 637, L17
- Rupke et al. (2005) Rupke, D. S., Veilleux, S., & Sanders, D. B. 2005, ApJS, 160, 115
- Sanders & Mirabel (1996) Sanders, D. B., & Mirabel, I. F. 1996, ARA&A, 34, 749
- Schulz et al. (1993) Schulz, H., Fried, J. W., Röser, S., & Keel, W. C. 1993, A&A, 277, 416
- Shu et al. (2011) Shu, X. W., Yaqoob, T., & Wang, J. X. 2011, ApJ, 738, 147
- Schweizer (1986) Schweizer, F. 1986, Science, 231, 227
- Smith et al. (2001) Smith, R. K., Brickhouse, N. S., Liedahl, D. A., & Raymond, J. C. 2001, ApJ, 556, L91
- Smith & Hughes (2010) Smith, R. K., & Hughes, J. P. 2010, ApJ, 718, 583
- Springel et al. (2005) Springel, V., Di Matteo, T., & Hernquist, L. 2005, MNRAS, 361, 776
- Strickland & Heckman (2009) Strickland, D. K., & Heckman, T. M. 2009, ApJ, 697, 2030
- Strickland & Stevens (2000) Strickland, D. K., & Stevens, I. R. 2000, MNRAS, 314, 511
- Suchkov et al. (1996) Suchkov, A. A., Berman, V. G., Heckman, T. M., & Balsara, D. S. 1996, ApJ, 463, 528
- Tacconi et al. (1999) Tacconi, L. J., Genzel, R., Tecza, M., et al. 1999, ApJ, 524, 732
- Tecza et al. (2000) Tecza, M., Genzel, R., Tacconi, L. J., et al. 2000, ApJ, 537, 178
- Toomre & Toomre (1972) Toomre, A., & Toomre, J. 1972, ApJ, 178, 623
- van der Werf et al. (1993) van der Werf, P. P., Genzel, R., Krabbe, A., et al. 1993, ApJ, 405, 522
- Veilleux et al. (2005) Veilleux, S., Cecil, G., & Bland-Hawthorn, J. 2005, ARA&A, 43, 769
- Vignati et al. (1999) Vignati, P., Molendi, S., Matt, G., et al. 1999, A&A, 349, L57
- Voit (2005) Voit, G. M. 2005, Advances in Space Research, 36, 701
- Wang et al. (1997) Wang, J., Heckman, T. M., Weaver, K. A., & Armus, L. 1997, ApJ, 474, 659
- Wang et al. (2009) Wang, J., Fabbiano, G., Elvis, M., et al. 2009, ApJ, 694, 718
- Yun & Carilli (2002) Yun, M. S., & Carilli, C. L. 2002, ApJ, 568, 88
- Zacharias et al. (2004) Zacharias, N., Monet, D. G., Levine, S. E., et al. 2004, Bulletin of the American Astronomical Society, 36, 1418
- Zezas & Fabbiano (2002) Zezas, A., & Fabbiano, G. 2002, ApJ, 577, 726