Constraints on the annihilation cross section of dark matter particles from anisotropies in the diffuse gamma-ray background measured with Fermi-LAT
Abstract
Annihilation of dark matter particles in cosmological halos (including a halo of the Milky Way) contributes to the diffuse gamma-ray background (DGRB). As this contribution will appear anisotropic in the sky, one can use the angular power spectrum of anisotropies in DGRB to constrain properties of dark matter particles. By comparing the updated analytic model of the angular power spectrum of DGRB from dark matter annihilation with the power spectrum recently measured from the 22-month data of Fermi Large Area Telescope (LAT), we place upper limits on the annihilation cross section of dark matter particles as a function of dark matter masses. We find that the current data exclude for annihilation into at the dark matter mass of 10 GeV, which is a factor of three times larger than the canonical cross section. The limits are weaker for larger dark matter masses. The limits can be improved further with more Fermi-LAT data as well as by using the power spectrum at lower multipoles (), which are currently not used due to a potential Galactic foreground contamination.
pacs:
95.35.+d, 95.85.Pw, 98.70.VcI Introduction
Understanding the identity and nature of dark matter, which makes up more than 80% of the total matter density in the Universe, is a major goal of modern physics and cosmology. The most promising candidate for dark matter is the weakly interacting massive particles (WIMPs), with which one can naturally explain the observed dark matter density using a simple thermal freeze-out argument Jungman:1996 . If dark matter particles annihilate into standard model particles, as expected for most WIMP scenarios, one can indirectly detect and constrain properties of dark matter particles Jungman:1996 ; Bergstrom:2000 ; Bertone:2005 . In this paper, we shall focus on high-energy (1–50 GeV) gamma-ray photons produced by the cascade of annihilation products.
Dark matter annihilation occurs in all cosmological halos including a halo of the Milky Way, and thus contributes to the diffuse gamma-ray background (DGRB) Ullio:2002 ; Taylor:2003 ; Ando:2005 ; Oda:2005 ; Pieri:2008 . Due to the large-scale structure of the Universe, the observed gamma-ray emission appears anisotropic in the sky in a predictable manner, which makes it easy to identify the dark matter origin of high-energy gamma rays in the sky Ando:2006 (also see Refs. Ando:2007a ; Ando:2007b ; Miniati:2007 ; Cuoco:2007 ; Cuoco:2008 ; SiegalGaskins:2008 ; Lee:2009 ; Taoso:2009 ; Fornasa:2009 ; SiegalGaskins:2009 ; Ando:2009a ; Ando:2009b ; Zavala:2010 ; Ibarra:2010 ; SiegalGaskins:2011 ; Cuoco:2011 ; Fornasa:2012 ).
Recently, the Fermi-LAT collaboration has measured the power spectrum of DGRB anisotropy from the 22-month of data FermiAnisotropy . They have detected significant excesses of the angular power spectrum over the shot noise of photons for a multipole range between and 504 and for multiple energy bins. A further study shows that most of these excesses come from unresolved blazars Cuoco:2012 . Subtracting the estimate of the blazar contribution, we have upper bounds on the residual anisotropy of DGRB.
In this paper, we use the upper bounds on the power spectrum to constrain the annihilation cross section of dark matter particles. For this purpose, we update our theoretical framework for computing the angular power spectrum presented in Refs. Ando:2006 ; Ando:2007a ; Ando:2009a as follows:
-
1.
We use the results from recent numerical simulations (e.g., Ref. Gao:2012 ) to model the mass function and spatial distribution of subhalos within a given host halo.
-
2.
We include contributions from both the extragalactic dark matter halos and the Galactic dark matter subhalos.
-
3.
We also include the cross correlation between dark matter annihilation signals and blazars. Although this term was often ignored in the literature (except for Ref. Ando:2007a ), one should include this term for self-consistency: the same halo hosting a blazar also contains annihilating dark matter particles, and there is a spatial correlation between halos hosting blazars and those not hosting blazars but containing annihilating dark matter particles.
This paper is organized as follows. In Sec. II, we present the predicted angular power spectrum of DGRB from extragalactic dark matter halos, and compare this to the data to find constraints on the annihilation cross section. In Sec. III, we discuss the contribution from the cross-correlation term with blazars. In Sec. IV, we present the predicted angular power spectrum of DGRB from Galactic subhalos, and find combined constraints on the annihilation cross section using extragalactic and Galactic contributions. We conclude in Section V. Throughout the paper, we adopt a flat cold dark matter model with a cosmological constant (CDM) with the following cosmological parameters: , , with , , and .
II Extragalactic contribution
In this section, we discuss the mean intensity and anisotropy of DGRB from dark matter annihilation in extragalactic halos. Much of the calculations are based on our earlier work Ando:2006 ; Ando:2007a , but with extensions of the framework and significant updates on input models as explained below.
II.1 Mean intensity
The mean intensity of gamma rays from dark matter annihilation is given by111Here we define the mean intensity, , as the number of photons received per unit area, unit time, unit energy range, and unit solid angle, i.e., .
| (1) |
where is the energy of photons, is the comoving distance to a source at redshift [ and are used interchangeably through the relation, ], is the variance of the overdensity field, , and is often also referred to as an “intensity multiplier.” is the window function that contains particle-physics information such as a velocity-averaged annihilation cross section times relative velocity, , a dark matter mass, , and a gamma-ray spectrum per annihilation, :
| (2) |
where is the density parameter of dark matter, and is the critical density of the present Universe. Here, is the optical depth for a gamma ray emitted at energy , for which we adopt the model of Ref. Gilmore:2011 . Note that the annihilation cross section required to produce dark matter at the right relic density by the thermal freeze-out mechanism with S-wave annihilation is , which is largely independent of the dark matter mass Jungman:1996 .
The intensity multiplier is
| (3) | |||||
where is the virial mass, is the halo mass function, for which we adopt an ellipsoidal collapse model Sheth:1999 ; Sheth:2001 , is the density profile of a host halo of mass , is the comoving radius from the halo center, and is a boost factor due to annihilation in subhalos.
We adopt an Navarro-Frenk-White (NFW) NFW profile for host halos,
| (4) |
where and are the scale density and the scale radius, respectively, and this relation holds out to the virial radius, , which, in turn, is given as a function of and through the relation: , with and Bryan:1998 .
The scale radius is defined as , where is the concentration parameter, for which we adopt the model of Ref. Bullock:2001 for masses below and that of Ref. Duffy:2008 otherwise. By taking the volume integral of the density profile, , out to and equating it to , we obtain the scale density as
| (5) |
The volume integral of the density squared has an analytic form:
| (6) |
The gamma-ray intensity is further boosted by annihilation in subhalos, which is represented by the boost factor, , for which we adopt a fitting formula based on results of recent numerical simulations Gao:2012 : , where is an enclosed mass within a radius in which the average density is 200 times the critical density; there is a simple relation between and the virial mass Hu:2003 . This boost is realized if the subhalo mass function extends down to Earth-mass scales, , which is a typical cutoff scale for the neutralino dark matter Green:2004 ; Green:2005 ; Diemand:2005 ; Diemand:2006 . We note, however, that the boost factor strongly depends on the minimum subhalo mass chosen, Gao:2012 . Given that a wide range of minimum subhalo mass is still allowed, as small as 10 Profumo:2006 , the annihilation rate may be boosted even further.
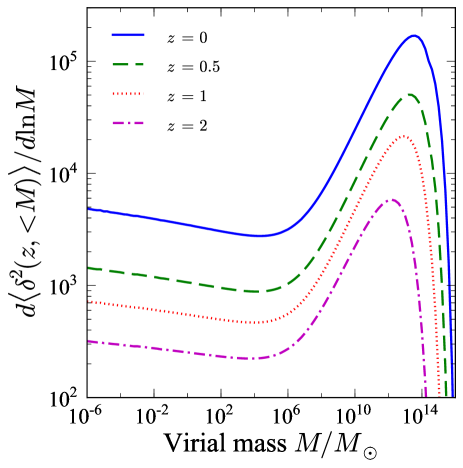
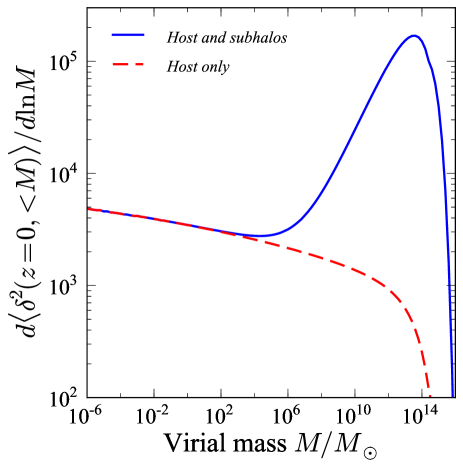
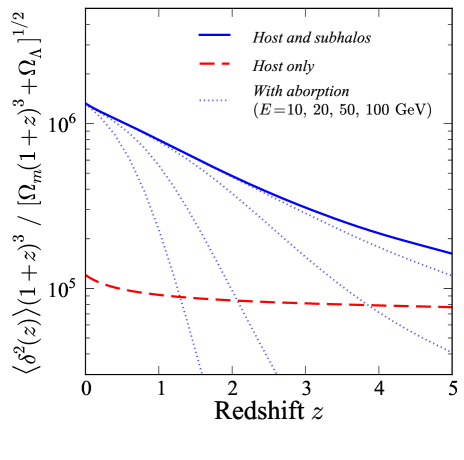

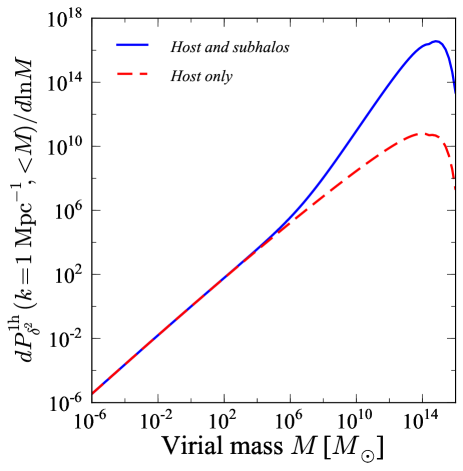
Figure 1 shows the integrand of Eq. (3) as a function of the virial mass, , for various redshifts, . Namely, this shows what fraction of is contributed from which mass ranges. As can be seen from this figure, the dominant contribution comes from cluster-size halos () at and galaxy-size halos () at . This is mainly because of the boost due to annihilation in subhalos. In Fig. 2, we compare the contribution from the host halos (dashed line) and that from the host halos and subhalos (solid line) at . If there are no gamma ray from subhalos, then the mean intensity would be dominated by the smallest dark matter halos.
Figure 3 shows the intensity multiplier as a function of redshifts for the case with and without subhalo contributions. Here we multiply by to show contributions to the mean intensity from different redshift ranges. One can see that the presence of subhalos boosts the intensity by a factor of 10 at low redshifts, and by a factor of even at . The dotted lines are further multiplied by the absorption factor, , for observed energies of , 20, 50, and 100 GeV. There is little absorption for photons received below 10 GeV, but this effect is significant for energies above tens of GeV and should be taken into account.
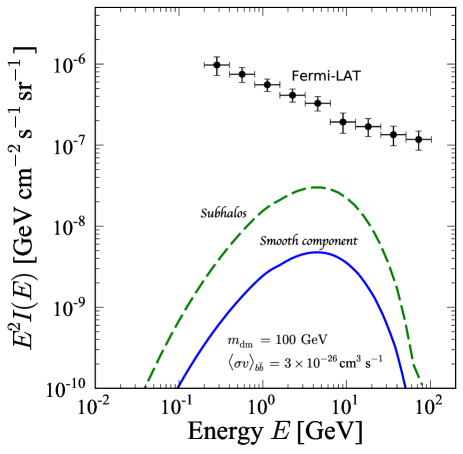
Figure 4 shows the predicted mean intensity of DGRB from dark matter annihilation with , , and the annihilation channel. This model gives the dark matter contribution that is as large as 10% of the mean intensity measured by Fermi-LAT FermiDiffuse at GeV. This contribution is quite significant given that even the most dominant contributors known to date, i.e., unresolved blazars, contribute to DGRB at around the same level FermiDiffuseSource .
II.2 Angular power spectrum
The angular power spectrum at a given multipole, , is given by
| (7) |
Following conventions of recent publications (e.g., Ref. FermiAnisotropy ), our definition of the angular power spectrum [Eq. (7)] has the units of ,222When we compare theoretical predictions with the data, we must integrate a gamma-ray intensity in a given direction over energy within a given energy bin. We do this by replacing the window function, , in Eqs. (1) and (7) with the window function integrated over a given energy range. This gives in units of . which is referred to as the intensity angular power spectrum. In order to obtain the fluctuation angular power spectrum that has units of sr and is adopted in the earlier papers (e.g., Ref. Ando:2006 ), one simply divides the intensity power spectrum by the mean-intensity squared, .
Here, is the power spectrum of the overdensity squared, , which can be divided into one- and two-halo terms Ando:2006 :
| (8) |
The one-halo term correlates two points in one identical halo, whereas the two-halo term does that in two distinct halos. Correspondingly, the angular power spectrum is also divided into two terms:
| (9) |
These two terms of the power spectrum can be explicitly written as
| (10) | |||||
where is the linear power spectrum of the matter density field , and is the linear halo bias Sheth:2001 . The power spectrum of , , depends on profiles of density squared in a halo of mass , , where is normalized such that its volume integration becomes unity; is the Fourier transform of .

Fourier transform of the density-squared profile, , is the sum of the density-squared profiles of the host halo and subhalos weighed by a fractional luminosity of each component:
| (12) |
Here, we ignore a contribution from the cross term, , which is important only when at the same radius, . Given that spatial distributions of the host halo and subhalo contributions are quite different (the host halo being important inside the scale radius and the subhalos being important outside), this approximation is very good. (See Appendix for the contribution of the cross term.)
Fourier transform of the host halo profile, , has an analytic form Ando:2006 , but here we use an even simpler fitting formula,
| (13) |
with and , which is largely independent of Ando:2009a . On the other hand, we obtain the density-squared profile of subhalos, , by deprojecting the surface brightness profiles of numerical simulations Gao:2012 ; Han:2012 , assuming spherical symmetry as follows:
| (14) |
with . Note that the distribution of subhalos is typically more extended than the density profile of the host halo. Its Fourier transform is
| (15) | |||||
where and is the normalization constant such that .
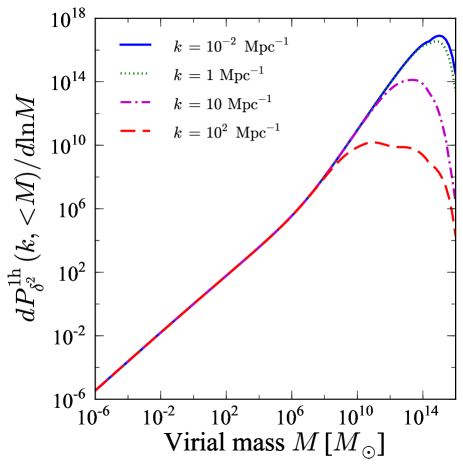
Figure 5 shows for various host-halo masses, . When is close to unity (for small ), the halo can be regarded as a point source. On the other hand, when deviates significantly from unity at a given wave number , the source extension cannot be ignored at that wave number, and the power spectrum (especially the one-halo term) is suppressed. Figure 5 shows that is larger for smaller host halos, which are less extended. It also shows that the contributions from subhalos are more important for larger host halos. As the distribution of subhalos is more extended than the density profile of the host halo, the subhalo contribution dominates at small and the host-halo dominates at large . This makes a hump at scales corresponding to the scale radius, . In other words, annihilation from the smooth host-halo component dominates inside the scale radius, where subhalos are tidally disrupted.
Figure 6 shows the integrand of the one-halo power spectrum of , [Eq. (10)], at for various wave numbers, . (Note that the lines are normalized at , and thus it shows relative contributions rather than absolute.) The bulk of the contributions come from large-mass halos, and halos smaller than a typical dwarf size () do not make any sizable contributions to any relevant ranges of . This is particularly true for scales larger than a typical cluster size (i.e., ). For smaller scales, on the other hand, a relative importance of large-mass halos is smaller, as large-mass halos are more extended and thus the power from them is suppressed (as also shown in Fig. 5).
Figure 7 is the same as Fig. 6 for , but the host-halo contribution is also shown. We find that the impact of subhalos on the power spectrum is much greater than that on the mean intensity (as shown in Fig. 2), and it can boost the power spectrum by almost four orders of magnitude at this particular wave number.

After projected on the sky, the three-dimensional wave number, , and the angular multipole, , are related by for a given redshift, [see Eq. (7)]. Note, however, that this simple relation is valid only for small angular scales, (e.g., Ando:2006 ; Ando:2007a ), on which we mainly focus in this paper.
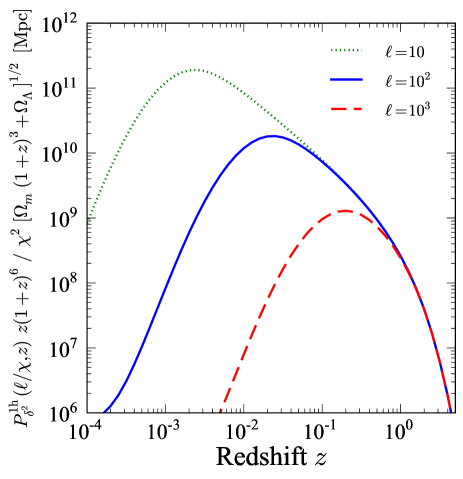
Figures 8 and 9 show the contributions to the angular power spectra at , 100, and 1000 from one-halo and two-halo terms, respectively, as a function of redshifts. To calculate a contribution to from a given , we multiply by some combination of functions of redshift [see the integrand of Eq. (7) and also the redshift dependence in Eq. (2)]. We find that lower multipoles are dominated by nearby sources: one-halo terms at , 100, and 1000 are dominated by sources at , , and , respectively, whereas the dominant contributions to the two-halo term come from somewhat higher redshifts.
One should not, however, include contributions from arbitrarily small redshifts in the integral of Eq. (7), as cosmic variance in such small redshifts is so large that taking the ensemble average (as we do here) no longer makes sense. In addition, when a source is sufficiently close, it should give enough gamma-ray fluxes to be identified as an individual source which we can remove from the map. In the following discussion, we use three different minimum redshifts in the integration of Eq. (7): , 0.003, and 0.01. The r.m.s. overdensity within radii corresponding to these three redshifts are 1.4, 0.74, and 0.28, respectively. Since none of these are much larger than one, we can argue that our results by setting these lower cutoffs are not subject to strong cosmic variance. We also note that, as we show below, this choice does not make any significant difference for the multipoles we consider () in this paper.
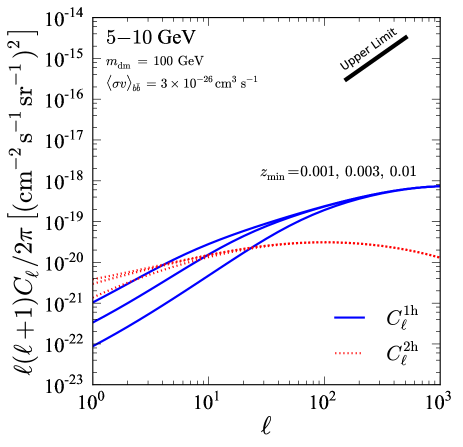
In Fig. 10, we show both the one-halo and two-halo terms of the angular power spectrum, , integrated over 5–10 GeV energy range, for three different values of , 0.003, and 0.01. The particle physics parameters are and , and we assume the annihilation channel. Note that scales as . Taking smaller increases the power at large angular scales, in particular for the one-halo term, because of the contributions from closer, more extended halos. For the rest of this paper, we shall use for definiteness.
The thick solid line in Fig. 10 shows the upper limits on the angular power spectrum FermiAnisotropy (with the blazar contribution subtracted Cuoco:2012 ) between and 504 for 5–10.4 GeV, . The current upper limits in 5–10.4 GeV, whose energy region is most sensitive to dark matter particles with GeV annihilating into (see Fig. 4), are three orders of magnitude larger than the prediction with the canonical particle physics parameters. Recalling , we find an upper limit on the cross section of for the 100-GeV dark matter annihilating into .
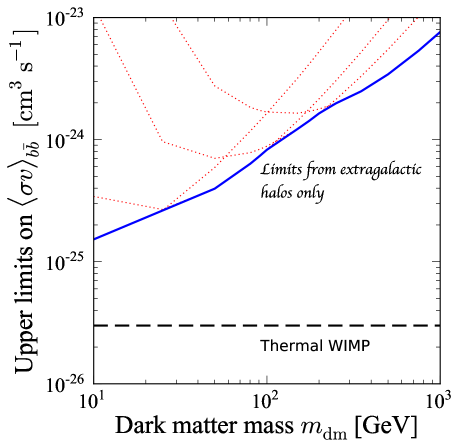
The blazar-subtracted upper limits on the angular power spectrum are available in several energy bands, 1.04–1.99 GeV, 1.99–5 GeV, 5–10.4 GeV, and 10.4–50 GeV Cuoco:2012 . In Fig. 11, we show the combined upper limits on the annihilation cross section for the channel, , as a function of the dark matter masses, , using all the available data on the power spectrum. (Note that the model is still based only on the extragalactic contribution.) We calculate the upper limit on the cross section such that the predicted at (the lowest multipole at which the measurement is reported) is equal to the upper limit reported by Ref. Cuoco:2012 . The limits from each energy range are shown separately as the dotted lines. The combined limits shown as the solid line are simply the best of the four limits at a given dark matter mass. A more optimal analysis would improve these limits.
III Cross correlation between dark matter and blazars
As astrophysical gamma-ray sources, such as blazars associated with supermassive black holes at the center of galaxies, reside in dark matter halos, there is a spatial correlation between gamma rays from dark matter annihilation and blazars. The angular power spectrum of dark matter annihilation including the cross correlation, which is equal to the total power spectrum minus the blazar power spectrum, is given by
| (16) |
where is the cross-power spectrum computed from333We include blazars in the cross-correlation, ignoring other sources of gamma rays. This may be justified, as blazars are so far known to be the most dominant extragalactic gamma-ray sources in the GeV energy regime. Other promising sources include star-forming galaxies Ando:2009b ; Fields:2010 ; Makiya:2011 ; Lacki:2012 .
| (17) | |||||
where the subscripts “” and “dm” denote blazars and dark matter, respectively. Here, is the same as Eq. (2), while is the window function for the mean intensity of blazars [similarly defined as Eq. (1) but replacing with 1]:
| (18) |
where is the differential luminosity (i.e., luminosity per unit energy) at a given energy , is the differential flux, and is the gamma-ray luminosity function of blazars. The upper limit of the integral, , is the luminosity giving the flux corresponding to the point-source sensitivity of Fermi-LAT at a given redshift , for which we adopt above 100 MeV. More formal definitions of these quantities can be found in Ref. Ando:2007a .
The three-dimensional cross power spectrum is
| (19) | |||||
where is the blazar bias averaged over the luminosity function and the flux as follows:
| (20) |
with the luminosity-dependent bias, , and the same upper and lower limits of integration as those in Eq. (18).
Note that this power spectrum [Eq. (19)] includes the two-halo term only. While the one-halo term, where dark matter annihilation happens in the same halo that hosts a blazar, also exists, the previous study Ando:2007a shows that the one-halo term of the cross correlation is much smaller than the two-halo term; thus, we shall ignore the one-halo term of the cross-power spectrum.
For the luminosity function, , we adopt the luminosity-dependent density-evolution (LDDE) model Narumoto:2006 ; Ando:2007b with the gamma-ray spectra assumed to be a power law with an index of , which is in agreement with the spectrum of resolved blazars as well as that of the DGRB.444More elaborated spectra in combination with the luminosity function and the DGRB intensity are studied in Refs Inoue:2009 ; Abazajian:2011 . Compared with the earlier study Ando:2007b where the luminosity function was based on pre-Fermi data, we here adopt different values for parameters of the luminosity function (, , and ) such that the model reproduces the flux distribution of blazars resolved by Fermi FermiDiffuseSource .
In Fig. 4, we show the blazar contribution to the mean intensity. It is difficult to explain the DGRB intensity measured by Fermi with blazars alone, in agreement with the previous study FermiDiffuseSource ; Ajello:2012 .
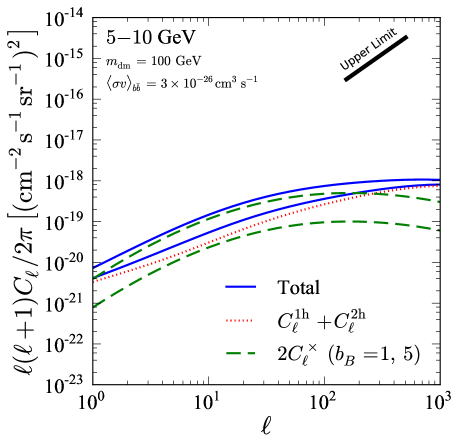
Figure 12 shows the angular power spectra from the cross correlation with and 5, for the energy range between 5 GeV and 10 GeV. The particle-physics parameters are the same as those in Fig. 10. We find that, if the annihilation cross section is around the canonical value required to produce dark matter particles at the right abundance by the thermal-freezeout mechanism, then the cross-correlation term cannot be ignored. This is particularly important when the bias of blazars is as high as 5.
As the dark matter term () and the cross-correlation term () scale with differently, one may ask, “At which value of the annihilation cross section does the cross-correlation term become important?” Figure 13 shows divided by the upper limit, , for 5–10 GeV. The dashed line is without the cross correlation, while the solid lines are with the cross correlation with bias of 1 and 5. We find that the dark matter term dominates at , whereas the cross-correlation term dominates at lower cross sections.
IV Galactic Contribution
Annihilation signals from subhalos in the Galactic halo containing the Milky Way are typically comparable to, or even greater than, the extragalactic contribution Oda:2005 ; Pieri:2008 ; SiegalGaskins:2008 ; Fornasa:2009 ; Ando:2009a ; thus, we must also take the Galactic subhalo contribution into account. We shall follow an analytic treatment presented in Ref. Ando:2009a .
On the other hand, we do not include the contribution from a smooth density profile of the host halo of the Milky Way in our calculation. In the anisotropy analysis of the Fermi-LAT data FermiAnisotropy , the low Galactic latitude region of deg is masked. Using a density profile of the smooth Galactic component of Ref. Ando:2009a , we find that this mask brings the smooth contribution to the mean intensity down to about 10% of the subhalo contribution, as shown in Fig. 14. As the smooth component does not have much power on small angular scales, it can be safely ignored for (but it can be comparable to the subhalo and extragalactic contributions on large angular scales, ).
The angle-averaged mean intensity from dark matter annihilation in Galactic subhalos can be computed from
| (21) |
where is the gamma-ray luminosity of a subhalo, is the line-of-sight coordinates, and is the angle-averaged luminosity function of subhalos. The lower limit of the line-of-sight integral, , corresponds to the flux sensitivity of Fermi-LAT, i.e., .
The subhalo luminosity, , is related to the subhalo mass, , via
| (22) |
where is the virial radius of the Galactic halo, the subscripts “sh” denote subhalos, and is a boost factor due to the presence of substructure in subhalos (sub-subhalos).
We assume that the density profile of subhalos, , is well described by the NFW function [Eq. (4)]. Then, the volume integral of the density-squared has the analytic form given by Eq. (6) with the concentration parameter, , replaced with that corresponds to the cutoff radius of subhalos, i.e., . With this mass-luminosity relation [Eq. (22)] and the subhalo mass function , one can compute the luminosity function. Most model inputs such as the subhalo mass function, spatial distribution, and mass-concentration relation are adopted from recent numerical simulations of the Galactic halo, Aquarius Springel:2008 . More details on how to apply these models to gamma-ray computations are described in Ref. Ando:2009a .
The intensity angular power spectrum is
| (23) |
where is the Fourier transform of the density-squared profile of the subhalo distribution, which is given by Eq. (13) if the density distribution of subhalos follows an NFW profile. Note that Eq. (23) only includes “one-subhalo” term, where one correlates two points in one identical subhalo. There is, however, the two-subhalo term that correlates two points in two distinct subhalos, but this term is much smaller than the one-subhalo term at small angular scales Ando:2009a .
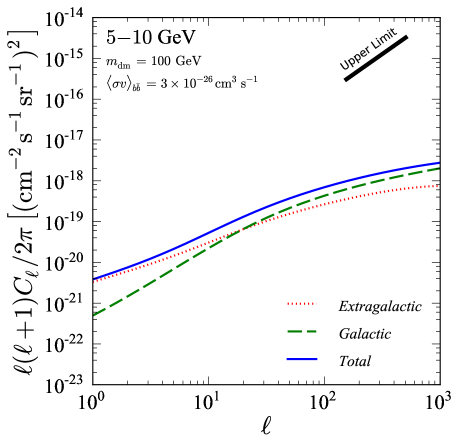
Figure 15 shows the predicted angular power spectra from Galactic subhalos and extragalactic halos (but not including the cross correlation). We have used the canonical model of the Galactic subhalos given in Ref. Springel:2008 , which has the mass resolution of about . We have extrapolated their result down to the Earth-mass scale (model A1 of Ref. Ando:2009a ). The intensity power spectrum is about the same for both the extragalactic and Galactic components, with the latter slightly larger in the angular scales constrained by Fermi-LAT.
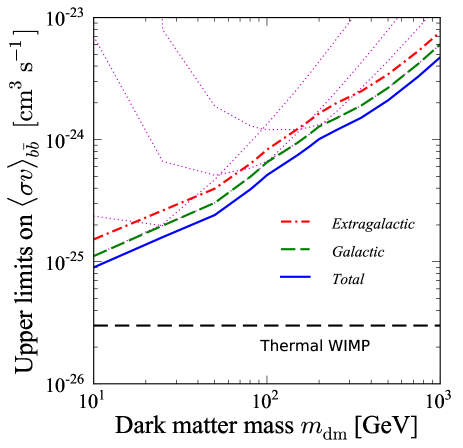
In Fig. 16, we show the limits on from the Fermi-LAT data, taking into account both the extragalactic and Galactic terms. As expected, the limits from either alone are similar, and the combined limits improve by a factor of two. In particular, for low-mass dark matter particles, the combined limits are only a factor of three larger than the canonical cross section. The limits are weaker for larger masses.
While our limits are not yet as stringent as those obtained from analyses of dwarf galaxies FermiDwarf ; GeringerSameth:2011 or galaxy clusters Ando:2012 ; Han:2012 , where the canonical cross section is already excluded for low-mass (10 GeV) dark matter particles, they are not so far away (i.e., only a factor of three to four worse). Also, our limits are derived in a completely different way: they are based on the diffuse emission rather than on individual objects, and they are based on anisotropy rather than on the mean intensity. It is certainly encouraging that the first limits using the DGRB anisotropy are already not so far away from the best limits.
V Conclusions
In this paper, we have used the angular power spectrum of DGRB recently detected in the 22-month data of Fermi-LAT FermiAnisotropy to place limits on the annihilation cross section of dark matter particles as a function of dark matter masses. As dark matter annihilation occurs in all cosmological halos and subhalos, our model includes all the contributing terms in the extragalactic halos, the Galactic subhalos, and the cross correlation between dark matter annihilation and blazars. The smooth Galactic component is predicted to be sub-dominant in the high Galactic region ( deg) and is ignored.
We have revised our earlier model of the extragalactic contribution by including the results from recent numerical simulations of the subhalo distribution Gao:2012 . Combined with the model of the Galactic subhalos of Ref. Ando:2009a , we find that the Galactic and extragalactic contributions are comparable to each other. The cross correlation with blazars is important for annihilation cross sections smaller than the canonical value ().
By comparing our model with the upper limit on the non-blazar contribution to the angular power spectrum of DGRB Cuoco:2012 , we find upper limits on the annihilation cross section as a function of dark matter masses as shown in Fig. 16. The current limit from anisotropy excludes regions of at the dark matter mass of 10 GeV, which is only a factor of three larger than the canonical value. The limits are weaker for larger dark matter masses. The first limits from DGRB anisotropy that we find in this paper are already competitive with the best limits in the literature.
Our limits will improve as Fermi collects more data. At the same time, an improvement in the analysis can significantly improve our limits. Currently, the angular power spectrum on large angular scales, , is not used because of a potential contamination by the Galactic foreground emission (such as pion decay). As the angular power spectrum of DGRB from dark matter annihilation, (without multiplying by ), rises towards low multipoles, including the low-multipole data will significantly improve the limits. This line of investigation (i.e., a better characterization and removal of the Galactic foreground) should be pursued.
Acknowledgements.
The work of S.A. was supported by GRAPPA Institute at University of Amsterdam and by NWO through Vidi Grant.Appendix A Effect of host-subhalo cross-term
The dark matter annihilation signal is proportional to the density squared. When both host halo and subhalo contributions are present, one has the host-density-squared term, , the subhalo-density-squared term, , and the host-subhalo cross term, . In our analysis, we have ignored the cross term [see Eq. (12)], as spatial distributions of the host halo and subhalo contributions are quite different (the host halo being important inside the scale radius and the subhalos being important outside). In this Appendix, we quantify the importance of the cross term.
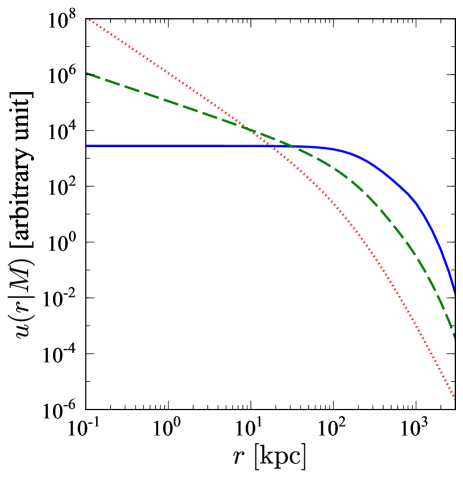
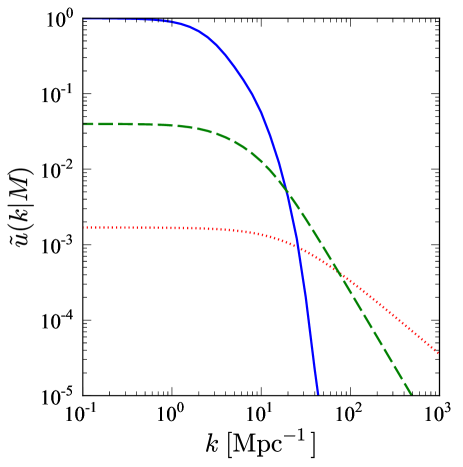
Figure 17 shows the density-squared profiles of a host halo, subhalos, and the cross term. As expected, the cross term becomes comparable to the other terms only within a narrow window in radii. For the host halo mass of and the redshift of , the cross term becomes comparable to the other terms at kpc, which is of the scale radius, kpc. Fig. 18 shows the Fourier transform.
References
- (1) G. Jungman, M. Kamionkowski and K. Griest, Phys. Rept. 267 (1996) 195 [hep-ph/9506380].
- (2) L. Bergstrom, Rept. Prog. Phys. 63 (2000) 793 [hep-ph/0002126].
- (3) G. Bertone, D. Hooper and J. Silk, Phys. Rept. 405 (2005) 279 [hep-ph/0404175].
- (4) P. Ullio, L. Bergstrom, J. Edsjo and C. G. Lacey, Phys. Rev. D 66 (2002) 123502 [astro-ph/0207125].
- (5) J. E. Taylor and J. Silk, Mon. Not. Roy. Astron. Soc. 339 (2003) 505 [astro-ph/0207299].
- (6) S. Ando, Phys. Rev. Lett. 94 (2005) 171303 [astro-ph/0503006].
- (7) T. Oda, T. Totani and M. Nagashima, Astrophys. J. 633 (2005) L65 [astro-ph/0504096].
- (8) L. Pieri, G. Bertone and E. Branchini, Mon. Not. Roy. Astron. Soc. 384 (2008) 1627 [arXiv:0706.2101 [astro-ph]].
- (9) S. Ando and E. Komatsu, Phys. Rev. D 73 (2006) 023521 [astro-ph/0512217].
- (10) S. Ando, E. Komatsu, T. Narumoto and T. Totani, Phys. Rev. D 75 (2007) 063519 [astro-ph/0612467].
- (11) S. Ando, E. Komatsu, T. Narumoto and T. Totani, Mon. Not. Roy. Astron. Soc. 376 (2007) 1635 [astro-ph/0610155].
- (12) F. Miniati, S. M. Koushiappas and T. Di Matteo, Astrophys. J. 667 (2007) L1 [astro-ph/0702083].
- (13) A. Cuoco, S. Hannestad, T. Haugbolle, G. Miele, P. D. Serpico and H. Tu, JCAP 0704 (2007) 013 [astro-ph/0612559].
- (14) A. Cuoco, J. Brandbyge, S. Hannestad, T. Haugboelle and G. Miele, Phys. Rev. D 77 (2008) 123518 [arXiv:0710.4136 [astro-ph]].
- (15) J. M. Siegal-Gaskins, JCAP 0810 (2008) 040 [arXiv:0807.1328 [astro-ph]].
- (16) S. K. Lee, S. Ando and M. Kamionkowski, JCAP 0907 (2009) 007 [arXiv:0810.1284 [astro-ph]].
- (17) M. Taoso, S. Ando, G. Bertone and S. Profumo, Phys. Rev. D 79 (2009) 043521 [arXiv:0811.4493 [astro-ph]].
- (18) M. Fornasa, L. Pieri, G. Bertone and E. Branchini, Phys. Rev. D 80 (2009) 023518 [arXiv:0901.2921 [astro-ph]].
- (19) J. M. Siegal-Gaskins and V. Pavlidou, Phys. Rev. Lett. 102 (2009) 241301 [arXiv:0901.3776 [astro-ph.HE]].
- (20) S. Ando, Phys. Rev. D 80 (2009) 023520 [arXiv:0903.4685 [astro-ph.CO]].
- (21) S. Ando and V. Pavlidou, Mon. Not. Roy. Astron. Soc. 400 (2009) 2122 [arXiv:0908.3890 [astro-ph.HE]].
- (22) J. Zavala, V. Springel and M. Boylan-Kolchin, Mon. Not. Roy. Astron. Soc. 405 (2010) 593 [arXiv:0908.2428 [astro-ph.CO]].
- (23) A. Ibarra, D. Tran and C. Weniger, Phys. Rev. D 81 (2010) 023529 [arXiv:0909.3514 [hep-ph]].
- (24) J. M. Siegal-Gaskins, R. Reesman, V. Pavlidou, S. Profumo and T. P. Walker, Mon. Not. Roy. Astron. Soc. 415 (2011) 1074S [arXiv:1011.5501 [astro-ph.HE]].
- (25) A. Cuoco, A. Sellerholm, J. Conrad and S. Hannestad, Mon. Not. Roy. Astron. Soc. 414 (2011) 2040 [arXiv:1005.0843 [astro-ph.HE]].
- (26) M. Fornasa et al., arXiv:1207.0502 [astro-ph.HE].
- (27) M. Ackermann et al. [Fermi LAT Collaboration], Phys. Rev. D 85 (2012) 083007 [arXiv:1202.2856 [astro-ph.HE]].
- (28) A. Cuoco, E. Komatsu and J. M. Siegal-Gaskins, Phys. Rev. D 86 (2012) 063004 [arXiv:1202.5309 [astro-ph.CO]].
- (29) L. Gao, C. S. Frenk, A. Jenkins, V. Springel and S. D. M. White, Mon. Not. Roy. Astron. Soc. 419 (2012) 1721 [arXiv:1107.1916 [astro-ph.CO]].
- (30) R. C. Gilmore, R. S. Somerville, J. R. Primack and A. Dominguez, arXiv:1104.0671 [astro-ph.CO].
- (31) R. K. Sheth and G. Tormen, Mon. Not. Roy. Astron. Soc. 308 (1999) 119 [astro-ph/9901122].
- (32) R. K. Sheth, H. J. Mo and G. Tormen, Mon. Not. Roy. Astron. Soc. 323 (2001) 1 [astro-ph/9907024].
- (33) J. F. Navarro, C. S. Frenk and S. D. M. White, Astrophys. J. 490 (1997) 493 [astro-ph/9611107].
- (34) G. L. Bryan and M. L. Norman, Astrophys. J. 495 (1998) 80 [astro-ph/9710107].
- (35) J. S. Bullock, T. S. Kolatt, Y. Sigad, R. S. Somerville, A. V. Kravtsov, A. A. Klypin, J. R. Primack and A. Dekel, Mon. Not. Roy. Astron. Soc. 321 (2001) 559 [astro-ph/9908159].
- (36) A. R. Duffy, J. Schaye, S. T. Kay and C. Dalla Vecchia, Mon. Not. Roy. Astron. Soc. 390 (2008) L64 [arXiv:0804.2486 [astro-ph]].
- (37) W. Hu and A. V. Kravtsov, Astrophys. J. 584 (2003) 702 [astro-ph/0203169].
- (38) A. M. Green, S. Hofmann and D. J. Schwarz, Mon. Not. Roy. Astron. Soc. 353 (2004) L23 [astro-ph/0309621].
- (39) A. M. Green, S. Hofmann and D. J. Schwarz, JCAP 0508 (2005) 003 [astro-ph/0503387].
- (40) J. Diemand, B. Moore and J. Stadel, Nature 433 (2005) 389 [astro-ph/0501589].
- (41) J. Diemand, M. Kuhlen and P. Madau, Astrophys. J. 649 (2006) 1 [astro-ph/0603250].
- (42) S. Profumo, K. Sigurdson and M. Kamionkowski, Phys. Rev. Lett. 97 (2006) 031301 [astro-ph/0603373].
- (43) A. A. Abdo et al. [Fermi-LAT Collaboration], Phys. Rev. Lett. 104 (2010) 101101 [arXiv:1002.3603 [astro-ph.HE]].
- (44) A. A. Abdo et al. [Fermi-LAT Collaboration], Astrophys. J. 720 (2010) 435 [arXiv:1003.0895 [astro-ph.CO]].
- (45) J. Han, C. S. Frenk, V. R. Eke, L. Gao, S. D. M. White, A. Boyarsky, D. Malyshev and O. Ruchayskiy, arXiv:1207.6749 [astro-ph.CO].
- (46) B. D. Fields, V. Pavlidou and T. Prodanovic, Astrophys. J. 722 (2010) L199 [arXiv:1003.3647 [astro-ph.CO]].
- (47) R. Makiya, T. Totani and M. A. R. Kobayashi, Astrophys. J. 728 (2011) 158 [arXiv:1005.1390 [astro-ph.HE]].
- (48) B. C. Lacki, S. Horiuchi and J. F. Beacom, arXiv:1206.0772 [astro-ph.HE].
- (49) T. Narumoto and T. Totani, Astrophys. J. 643 (2006) 81 [astro-ph/0602178].
- (50) Y. Inoue and T. Totani, Astrophys. J. 702 (2009) 523 [Erratum-ibid. 728 (2011) 73] [arXiv:0810.3580 [astro-ph]].
- (51) K. N. Abazajian, S. Blanchet and J. P. Harding, Phys. Rev. D 84 (2011) 103007 [arXiv:1012.1247 [astro-ph.CO]].
- (52) M. Ajello et al., Astrophys. J. 751 (2012) 108 [arXiv:1110.3787 [astro-ph.CO]].
- (53) V. Springel et al., Mon. Not. Roy. Astron. Soc. 391 (2008) 1685 [arXiv:0809.0898 [astro-ph]].
- (54) M. Ackermann et al. [Fermi-LAT Collaboration], Phys. Rev. Lett. 107 (2011) 241302 [arXiv:1108.3546 [astro-ph.HE]].
- (55) A. Geringer-Sameth and S. M. Koushiappas, Phys. Rev. Lett. 107 (2011) 241303 [arXiv:1108.2914 [astro-ph.CO]].
- (56) S. Ando and D. Nagai, JCAP 1207 (2012) 017 [arXiv:1201.0753 [astro-ph.HE]].