Discovery of a Probable SX Phoenicis Star in M107 (NGC 6171)11affiliation: Based on observations obtained with the SARA Observatory 0.9m telescope at Kitt Peak national Observatory, which is owned and operated by the Southeastern Association for Research in Astronomy (http://www.saraobservatory.org).
Abstract
Using images taken in May and June 2012 with the SARA Consortium’s 0.9-meter telescope located at Kitt Peak National Observatory, we searched for variable stars in the globular cluster M107 (NGC 6171). The search was accomplished using the ISIS v2.2 image subtraction software. We refined the positions of the previously known variables and confirmed the 21 RR Lyrae variables from Clement’s Catalog of Variable Stars in Globular Clusters (Clement et al., 2001). We also discovered a previously unknown variable which is likely an SX Phoenicis star. For this SX Phoenicis star we measured a fundamental pulsation frequency ( days) and a mean amplitude of magnitudes in the band. This variable had an average -band magnitude of 17.72, nearly 2 magnitudes dimmer than the horizontal branch of M107, typical of SX Phoenicis stars and blue stragglers lying just beyond the main sequence turn-off in globular clusters.
Journal of the Southeastern Association for Research in Astronomy, 7, 51-55, December 1 \slugcomment
and
I Introduction
Given the similar age, distance, and composition of their stars, globular clusters provide a natural laboratory for studying stellar evolution. Since globular clusters are an older population of stars they have a large number of post-main sequence stars, including many that lie in the instability strip, particularly RR Lyrae variables. These unstable pulsating variable stars give us insights into the ways that stars evolve after leaving the main sequence. In addition by studying pulsating variables stars and Fourier decomposition of their light curves it is also possible to determine their composition, mass, and absolute luminosities (Simon & Clement, 1993).
M107 (NGC 6171) is one such globular cluster containing a number of variable stars. Clement’s Catalog of Variable Stars in Globular Clusters lists 22 RR Lyrae stars (15 RR0,7 RR1), a Mira variable, an LB variable, and an unclassified variable in M107 (Clement et al., 2001). Clement & Shelton (1997) found the periods and light-curve Fourier coefficients of sixteen of these RR Lyrae stars. Given the relatively small number of variables previously found in M107 and its location near the celestial equator where it is observable in both the northern and southern hemisphere, we chose M107 to search for undiscovered pulsating variable stars.
In previous studies by this group we have searched for variables in 3 other globular clusters; identifying, classifying, and producing detailed light curves of 229 variables with 108 of them being newly discovered (Conroy et al., 2012; Toddy et al., 2012; Darragh & Murphy, 2012). Of the total we identified we classified 111 RR0, 79 RR1, 3 RRd/e, 8 SX Phoenicis, 7 eclipsing, and 22 long period variables. SX Phoenicis stars are of particular interest. They are stars similar to a -scuti class variable star but with lower metallicity (Population II), anomalously large masses and younger ages (Rodríguez & López-González, 2000). Compared to RR Lyrae stars they have a much higher pulsation frequency due to their position near the main sequence. As mentioned by Mateo et al. (1990) SX Phe stars are blue stragglers, likely the results of stellar mergers lying just above the main-sequence turnoff , thus giving past clues to the dynamical history of the cluster.
Using an image subtraction method developed by Alard (2000) we searched the central of M107 for variable stars using observations during May and June 2012. Using this method we confirmed all the previously known variables in our field, as well as discovered the existence of an SX Phe star in M107.
II Observations and Reduction
Images were obtained using the Southeastern Association for Research in Astronomy (SARA) North 0.9m telescope located at Kitt Peak National Observatory. The system uses an Apogee Alta U42 CCD detector with Kodak e2V CC42-40 with a gain of 1.2 electrons per count and a read noise of 6.3 electrons cooled to approximately -30∘C. Using binning this gave a plate scale of 0.82\arcsec/px and a field of view. The setup is ideal for finding variables in globular clusters because the aperture is large enough to find faint variables but small enough to use reasonable exposure times. In addition we had regular access to the telescope, and could therefore obtain enough data to analyze the light curves and determine periods of the variables.
Observations were made using a Bessel V filter on 23 May 2012 and 7, 8, 9, and 20 June 2012. Typical seeing was 2.5\arcsec and generally between 2\arcsec and 3.5\arcsec. Exposures on 23 May were 120 seconds long, and all exposures in June were 90 seconds. Figure 1 shows the unphased light curve of a low amplitude SX Phoenicis star on 20 June, our longest night.
We performed standard image reduction using Maxim DL to apply bias, dark, and flat frames. In order to reduce the number of false positives in ISIS we ran the frames through Maxim DLs hot and bad pixel removal kernels, and used the craverage cosmic ray removal task in IRAF. We also rejected image frames containing satellite trails, star trails from poor guiding, or seeing worse than 3.5\arcsec.
1.25 \plotoneV26_day5.eps
III Analysis
III.1 Image Subtraction
Image subtraction was done using the ISIS v2.2 software package (Alard & Lupton, 1998; Alard, 2000) using the same procedure used by Conroy et al. (2012). This package uses a number of programs and c-shell scripts to align many frames together, perform image subtraction, find objects with variability, and produce light curves for those objects.
ISIS compensates for variable seeing conditions by convolving a high quality reference frame with each individual frame, and then performing the subtraction. The SIGTHRESH parameter controls the threshold for finding variable objects. We modified this parameter until roughly a thousand objects were found, then manually examined the light curves to extract true variables from the more numerous false positives.
Our reference frame was produced by combining the 7 best images from the night of 6 June 2012, because that was the night with the best seeing.
III.2 Magnitude Calibration
ISIS outputs its photometry in the form of differential flux (the difference in flux between the reference frame and the image frame). Unfortunately, as Baldacci et al (2005) pointed out, a simple conversion from the differential flux to magnitude by
| (1) |
does not produce accurate results. In this equation is the reference flux, is the differential flux, and is a constant. To remedy this we use a method described by Baldacci et al (2005) to calibrate the differential flux from ISIS with instrumental magnitudes from DAOPHOT.
The calibration was performed using PSF fitting photometry on the night of 20 June 2012 using the standalone DAOPHOT and ALLFRAME packages(Stetson, P. B., 1987, 1994). In the DAOPHOT package we used the FIND procedure to find stars above a threshold of where is the standard deviation of the sky background. We then used the PHOT procedure which performed initial aperture photometry on the stars found. However since the field is crowded the results of aperture photometry are not acceptable, therefore we used PSF fitting for more accurate photometry. This was done using PICK to select the 25 brightest stars which were not overexposed and did not overlap with any brighter stars, followed by PSF to construct a semi-empirical model of the PSF for each frame. DAOMATCH was then used to produce a rough transformation between the frames, followed by DAOMASTER to increase the accuracy of the transformation. After obtaining transformations we created a median image using MONTAGE2. Following this step we ran FIND, PHOT, PICK, and PSF on the median image and then ALLSTAR to perform PSF fitting photometry on the median image. Following the subtraction of the PSFs for all found stars from the original image we again ran FIND and PHOT on the subtracted image, and add the new stars to the star list, and perform ALLSTAR on the original image with the revised star list. This process is repeated until all stars have been added. We then ran ALLSTAR on all of the individual frames. Finally ALLFRAME was applied to the transformation list to improve the PSF fits for each frame by looking at all of the frames simultaneously. DAOPHOT does not take into account the JD, airmass, or exposure time, so scripts were written to extract this information from the headers.
After obtaining the instrumental magnitudes for the night of 20 June 2012 we found the instrumental magnitude for the SX Phe star from the reference frame used in ISIS. This was accomplished using the procedure outlined above, however since we only had a single frame we did not perform the steps for DAOMATCH, DAOMASTER, MONTAGE2, or ALLFRAME, and instead used only ALLSTAR to perform the photometry. However multiple runs were used to find all stars, as was done with the median image.
Next we attempted to fit the differential flux to the instrumental magnitude for this night as described by Baldacci et al (2005). Since DAOPHOT uses a zero point of 25 for its photometry we calculated the reference flux for the SX Phe star from the reference frame using
| (2) |
where is the instrumental magnitude from the reference frame. After extracting the instrumental magnitudes from the output of ALLFRAME, we used a program written in C++ which attempted several fits of the differential flux to instrumental magnitude using the equation given by Baldacci et al (2005):
| (3) |
varying A between 0.5 and 2, and C between 24 and 26. We optimized A and C to minimize the test statistic
| (4) |
where is the number of acceptable data points. Data points are acceptable if the residual for the current fit () is less than 0.1 magnitudes. Furthermore any fit where more than 25% of the data points are not acceptable is rejected.
Once the values of and were obtained, we converted all of the ISIS data from fluxes to magnitudes using equation 3. Although this method worked well for the previously discovered variables, the SX Phe was two faint for DAOPHOT to find on the individual frames, although we could perform photometry for it on the reference frame. Therefore we used the median values of A and C from the values for the other variables. This is not a bad estimate since the values for A and C do not vary significantly in the field of view, and in this case at least, the median, mode and mean are identical to within 0.01. We obtained the values and , both of which are close to the expected values of 1 and 25 respectively.
Finally to transform from instrumental magnitude to apparent magnitude we use
| (5) |
where is the apparent magnitude, is the instrumental magnitude, is the exposure time of the frames used for the calibration with DAOPHOT, which was 90 seconds. The 22.633 term is the zeropoint of 25 used by DAOPHOT minus a measured offset for our system. This gives us an approximate apparent magnitude of 17.72 for the SX Phe star.
For the RR Lyrae variables that were in our field we applied the same procedure. We found a median magnitude for these variables of 15.72, two full magnitudes brighter than our suspected SX Phe star. Given that RR Lyrae stars are horizontal branch stars this would also be the typical magnitude of the horizontal branch for M107. Typically the main-sequence turnoff would be 3.5 magnitudes dimmer than the horizontal branch, or roughly 19.2.
| Night of Observation (JD) | Amplitude (V Magnitude) |
|---|---|
| 2456070 | 0.054 |
| 2456085 | 0.052 |
| 2456086 | 0.053 |
| 2456087 | 0.032 |
| 2456098 | 0.046 |
III.3 Frequency Analysis
Once our differential fluxes were converted into magnitudes via the procedure described in section 3.2 they were analyzed using the software package Period04 (Lenz & Breger, 2005). Period04 was used to determine the frequency and amplitude of the fundamental frequency of the SX Phe star. We searched for the fundamental frequency in the range 0 to 50 day-1 with a step size of 0.00176 day-1. Two outliers were removed that obviously were spurious points in the light curve. The average magnitude of the SX Phe star was also obtained from Period04. The results for other harmonics were unreliable due to the faintness of the object and the quality of the data.
III.4 Astrometry
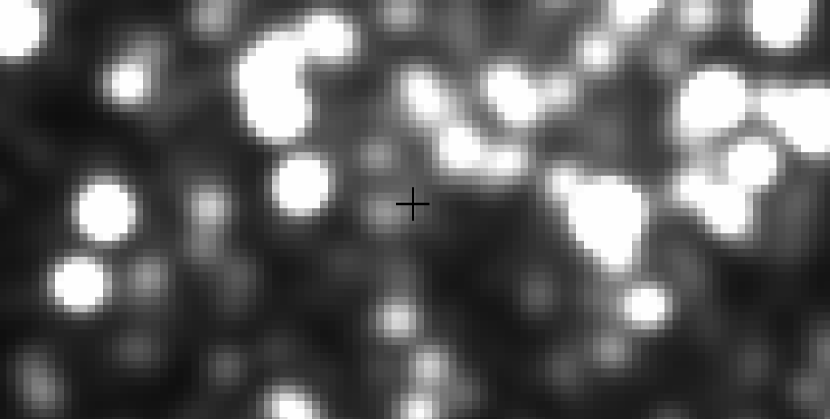
After identifying variable stars using ISIS their coordinates were in units of pixels. To convert to conventional celestial coordinates we used the ccmap and ccsetwcs tasks in IRAF to apply a world coordinate system to our alignment image. We used a set of nine stars from the NOMAD catalog to match the physical coordinates of our frame with the fk5 celestial coordinate system. We then used the center task to ensure that the pixel coordinates for the variable stars were centered on the centroid. Finally we converted the pixel coordinate system to celestial coordinates. Figures 2, 3, and 4 show our field of view and subsets of our field of view, along with the positions of known variables. The SX Phe star is indicated as number 26.
1.18 \plotonefinder_full.eps
1.18 \plotonefinder_core.eps
1.2 \plotoneV26_phase.eps
IV Results
Using the image subtraction package ISIS we found all of the variables documented by Clement et al. (2001) in our field and verified their classifications. We also discovered an SX Phe star located at , . It was measured to have a pulsation frequency of (0.05257 days) with an amplitude of magnitudes, roughly 0.1 magnitudes from minimum to maximum. The average V magnitude was 17.72. Using Period04’s Monte Carlo simulation we estimated the errors for the frequency and magnitude as 0.0011 and 0.0031, respectively. The Monte Carlo error for frequency is less than our exposure time, and the error for magnitude is less than our error for the transformation, which suggests our results are limited primarily by observational error. The frequency, V magnitude, and amplitude are consistent with the variable being an SX Phe star in a globular clusters. It is 2 magnitudes dimmer than the horizontal branch of M107. This would place it roughly 1.5 magnitudes above the main sequence turn-off which is typically where SX Phe stars and blue stragglers are found.
Figure 1 shows our observations for June 20 (our longest night) and Figure 5 shows all of the data combined and phased. As can be seen from the Figure 1 and Figure 5, although the frequency appears consistent, the amplitude may be modulating. Using Period04 we determined amplitudes for each night separately, with the results listed in Table 1.
When performing astrometry we discovered that the coordinates given by Clement et al. (2001), which originated from Oosterhoff (1938) were inaccurate by a few arcseconds. Given that these coordinates were obtained in 1938 with photographic plates this inaccuracy is not surprising. Here we present revised coordinates in Table IV. Two of the variables, V1 and V2, were outside of our field of view. Their coordinates are taken from Clement et al. (2001).
cr@hl@ml@sr@∘l@′l@
′′ c
\tabletypesize
\tablecaptionAstrometry and classification of variables in M107
\tablewidth
\tablehead
\colheadVariable11footnotemark: 1a &
RA (2000)22footnotemark: 2b
Dec (2000)
\colheadType
\startdataV133footnotemark: 3c 163224.340 -131155.60 M
V244footnotemark: 4c 163241.780 -130942.40 RR0
V3 163216.656 -130623.60 RR0
V4 163225.237 -130555.52 RR1
V5 163247.887 -130557.10 RR0
V6 163231.290 -130425.60 RR1
V7 163234.906 -130418.67 RR0
V8 163232.800 -130359.93 RR0
V9 163230.181 -130337.84 RR1
V10 163228.054 -130310.32 RR0
V11 163232.574 -130244.98 RR0
V12 163235.984 -130216.57 RR0
V13 163230.095 -130206.09 RR0
V14 163233.118 -130155.53 RR0
V15 163233.182 -130117.45 RR1
V16 163227.326 -130124.86 RR0
V17 163225.146 -130207.07 RR0
V18 163237.163 -125941.75 RR0
V19 163247.839 -130032.52 RR1
V20 163234.060 -130226.23 RR0
V21 163237.579 -130542.22 RR1
V23 163213.917 -130301.46 RR1
V24 163231.958 -130309.73 RR0
V2555footnotemark: 5d \nodata \nodata
Lb
V26666ae 163232.660 -130300.38 SX Phe
\enddataWe used the same variable numbers as Clement et al. (2001), with
the exception of V26 which was not in Clement’s catalog.
66footnotetext: bOur coordinates differed by a few arcseconds from
Clement et al. (2001), likely due to their using photographic plates.
66footnotetext: cV1 and V2 are outside of our field of view, the coordinates
and variable type are taken from Clement et al. (2001), and the coordinates may be
inaccurate.
66footnotetext: dV25 was discovered by Lloyd Evans
& Menzies (1973), but no coordinates
were available, and we did not detect this star, possibly due to a long period.
66footnotetext: eV26 was discovered in this study.
V Conclusion
We have verified and refined the positions of 21 previously known variables in M107 as documented by Clement et al. (2001). We have also discovered a probable new SX Phe star located at , with fundamental frequency of (0.05257 days) with a mean V magnitude and amplitude of 17.72 and magnitudes, respectively. The discovery of this faint variable shows the power of using ISIS to look for variable stars. In addition we have improved the astrometry for the previously discovered variables in M107.
Unfortunately the SX Phe star was too faint for us to obtain a high signal-to-noise with our observations, and therefore we were limited in the amount of frequency analysis we could perform.
Acknowledgements.
We thank C. Alard for making ISIS 2.2 publicly available and P Stetson for useful advise in using DAOPHOT and ALLFRAME. This project was funded in part by the National Science Foundation Research Experiences for Undergraduates (REU) program through grant NSF AST-1004872. Additionally A. Darragh, E. Johnson, and B. Murphy were partially funded by the Butler Institute for Research and Scholarship. The authors also thank F. Levinson for a generous gift enabling Butler University’s membership in the SARA consortium.References
- Alard & Lupton (1998) Alard, C., & Lupton, R. H. 1998, Astrophys. J. , 503, 325
- Alard (2000) Alard, C. 2000, A&AS, 144, 363
- Baldacci et al (2005) Baldacci, L., Rizzi, L., Clementini, G., & Held, E. V. 2005, A&A, 431, 1189
- Clement et al. (2001) Clement, C. M., Muzzin, A., Dufton, Q., et al. 2001, AJ, 122, 2587
- Clement & Shelton (1997) Clement, C. M., & Shelton, I. 1997, AJ, 113, 1711
- Conroy et al. (2012) Conroy, K. E., Darragh, A. N., Liu, Z. J., & Murphy, B. W. 2012, JSARA, 5, 34
- Darragh & Murphy (2012) Darragh, A. N., & Murphy, B. W. 2012, JSARA, 6, 72
- Lenz & Breger (2005) Lenz P., Breger M. 2005, CoAst, 146, 53
- Lloyd Evans & Menzies (1973) Lloyd Evans, T., & Menzies, J. W. 1973, IAU Colloq. 21: Variable Stars in Globular Clusters and in Related Systems, 36, 151
- Mateo et al. (1990) Mateo, M., Harris, H. C., Nemec, J., & Olszewski, E. W. 1990, AJ, 100, 469
- Oosterhoff (1938) Oosterhoff, P. T. 1938, Bull. Astron. Inst. Netherlands, 8, 273
- Rodríguez & López-González (2000) Rodríguez, E., & López-González, M. J. 2000, A&A, 359, 597
- Simon & Clement (1993) Simon, N. R., & Clement, C. M. 1993, Astrophys. J. , 410, 526
- Stetson, P. B. (1987) Stetson, P. B. 1987, PASP, 99, 191
- Stetson, P. B. (1994) Stetson, P. B. 1994, PASP, 106, 250
- Toddy et al. (2012) Toddy, J. M., Johnson, E. W., Darragh, A. N., & Murphy, B. W. 2012, JSARA, 6, 63