The Metallicity Dependence of the Minimum Mass for Core-Collapse Supernovae
Abstract
Understanding the progenitors of core collapse supernovae and their population statistics is a key ingredient for many current studies in astronomy but as yet this remains elusive. Using the MESA stellar evolution code we study the dependence of the lower mass limit for making core collapse supernovae (SNe) as function of initial stellar metallicity. We find that this mass limit is smallest at with a value of . At the limit is and continues to rise with higher metallicity. As a consequence, for a fixed initial mass function the supernova rate may be to higher at than at . This affects the association of observed SN rates as a probe for the cosmological star formation rate, rate predictions for supernova surveys, and population synthesis studies.
1 Introduction
Most massive stars end their lives as core collapse supernovae (CCSN; Colgate & White 1966). There is a lower mass limit below which a single star of a given metallicity, , will not undergo such a supernova (SN; Eldridge & Tout 2004; Heger et al. 2003; Smartt 2009). Below this limit, a star ejects its envelope as an asymptotic giant branch (AGB) star, forms a planetary nebula, and becomes a white dwarf (Eldridge & Tout, 2004); the remaining mass of the star will be less than the Chandrasekhar mass, . Above the limit, however, the star builds up an iron core by nuclear fusion until the mass of the core exceeds a critical mass, (Eldridge & Tout, 2004; Heger et al., 2003). In such a star core collapse occurs: the iron core will fall inwards until repulsive nuclear forces stop its collapse.
The actual value of this lower mass limit depends greatly on a variety of factors (Nomoto & Hashimoto, 1988), including the numerical simulations code used and how the relevant physics is modeled, e.g., the mass loss rates, mixing processes, convective boundary layers and semiconvection, which change the resulting interior composition structure of the star. Rotation may also affect the limit (Eldridge & Tout, 2004), but be we do not explore this in the present study. Metallicity-independent values of are often used in the literature (Heger et al., 2003), though we expect that it should be affected by metallicity (Cassisi & Castellani, 1993; Eldridge & Tout, 2004). Current models (Eldridge & Tout, 2004) of the lower mass limit as a function of have been made with only a limited resolution in and cover a rather limited regime. Observational determinations are too uncertain to explore the lower limit precisely. Smartt (2009) determines from a combination of supernovae detections and the Salpeter initial mass function (IMF) that the lower limit lies between and , whereas Cassisi & Castellani (1993) focused on the dependence over a wide range of values. These investigations, however, have not provided detailed information on how the lower limit depends on .
A star with initial mass lower than that required for a classical CCSN may also undergo core collapse triggered by electron captures (Nomoto, 1984); this is expected to occur for a narrow range of initial stellar masses (Miyaji et al., 1980; Miyaji & Nomoto, 1987; Poelarends et al., 2008). Poelarends et al. (2008) estimates this range to be between and . We, however, do not explore this case; we instead focus on the minimum mass required for classical core collapse events. We also do not consider binary stars in which the mass limits will be altered by interaction including mass transfer and accretion. The minimum mass required for a star to still be able to ignite carbon burning and possibly become an electron capture SN is denoted , while that required for a star to undergo a classical core collapse event not triggered by electron captures with an ONe degenerate core is denoted . Thus, we focus on .
We present results from a grid of non-rotating stellar models that map the minimum supernova mass as a function of metallicity. In §2 we describe the models used and the physics relevant to supernova progenitors. Then in §3 we give the results from the grid of stellar models and provide a metallicity-dependent fitting function for the minimum mass for supernovae, . We discuss the implications of the results on cosmology and galactic chemical evolution due to changes in the number of SNe with in §4. The discussion includes a brief summary of uncertainties and physical effects that cause the observed trends. Our conclusions are given in §5.
2 Setup and Simulations
We used MESA (Modules for Experiments in Stellar Astrophysics, http://mesa.sourceforge.net/) code revision 3290. MESA is a modern, open source package for computational astrophysics (Paxton et al., 2011) and includes a 1D stellar evolution code, MESA star whose parts have been tested internally and verified with well-known evolution results.
We computed a grid of non-rotating stellar models, with composition scaled linearly according to . For the relative mass fractions of metals we use Grevesse & Sauval (1998) and Anders & Grevesse (1989) for , , and . The computation grid covers values of between and , and the initial masses ranged from to . For each model we follow the evolution from the pre-main sequence to the point where we can determine whether a core collapse supernova should result.
Whereas recent solar abundance determinations (Asplund et al., 2009; Lodders et al., 2009) have different abundance ratios and, foremost, a different absolute metallicity, this should have little effect on our overall conclusions. Additionally, the use of scaled solar metallicity is a common simplification, and whereas it does not account for details of the galacto-chemical evolution of the different species, nor the spread of abundance ratios for a given metallicity for different environments or times, it should still approximate the key properties of how varying metallicity changes the supernova mass limit.
2.1 Mass loss
Mass loss can strongly affect stellar evolution and the final fate of the star, especially for high mass and high metallicity (e.g., Heger et al. 2003). Here we applied the mass loss rates of de Jager et al. (1988) to the entire range of stars. Despite their age they are still considered adequate (Eldridge & Tout, 2004). These rates are empirical but they agree well with the theoretical rates of Vink et al. (2000, 2001; Eldridge & Tout 2004). The mass loss rates were scaled by a constant efficiency factor to adjust the empirical rates such that evolutionary tracks for non-rotating models match observational data (Maeder & Meynet, 2001).
2.2 Overshooting
Convective overshooting increases the size of the helium core (Schröder et al., 1997) and thereby affects the mass limit for supernovae. We use the exponential diffusive model based on the prescription of Freytag et al. (1996). The diffusive coefficient, , is given by , where , , and are determined by the particular overshooting region: is the location from its boundary, is the pressure scale height at the convective boundary, and . Here is a typical velocity at the boundary of the convective zone, a typical timescale (Freytag et al., 1996), and is a free parameter that governs the efficiency of the overshoot mixing. For all models we adopt a value of , following Herwig (2000).
2.3 Determining the fate of the star
The evolution past central helium burning of a star with initial mass between and generally proceeds along the AGB. This begins by dredging up the helium shell above the core before usual helium shell flashes set in (Herwig, 2005; Iben & Renzini, 1983). A star that produces a CCSN, however, will be halted in this evolution usually before the shell flashes by igniting neon burning. Once neon has ignited, the core typically burns all the way to iron and a core collapse ensues.
The maximum mass of a stable white dwarf is (Chandrasekhar, 1935). If the core consists entirely of and , then and . But if the core is composed of , then and . Hence it is necessary to consider the composition of the core to obtain a useful value for . For our models we have found that a value was a good indicator for igniting advanced burning phases, and this value is consistent with those used by other studies (Eldridge & Tout, 2004). It corresponds to a .
Eldridge & Tout (2004) find that the final fate of the star depends greatly on the second dredge-up, since the second dredge-up directly impacts the mass and chemical composition of the core by removing material of a certain composition from the core. The interplay of dredge-up and burning processes determines whether the cores can reach and hence the final fate of the stars. For example, for stars of about initial mass, dredge-up reduces the core size below so that a SN will not result; for stars of initial mass dredge-up will not occur, and nuclear burning increases the core mass until it cannot support itself and a SN results (Eldridge & Tout, 2004).
Therefore simulations were run at least until the second dredge-up was finished by the time we determined the final fate. We assumed the outcome will be a white dwarf (WD) when: i) in the core, i.e., energy loss due to neutrino emissions is greater than energy generation by nuclear burning, so that the core continues to cool; and ii) .
These two criteria imply that further burning in the core will not ignite. Here we do not consider the case of electron capture supernovae (ECSN) in super-AGB stars (Poelarends et al., 2008). In that case, an ONe core collapses due to electron captures on and before onset of burning (Miyaji et al., 1980; Miyaji & Nomoto, 1987). Those would allow supernovae from stars with initial masses below the lower limit for core collapse supernovae as studied here.
Conversely, we use the following criteria as indicators that a star becomes a core collapse SN: i) The onset of burning, the final stage before core collapse; and ii) .
It may not be necessary to wait for burning, since after the onset burning the core should proceed to burning. To assure this, our models were run to burning, nevertheless. Since the burning timescale ranges from about d (Woosley & Janka, 2005) to about yr and since this is much shorter than the dredge-up timescales, the core mass will not shrink further. The second criterion ensures that core is large enough to undergo core collapse. We require that the stellar core must be well established and therefore the models must be run at least until they finish the second dredge-up.
We stopped the evolution simulation when both criteria for either one of the stellar fates (WD or SN Type II) were met and allowed us to determine the fate of the model.
3 Results
| () | () | () | |||
|---|---|---|---|---|---|
| 0 | 9.2 | 1 | 8.8 | 1 | 8.45 |
| 1 | 9.25 | 1 | 8.7 | 2.5 | 8.65 |
| 1 | 9.25 | 4 | 8.56 | 5 | 8.95 |
| 3 | 9.35 | 7 | 8.55 | 7.5 | 9.05 |
| 5 | 9.5 | 1 | 8.47 | 1.5 | 9.35 |
| 1 | 9.5 | 2 | 8.43 | 1.9 | 9.5 |
| 3 | 9.3 | 5 | 8.47 | 3 | 9.6 |
| 1 | 9.05 | 1 | 8.35 | 4 | 9.85 |
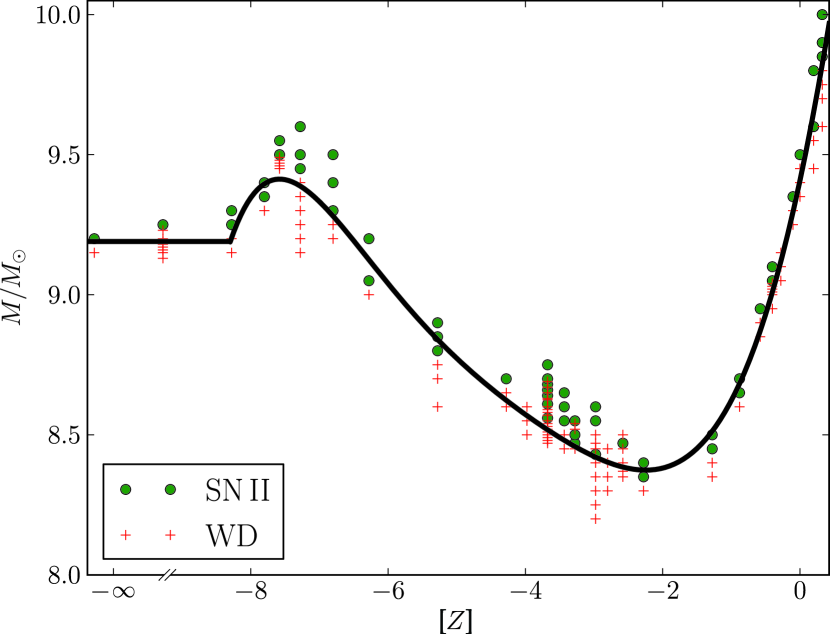
In Table 1, we list for each metallicity, , the minimum mass of a model that produced an SN Type II. A metallicity-dependent transition mass, , can be fitted by
| (1) |
with coefficients given by
| (2) |
For , where , this formula has a deviation of only ( for the entire range).
We find that for the lower mass limit becomes metallicity-independent and is best fit by a constant value of . Figure 1 shows the fate for each model we computed as a function of its initial and and our fitting function .
4 Discussion
Our results are consistent with both observations (Smartt, 2009) and the current paradigm (Eldridge & Tout, 2004; Heger et al., 2003) that the minimum supernova mass lies between and . Specifically, previous findings (Eldridge & Tout, 2004; Nomoto & Hashimoto, 1988) that the fate of the star depends on the evolution during the second dredge-up are confirmed. For all models, an ONe core grew during dredge-ups. We could determinate whether the star makes a supernova after the second dredge-up. Eldridge & Tout (2004) note that this behavior is because of early burning, which is confirmed by our models, including off-center ignition of burning. In a few cases the more advanced burning stages (usually Si burning) did not occur. In those cases we assumed that the star ejects its envelope and peacefully becomes a WD. Once burning ignites, however, the star will evolve to core collapse.
4.1 Uncertainties
We do not find a sharp transition mass in our simulations. Instead, for a given , we find a switching back and forth between making SNe and WDs several times as the initial mass is increased. Most of this might be attributed to numerical noise. We note, however, that the non-linear nature of stellar structure, e.g., the interaction of different shell burning phases during carbon burning, may cause similar phenomena. But we cannot quantify the relative magnitude of this effect, if present. It is included in our error estimate. In “real” stars, additionally, convection will be chaotic––there is “weather” inside stars––but this is an effect beyond the realm of our simulations, next to rotation, binary stars, etc. Based on our detailed studies, e.g., for , we estimate an uncertainty of the transition mass of about for all values of , excluding systematic errors due to the model.
4.2 Impact of Metallicity on Evolution
At the highest metallicities we see the effect of increasing mass loss (§ 2.1) that reduces the mass of the star and hence shifts the mass limit upward. Additionally, an increase of opacity due to higher metal contact can also lead to more efficient dredge-ups that reduce the size of the core. The increase of the transition mass at low metallicities (), where mass loss becomes unimportant, is dominated by a decrease in opacity. Therefore a smaller fraction of the core will be convective, leading to larger transition mass as decreases below . Below the initial abundance of CNO isotopes is so low that it is insufficient to efficiently drive hydrogen burning: the star contracts until carbon is made by fusing helium in a primary way, then re-expands, hence the evolution becomes -independent for even lower .
Whereas does depend on the specific stellar model code, the choice of physics used, and numerical implementation, as is well known, we expect that the general shape of the function arises from the underlying stellar physics and should not depend on the specific simulations used.
4.3 Impact on supernova rates
Using the Salpeter (1955) IMF we can compute the number of stars that make SNe,
where is a normalization constant. The lower limit, , of the integral was explored here as a function of . A conservative upper limit for the maximum initial mass of a supernova progenitor, , may be as high as . Stars of higher mass are very rare. More realistic is a typical transition mass from SNe to collapse without SN display at (Heger et al., 2003; O’Connor & Ott, 2011; Ugliano et al., 2012) to as low as based on recent observational studies (Smartt, 2009). Therefore a rough estimate of a typical is not unreasonable, and we will use this as our reference case. Similar to , there may not be a unique transition mass (Heger et al., 2003; O’Connor & Ott, 2011; Ugliano et al., 2012). Whereas the upper limit may depend on metallicity (e.g., Zhang et al., 2008), this dependence is very uncertain and beyond the purpose of this paper. Woosley et al. (2002), Fig. 4, show that between and there is little difference in core mass, and hence anticipated SN properties, for stars of and and the same initial mass. Therefore we will consider here only a constant upper mass limit.
Although the IMF itself could depend on metallicity as well, there is no overwhelming observational indication that it does (Kroupa, 2002). From theoretical considerations it was suspected that below a critical metallicity only very massive () stars formed (Ciardi & Ferrara, 2005) that would not form supernovae and collapse to black holes instead. Only above would a “normal” IMF set in. The recently reported very metal-poor () and low-mass star (Caffau et al., 2011) however calls into question the validity of . Recent work on nucleosynthesis from Pop III stars (Heger & Woosley, 2010) also does not provide strong support for a change in the IMF, at least not for massive stars. Hence we assume a metallicity-independent IMF.
The -dependence of leads to a large change in due to the high weight of the IMF at low . Using our preferred value of , our value at (Table 1) this leads to a increase of compared to with (Table 1). Assuming the very conservative value of for comparison, the change in still is . The magnitude of the enhancement is not very sensitive to the upper mass limit as long as it is . The uncertainty in dominates over the impact of the numerical noise in on the estimate of .
More important for cosmological applications is to know as a function of redshift (Lien & Fields, 2009). This would allow us to find the number of supernovae formed at each epoch of the history of the universe. To make this connection, we need to know the distribution of and star formation rate as a function of redshift. These parameters are all known to be connected to some extent; for example, Mannucci et al. (2010) give a fundamental metallicity relation (FMR) that connects star formation rate, metallicity, and galaxy mass, but no better than . A detailed assessment of this, however, is beyond the scope of this work. The effect we present here is in contrast to the recently found lack of core collapse SNe at high redshift (Horiuchi et al., 2011).
Similar to the SN rates, the variation of the lower mass limit with metallicity changes the ratio of neutron star (NS) to black hole (BH) formation used in population synthesis studies (Fryer, 1999). The effective nucleosynthesis yields from supernova used in galacto-chemical evolution models will be changed by allowing a larger contribution from low-metallicity stars.
5 Conclusions
We have computed for the first time the minimum mass for stars to make classical core collapse supernovae, , as a function of metallicity, , at a high level of detail. Our results generally agree with previous estimates by Eldridge & Tout (2004); Heger et al. (2003) but significantly improve the quantitative results and detailed dependence.
We find an increase of for , resulting in a decrease in the fraction of stars making CCSNe for a fixed IMF. Compared to a constant lower mass limit for supernovae this constitutes an increase in the supernova rate by to at low metallicity. Only for does the SN rate increase again. This has significant impact on interpreting observed SN rates as a probe of star formation history, on predictions of expected SN rates for upcoming surveys, and for NS/BH ratios for population synthesis studies.
Future work should include stellar rotation, binary stars, the mass range required for ECSN from super-AGB stars, including how changes relative to as a function of metallicity, and a better understanding of the upper mass limit for supernovae. We need to connect the results to galactic parameters in order to better quantify the relative number of supernovae, neutron stars, and black holes as a function of redshift. Much of the underlying theory for these, however, is still very uncertain at the present.
6 Acknowledgments
We thank Bill Paxton and the MESA user group for their advice and support. This research was supported by NSF through grant AST-1109394. AH acknowledges support from the DOE Program for Scientific Discovery through Advanced Computing (SciDAC; DE-FC02-09ER41618), by the US Department of Energy under grant DE-FG02-87ER40328, and by the Joint Institute for Nuclear Astrophysics (JINA; NSF grant PHY02-16783), and an Australian ARC Future Fellowship.
References
- Anders & Grevesse (1989) Anders, E., & Grevesse, N. 1989, Geochim. Cosmochim. Acta, 53, 197
- Asplund et al. (2009) Asplund, M., Grevesse, N., Sauval, A. J., & Scott, P. 2009, ARA&A, 47, 481
- Caffau et al. (2011) Caffau, E., Bonifacio, P., François, P., et al. 2011, Nature, 477, 67
- Cassisi & Castellani (1993) Cassisi, S., & Castellani, V. 1993, ApJS, 88, 509
- Chandrasekhar (1935) Chandrasekhar, S. 1935, MNRAS, 95, 207
- Ciardi & Ferrara (2005) Ciardi, B., & Ferrara, A. 2005, Space Sci. Rev., 116, 625
- Colgate & White (1966) Colgate, S. A., & White, R. H. 1966, ApJ, 143, 626
- de Jager et al. (1988) de Jager, C., Nieuwenhuijzen, H., & van der Hucht, K. A. 1988, A&AS, 72, 259
- Eldridge & Tout (2004) Eldridge, J. J., & Tout, C. A. 2004, MNRAS, 353, 87
- Freytag et al. (1996) Freytag, B., Ludwig, H.-G., & Steffen, M. 1996, A&A, 313, 497
- Fryer (1999) Fryer, C. L. 1999, ApJ, 522, 413
- Grevesse & Sauval (1998) Grevesse, N., & Sauval, A. J. 1998, Space Sci. Rev., 85, 161
- Heger et al. (2003) Heger, A., Fryer, C. L., Woosley, S. E., Langer, N., & Hartmann, D. H. 2003, ApJ, 591, 288
- Heger & Woosley (2010) Heger, A., & Woosley, S. E. 2010, ApJ, 724, 341
- Herwig (2000) Herwig, F. 2000, A&A, 360, 952
- Herwig (2005) —. 2005, ARA&A, 43, 435
- Horiuchi et al. (2011) Horiuchi, S., Beacom, J. F., Kochanek, C. S., et al. 2011, ApJ, 738, 154
- Iben & Renzini (1983) Iben, Jr., I., & Renzini, A. 1983, ARA&A, 21, 271
- Kroupa (2002) Kroupa, P. 2002, Science, 295, 82
- Kudritzki & Puls (2000) Kudritzki, R.-P., & Puls, J. 2000, ARA&A, 38, 613
- Lien & Fields (2009) Lien, A., & Fields, B. D. 2009, J. Cosmology Astropart. Phys, 1, 47
- Lodders et al. (2009) Lodders, K., Palme, H., & Gail, H.-P. 2009, in “Landolt-Börnstein - Group VI Astronomy and Astrophysics Numerical Data and Functional Relationships in Science and Technology Volume,” ed. J. E. Trümper, 44
- Maeder & Meynet (2001) Maeder, A., & Meynet, G. 2001, A&A, 373, 555
- Mannucci et al. (2010) Mannucci, F., Cresci, G., Maiolino, R., Marconi, A., & Gnerucci, A. 2010, MNRAS, 408, 2115
- Miyaji & Nomoto (1987) Miyaji, S., & Nomoto, K. 1987, ApJ, 318, 307
- Miyaji et al. (1980) Miyaji, S., Nomoto, K., Yokoi, K., & Sugimoto, D. 1980, PASJ, 32, 303
- Nomoto (1984) Nomoto, K. 1984, ApJ, 277, 791
- Nomoto & Hashimoto (1988) Nomoto, K., & Hashimoto, M. 1988, Phys. Rep., 163, 13
- O’Connor & Ott (2011) O’Connor, E. & Ott, C. D. 2011, ApJ, 730, 70
- Paxton et al. (2011) Paxton, B., Bildsten, L., Dotter, A., et al. 2011, ApJS, 192, 3
- Poelarends et al. (2008) Poelarends, A. J. T., Herwig, F., Langer, N., & Heger, A. 2008, ApJ, 675, 614
- Salpeter (1955) Salpeter, E. E. 1955, ApJ, 121, 161
- Schröder et al. (1997) Schröder, K.-P., Pols, O. R., & Eggleton, P. P. 1997, MNRAS, 285, 696
- Smartt (2009) Smartt, S. J. 2009, ARA&A, 47, 63
- Ugliano et al. (2012) Ugliano, M., Janka, H.-T., Marek, A., Arcones, A. 2012, ApJ, 757, 69
- Vink et al. (2000) Vink, J. S., de Koter, A., & Lamers, H. J. G. L. M. 2000, A&A, 362, 295
- Vink et al. (2001) —. 2001, A&A, 369, 574
- Woosley et al. (2002) Woosley, S. E., Heger, A., & Weaver, T. A. 2002, RvMP, 74, 1015
- Woosley & Janka (2005) Woosley, S. E., & Janka, H.-T. 2005, Nature Physics, 1, 147
- Zhang et al. (2008) Zhang, W., Woosley, S. E., & Heger, A. 2008, ApJ, 679, 639