Exploring the spectroscopic properties of relic radiogalaxies.††thanks: Based on observations made with the Italian Telescopio Nazionale Galileo operated on the island of La Palma by the Centro Galileo Galilei of INAF (Istituto Nazionale di Astrofisica) at the Spanish Observatorio del Roque del los Muchachos of the Instituto de Astrof´ısica de Canarias.
From an optical spectroscopic survey of 3CR radiogalaxies (RGs) with z0.3, we discovered three objects characterized by an extremely low level of gas excitation and a large deficit of line emission with respect to RGs of similar radio luminosity. We interpreted these objects as relic active galactic nuclei (AGN), i.e., sources observed after a large drop in their nuclear activity.
We here present new spectroscopic observations for these three galaxies and for a group of “candidate” relics. None of the candidates can be convincingly confirmed.
From the new data for the three relics, we estimate the density of the line-emitting gas. This enables us to explore the temporal evolution of the line ratios after the AGN “death”. The characteristic timescale is the light-crossing time of the emission line region, a few years, too short to correspond to a substantial population of relic RGs. Additional mechanisms of gas ionization, such as “relic shocks” from their past high power phase or stellar sources, should also be considered to account for the spectroscopic properties of the relic RGs.
Relic RGs appear to be a mixed bag of sources in different phases of evolution, including AGN recently ( years ago) quenched, galaxies that have been inactive for at least years, and objects caught during the transition from a powerful RG to a low power FR I source.
Key Words.:
galaxies: active, galaxies: jets, galaxies: elliptical and lenticular, cD, galaxies: nuclei1 Introduction
With the aim of gaining a better understanding of the properties of the central engines of RGs, we recently performed an optical spectroscopic survey of the 113 RGs belonging to the 3CR sample and with 0.3 (Spinrad et al. 1985), using the Telescopio Nazionale Galileo (Buttiglione et al. 2009, 2011). The 3CR sources show a bimodal distribution of excitation index, a spectroscopic indicator that measures the relative intensity of low- and high-excitation lines. This unveils the presence of two main sub-populations of radio-loud AGN, high and low excitation galaxies (HEGs and LEGs, respectively) (Buttiglione et al. 2010). We speculated that the differences between LEGs and HEGs are related to a different mode of accretion.
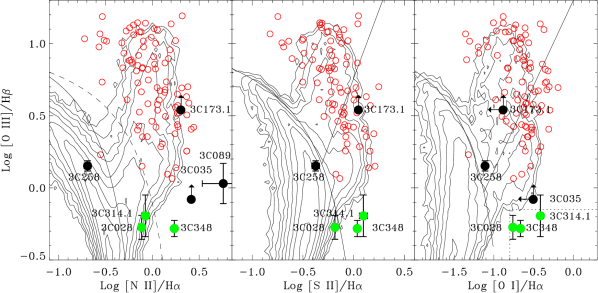
In addition to the two main classes, we find three galaxies (namely, 3C 028, 3C 314.1, and 3C 348) that stand out for their low [O III]/H ratio of 0.5. For this reason, in Buttiglione et al. (2009) we refer to this class as extremely low excitation galaxies (ELEGs). In the optical spectroscopic diagnostic diagrams, they are well separated from the rest of the 3CR sample and fall in a region scarcely populated by emission-line sources from the Sloan Digital Sky Survey (SDSS, Kewley et al. 2006). They are located, considering their [S II]/H and [O I]/H ratios, well within the AGN region. In the [O III]/H vs [N II]/H plane they straddle the line separating AGN from the so-called composite galaxies.
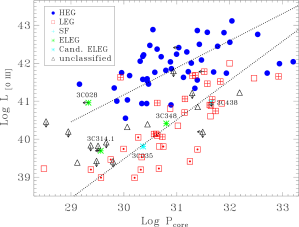
These objects also stand out for their radio properties: 3C 028 and 3C 314.1 do not show the presence of a radio core at a level of 0.2 and 1.0 mJy, respectively (see Giovannini et al. 1988 and references therein), while a 10 mJy radio core is detected in 3C 348 (Morganti et al. 1993). The core dominance, i.e., the ratio between the core (at 5 GHz) and total (at 178 MHz) radio emission, for these three sources is in the range Fcore/F compared to an average ratio for RGs of similar luminosity of Fcore/F. Similarly, they have a [O III] line luminosity that is lower by 1 - 2 orders of magnitude with respect to RGs at similar radio luminosity.
Based on these findings, we interpreted these objects as relic AGN in which nuclear activity is currently switched off (or strongly reduced with respect to its long term average level, Capetti et al. 2011). The considered quantities (radio core, emission-line luminosities and ratios, and total radio emission) respond to changes in the AGN activity level on different timescales. In fact, they originate from scales ranging from sub-parsec for the radio core, to kpc for the line emission produced in the narrow line region (NLR), and to hundreds of kpc for the extended radio emission.
Thus, a drop in the ionizing photon luminosity would result in recombination and cooling of the NLR, leading to a relatively low level of [O III] emission and to a decrease of [O III]/H ratio, while the extended radio emission remains essentially unchanged.
All relevant timescales of the spectral evolution of the NLR depend on the inverse of the gas density, but, from our survey spectra we unfortunately could not obtain an accurate estimate of this quantity. In fact, our spectrum of 3C 348 does not cover the [S II] doublet, while in 3C 028 the [S II]6731 line falls in a CCD defect. For 3C 314.1 we obtain a ratio [S II]6716/[S II]6731 = 1.6 0.3, which is only indicative of a low density () regime.
In the 3CR sample there are also seven galaxies that can be considered as “candidate relics”. They could not be classified spectroscopically (since at least one of the key emission-line could not be detected); however, since they show a low luminosity with respect to their total radio luminosity, we consider them as candidate relics.
Further spectroscopic data are then needed to i) improve the census of relic RGs in the 3CR sample and ii) measure their NLR gas density. The aim of this paper is to present new data for the relics and the candidate relics so as to further explore their spectroscopic properties and gain a better understanding of the nature of these sources. The paper is organized as follows: in Sect. 2 and 3 we present the new observations and provide the fluxes of the key emission-lines. In the following sections we explore the time evolution of line luminosities and ratios after a drop in the nuclear intensity (Sect. 4), the relation between relics and active galaxies (Sect. 5), and the alternative scenarios for the nature of the relic RGs (Sect. 6). A summary is given in Sect. 7.
Throughout, we use km s-1 Mpc-1, and .
| Name | z | Date | VHR-V | Red grism | |||
| n | Texp | n | Texp | ||||
| 3C 028 | 0.1953 | 29Jul09 | HRI | 3 | 800 | ||
| 3C 314.1 | 0.1197 | 14Apr09 | HRR | 4 | 800 | ||
| 3C 348 | 0.1540 | 03Mar09 | HRI | 4 | 800 | ||
| 3C 035 | 0.0670 | 23Sep09 | 2 | 750 | HRR | 2 | 750 |
| 3C 035 | 0.0670 | 23Sep09 | 2 750 (both with LRB) | ||||
| 3C 089 | 0.1386 | 02Feb09 | 2 | 800 | HRR | 2 | 800 |
| 3C 173.1 | 0.2921 | 15Mar09 | 2 | 800 | HRI | 3 | 800 |
| 3C 258 | 0.1650 | 29Mar09 | 2 | 800 | HRI | 3 | 800 |
| 3C 438 | 0.2900 | 21Jul09 | 2 | 800 | HRI | 3 | 800 |
Column description: (1) name of the source; (2) redshift; (3) night of observation; (4,5) number and exposure time (s) of the VHR-V spectra; (6) red grism used; (7,8) number and exposure time (s) of the red spectra.
2 Observations and data analysis
We obtained new spectroscopic observations for five of the candidate relics, while 3C 319 and 3C 052 could not be observed. With respect to the data presented in Buttiglione et al. (2009), we used longer exposure times and, in the H region, higher spectral resolution (corresponding to 400 , better matched with the intrinsic line widths) to improve the measurements of the weak emission-lines characteristic of these objects. We also obtained new red spectra for the three ELEGs in order to measure the intensity of the [S II] lines.
The spectra were taken with the Telescopio Nazionale Galileo (TNG), a 3.58 m telescope located on the Roque de los Muchachos in La Palma Canary Island (Spain). The observations were made with the DOLORES (Device Optimized for the LOw RESolution) spectrograph. The detector used is a 2100x2100 pixel back-illuminated E2V4240, with a pixel size of 0252. The observations were carried out in service mode between February and September 2009. The chosen long-slit width is 2 and was aligned along the radio-jet axis in order to increase the chance of detecting off-nuclear line emission, which, if present, is more likely to be extended in this direction (Baum & Heckman 1989).111For the 3CR spectroscopic survey, the slit was instead aligned with the parallactic angle in order to minimize light losses due to atmospheric dispersion.
For each target we generally took spectra with two grisms, VHR-V (4700-6700 Å) and the VHR-R (6200-7700 Å) or VHR-I (7400-8800 Å), depending on redshift, with a resolution of 750, 1250, and 1500 respectively. In the case of 3C 035, we instead used the lower resolution LRB grism (3500-7700 Å, R 250) but with an exposure time three times longer than that used during the survey. The selected grisms cover the H and H spectral regions in the observed frame. They include the most luminous emission-lines of the optical spectrum and, in particular, the key diagnostic lines H, [O III]4959,5007, [O I]6300,64, H, [N II]6548,84, [S II]6716,31. Exposures were divided into at least two sub-exposures, obtained moving the target along the slit. Table 1 provides the journal of observations.
The data analysis was performed as described in Buttiglione et al. (2009) where further details can be found. Summarizing, the spectra were bias subtracted and flat fielded. The spectra obtained in each sub-exposure were subtracted to remove the sky background. The residual background was subtracted measuring the average on each pixel along the dispersion direction in spatial regions immediately surrounding the source spectrum. The data were then wavelength calibrated and corrected for optical distortions. Finally, the spectra were extracted and summed over a region of 2 along the spatial direction and flux calibrated using spectrophotometric standard stars, observed immediately after each target.
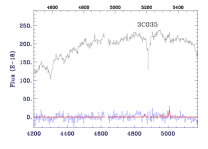
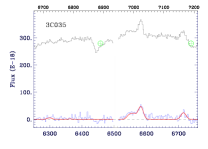
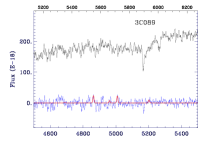
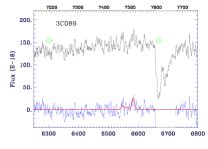
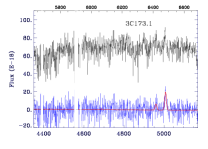
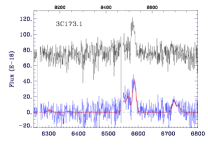
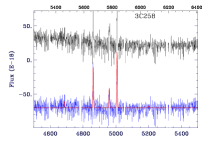
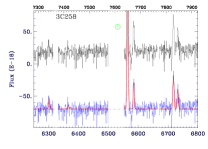
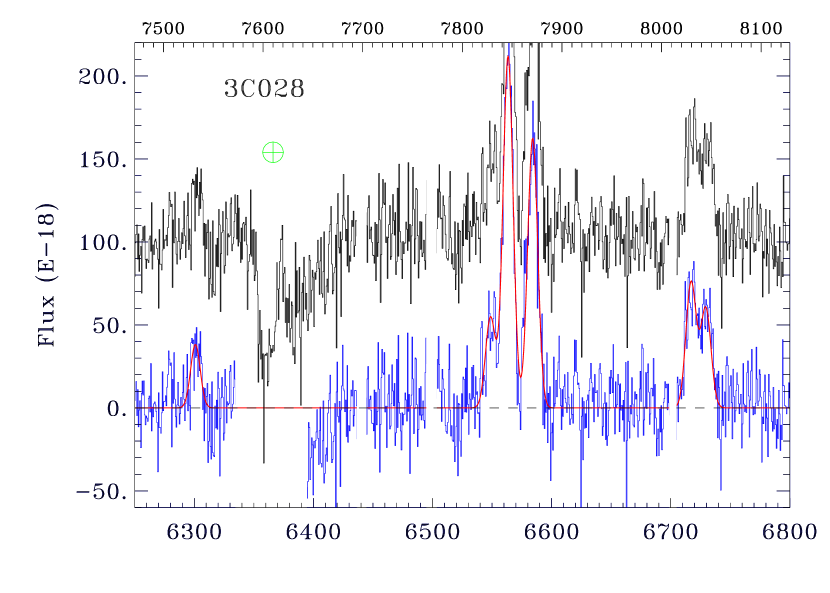
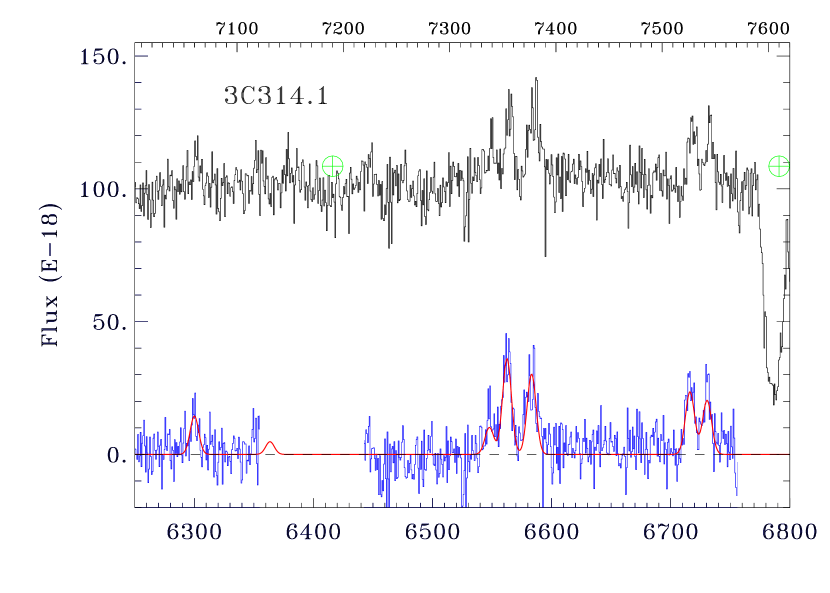
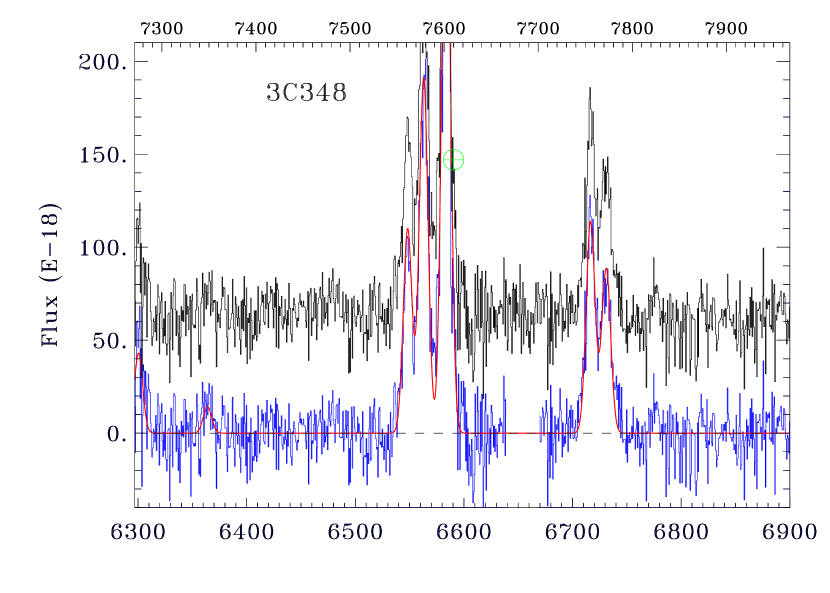
For all the observed targets Figures 1 and 2 show the resulting calibrated spectra, corrected for reddening due to the Galaxy (Burstein & Heiles 1982, 1984) taken from the NASA Extragalactic Database (NED) and using the extinction law of Cardelli et al. (1989), and transformed into rest frame wavelengths.
The contribution of stars to the nuclear spectra was subtracted using the best-fit single stellar population model taken from the Bruzual & Charlot (2003) library. We excluded from the fit the spectral regions corresponding to emission-lines, along with other regions affected by telluric absorption, cosmic rays, or other impurities. By using the
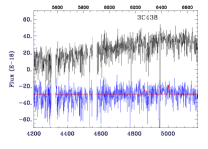
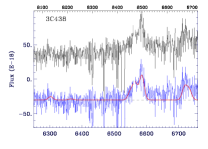
specfit package in IRAF, we then measured the line intensities adopting Gaussian profiles. We required the widths and the velocity to be the same for all the lines within each spectrum. The lines fluxes were free to vary, except for those with known fixed ratios.
Table 2 summarizes the intensities and the errors of the main emission-lines (de-reddened for Galactic absorption) relative to the intensity of the H. We placed upper limits at a 3 level to the undetected, but diagnostically important, emission-lines by measuring the noise level in the regions surrounding the expected positions of the lines and adopting as line width the instrumental resolution.
| Name | H | [O III]5007 | [O I]6300 | [N II]6584 | [S II]6716 | [S II]6731 |
|---|---|---|---|---|---|---|
| 3C 028 | 0.17 (26) | 0.77 (10) | 0.36( 6) | 0.29( 6) | ||
| 3C 314.1 | 0.38 (14) | 0.84 ( 6) | 0.67( 8) | 0.58( 9) | ||
| 3C 348 | 0.22 ( 9) | 1.72 ( 1) | 0.61( 3) | 0.47( 6) | ||
| 3C 035 | 0.47 | 0.39 (26) | 0.82 | 2.60 ( 8) | 1.38(14) | — |
| 3C 089 | 0.27 (31) | 0.28 (26) | 2.10 | 5.72 (13) | — | — |
| 3C 173.1 | 0.25 | 0.83 (11) | 0.47 | 2.02 ( 7) | 0.73(17) | 0.38 (29) |
| 3C 258 | 0.30( 6) | 0.42 ( 4) | 0.08 (20) | 0.20 ( 8) | 0.26( 6) | 0.16 (10) |
| 3C 438 | 0.38 | 0.54 | 0.19 (23) | 1.46 ( 6) | 0.78 ( 8) | 0.60 ( 8) |
Column description: (1) source name; (2 through 7) de-reddened flux ratios with respect to H. The values in parentheses report the errors (in percentage) of each line.
3 Results
3.1 Comments on the individual relic candidates
3C 035: The H line remains undetected in the new spectrum. With respect to Buttiglione et al. (2010) the lower limit to the [O III]/H ratio increases to log [O III]/H (from a previous limit of ), slightly higher than that measured in the three ELEGs, but still lower than any other 3CR source.
3C 089: While from the survey data we were only able to detect the [N II] and H lines, we can now also measure the fluxes of H and [O III], with a ratio of log [O III]/H = 0.03. This places 3C 089 in the first spectroscopic diagram (left-hand panel in Fig. 3) toward the bottom of the locus populated by the 3CR RGs, and well separated from the ELEGs.
3C 173.1: The upper limit to its H flux corresponds to a lower limit of log [O III]/H 0.54, sufficient to establish that this source is not an ELEG.
3C 258: The line ratios are characteristic of a star-forming galaxy. Indeed, in two out of three diagnostic diagrams (see Fig. 3), 3C 258 is located below the solid lines separating AGN from star forming galaxies while in the third diagram, ([O I]/H vs. [O III]/H) is only marginally above the boundary. This is the second 3CR source (at z 0.3), with 3C 198, that shows these spectroscopic properties. 3C 198 is a large classical double, while 3C 258 is a compact steep spectrum (CSS) source with a double morphology, barely resolved in MERLIN maps (Akujor et al. 1991). The host morphology is peculiar (Floyd et al. 2008) because it is very compact for its redshift222There is some controversy on the redshift of 3C 258. Our data confirm the value of 0.165 of Smith et al. (1976). and has an arc-like structure toward SE that is possibly the sign of a recent merger.
3C 438: We still cannot detect the and the H lines. No classification is possible for this source.
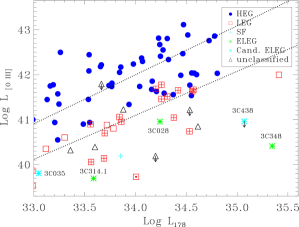
In Fig. 3 we show the locations of the three ELEGs and candidate relics in the emission-lines diagnostic diagrams, compared to the rest of the 3CR sample with z0.3 and superimposed on the contours representing the density of the SDSS emission-line sources (Kewley et al. 2006). The newly measured line ratios for three of the candidate relics locate them outside the region characteristics of ELEG (3C 089 is a LEG, 3C 173.1 could be either a LEG or a HEG, and 3C 258 is star-forming galaxy). They are insufficient to establish the nature of the remaining two, 3C 035 and 3C 438, which we still consider as candidate ELEGs. Nonetheless, they are located in the same region of the [O III] luminosity - radio core power diagram (Fig. 4, left-hand panel) as the LEGs. Their core dominance is also similar to the values reported above for the 3CR sources (Fcore/F and for 3C 035 and 3C438, respectively). However, they both show a deficit in line emission with respect to the total radio luminosity, which is particularly strong (by a factor of 10) in the case of 3C 438.
3.2 Gas density measurements in the ELEGs
The new result for the three galaxies already classified as ELEG is an accurate measurement of the ratio between the two lines forming the [S II] doublet, from which it is now possible to measure the gas density. Following Osterbrock (1989), we estimated the gas electron density by using the ratio [S II]6716/[S II]6731. The resulting values are cm-3 for 3C 028, cm-3 for 3C 314.1, and cm-3 for 3C 348. We assumed a temperature of 104 K, but the derived density depends only weakly on temperature, as .
As a comparison we consider the gas density in the rest of the 3CR sample. There are 73 sources in Buttiglione et al. (2009, 2011) where the [S II] line ratio can be measured with an accuracy better than 10%. The median value is 1.15, corresponding to cm-3, and 60% of them have ( cm-3). Thus the gas density in relics is not strikingly different from the rest of the sample.
4 Time evolution of line luminosities and ratios
After measuring the gas density for the three relics, we used the analysis of the time evolution of a photoionized cloud following an instantaneous drop of the ionizing photon field described by Binette & Robinson (1987). The decay time (the time after which the line intensity decreases by a factor 1/) of the [O III] line can now be estimated, resulting in years, where is the gas electron density in units of cm-3. The new density measurements set this parameter to 1.6 - 3 for the three ELEGs. The decay time of the H line is instead years.
The actual NLR structure is more complex than the single cloud of constant density used in the models by Binette & Robinson, because it is formed by clouds of different densities distributed at different distances over the central regions of the galaxy. The information about the decrease in the ionizing luminosity of the AGN reaches these clouds at different times depending on their distance from the nucleus. As long as the time elapsed since the AGN “switched off” is less than the NLR light-crossing time, the NLR is divided into two regions, the outer one with a spectrum still characteristic of a galaxy in an active state and an inner portion with a “fossil” spectrum. The thickness of the intermediate layer, given by , is only 2 - 4 pc, much smaller than both the NLR size and the region covered by the slit used for our observations, which is 2 - 3 kpc.
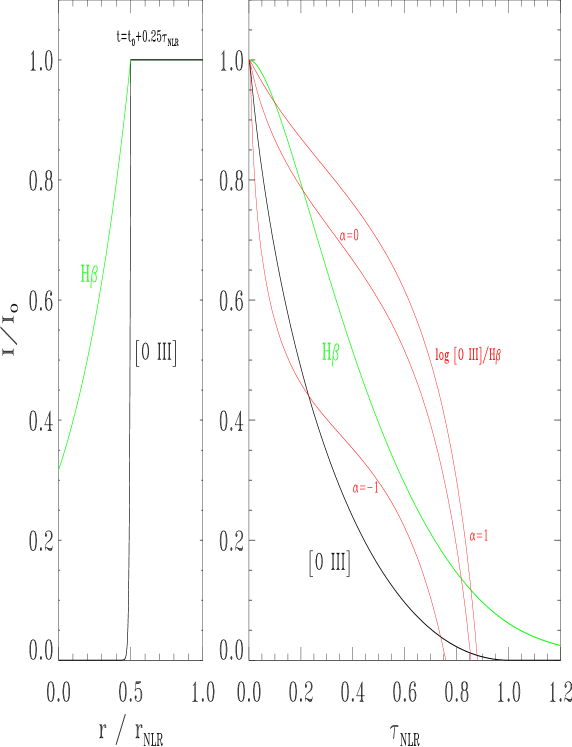
This implies that the NLR temporal evolution is dominated by geometric effects. Indeed the observed spectrum is the superposition of the “active” and the “fossil” regions, while the contribution of the intermediate layer is negligible. The observed line ratios are then determined by the relative amount of line emission in the two regions. This depends on the distribution of ionized gas within the NLR. A simple toy model, in which the line emissivity drops as and extends to a radius kpc, can be used to follow the NLR evolution. In this case, the NLR can be thought of as the sum of shells of equal thickness, each producing the same amount of line emission. The emissivity in each shell drops rapidly following the change in the flux of ionizing photons and the total flux declines (see Fig. 5). The H also decreases, but due to its longer decay time, at a slower rate. However, from the point of view of a distant observer, each point (r, ) in the NLR only responds to the drop in ionizing flux after a delay , where is the polar angle measured from the line of sight. The boundary between the “active” and “relic” regions is therefore a parabolic isodelay surface with its symmetry axis along the line of sight and its focus at the AGN (e.g., Bahcall et al. 1972).
The resulting /H ratio, which we initially set to 10, also lowers and is reduced to 0.5 (the value observed in the ELEGs) after a time interval only slightly smaller than the NLR light travel time, . At this epoch, the H intensity is reduced by a factor of 10. These are rather general results and depend only slightly on the adopted gas density or emissivity law with radius (see Fig. 5). The conclusion is that the typical timescale of the evolution is the light travel time across the NLR and not the decay time of the various lines.
For this analysis we assumed an instantaneous drop of the nuclear source. However, as discussed by Binette & Robinson, effectively the same results are obtained if the decline occurs over less than years.
5 Relics versus active radiogalaxies
Let us now assume that relic RGs are the result of a sudden and complete switch-off of the nuclear activity. In this case the fraction of relics (with respect to the galaxies in the active phase) is given by the ratio between the duration of the transition phase and the lifetime of RGs, . As reported in Capetti et al. (2011) the fraction of relics can be estimated once all RGs in a complete sample are properly spectroscopically classified, a situation that is (almost) met in the 3CR sample with z0.3. Considering the range of radio luminosity where relic RGs are observed, Log L178 = 33.5 – 35.5 , there are 58 objects in the 3CR sample up to a redshift of 0.3: 35 HEGs, 16 LEGs, two star-forming galaxies, and three relics. The last two objects are the remaining candidate relics (3C 035 and 3C 438), which are still not classified after the analysis of new observations presented in Sect. 3. The fraction of relics is then at least 3/58 (5%) and can increase to 8%, depending on the nature of the two unclassified sources. A further uncertainty is related to the relic progenitors, i.e., depending on which spectroscopic class can evolve into a relic: HEG, LEG, or both. However, this can only increase the relic fraction.
As discussed in the previous section, the duration of the transition phase is a small fraction of the light travel time across the NLR (or, more precisely, of the portion of the NLR covered by our spectra, 2 - 3 kpc), i.e., a few thousand years. This line of reasoning would imply a lifetime of years for RGs. This value is unacceptable from several points of view. The most straightforward is the contrast with the median size of the FR II RGs in our sample, 250 kpc, which exceeds the maximum size attainable in such a timescale. A conservative upper limit to the fraction of relics can be estimated as . Thus, the transition phase is too short to correspond to a substantial population of relic RGs.
Nonetheless, there are at least two alternative scenarios, always within the framework in which the NLR evolution is governed purely by photoionization from the nuclear source. The first one is that the phase of low nuclear activity is transient. In this case the relative number of active/relic galaxies should be taken as an estimate of the ratio of the number of objects in high/low states.
In the second one, the relic RGs are simply objects in which the NLR ionization level is intrinsically very low, representing the tail of the broad distribution of the NLR ionization parameter. Photoionization models indicate that the observed /H ratio can indeed be realized (see, e.g., Kewley et al. 2006). However, as noted above, the relic RGs fall in regions of the diagnostic diagrams scarcely populated by SDSS emission-line galaxies. Considering the [O I]/H vs. /H plane, the “relic neighbors”, i.e, the SDSS sources falling in the region bounded by the dotted lines in Fig. 3 (right panel), are only 0.06% of the SDSS emission-line galaxies and 0.3% of the 12,000 galaxies falling in the AGN region. Within the AGN population, the line ratios observed in the relics are very rarely achieved and, together with the peculiar radio properties, appear instead to be the signposts of their distinctive evolutionary state.
6 Origin of line emission in relics
The results presented above argue against the scenario in which the population of relic RGs correspond to objects that underwent a drop of nuclear source intensity (or a transition from a high to a low activity level). However, this possibility cannot be excluded when considering individual sources. Indeed, the properties of 3C 028 fit nicely with this scheme: it has a classical FR II morphology, with well-defined twin jets linking the host to a pair of compact hot spots, only lacking a radio core (Feretti et al. 1984). No continuum nuclear emission is seen in the optical, infrared or X-ray bands (Chiaberge et al. 1999; Baldi et al. 2010; Balmaverde et al. 2006). This appears to be an indication that the drop in nuclear activity occurred very recently, which is confirmed by its emission line luminosities: is still within the range of active RG, while is only reduced by a factor of 10 (see Fig. 4). This is what is expected if the elapsed time since the change in the activity level is larger than the radio-core cooling time and of the same order of . In this source the might be still dominated by fossil emission.
However, this interpretation fails in the case of 3C 314.1. This source has a relaxed double morphology (Leahy & Perley 1991), which lacks of hot spots. This is an indication that the switch-off of the jets in this galaxy occurred at least years ago, which is the light travel time to the edge of its 250 kpc radio source, a time interval much larger than the decay time of the emission-lines considered, even including the geometric effects. No significant fossil-line emission is expected after such a long time interval. Furthermore (unlike the case of 3C 348 which we will discuss in more detail later) no nuclear emission is observed in 3C 314.1 in the optical, infrared or radio bands.
These results suggest that in this source the line emission originates from other emission mechanisms, which are qunrelated to nuclear photoionization. We envisage two possibilities. In the first, the ionizing photon field is produced by an evolved stellar population. Stasińska et al. (2008) show that pAGB stars produce emission-lines whose ratios can mimic those observed in active galaxies, including the low /H ratios measured in relics. The analysis of a large sample of SDSS spectra (Capetti & Baldi 2011; Capetti 2011) shows that in this case the lines are closely linked to the stellar continuum, with a equivalent width , EW(), strongly clustered around 0.75 Å. While for 3C 028 and 3C 348 the EW() value is substantially larger (5 Å and 8 Å, respectively), in 3C 314.1 we measure EW() 1 Å, which is compatible with a stellar origin.
Radiative shocks, naturally expected in RGs, are also able to produce emission-lines with ratios similar to those observed in the relics (Allen et al. 2008). The crossing time of such “relic shocks” across the NLR is sufficiently long ( years for a velocity of 100 ) to remain energetically important for a long time after the drop in nuclear activity and the consequent end of the input of energy from the jets.
The properties of 3C 348 suggest that this object underwent a transition from a powerful RG to a lower power source. Gizani & Leahy (2003) proposed that 3C 348 may be a restarted source based on its peculiar radio properties: two jets emerge from the core and propagate within a double-lobed radio structure which is characterized by a very steep spectral index (1.2) and lacks any compact hot spots. Both jets show arc-like features, an indication of episodic activity. The total radio luminosity at 178 MHz is L , the second most luminous source in the z0.3 3CR sample. The multiwavelength nuclear properties of this source show instead a strong similarity with those of FR I. The representative point of 3C 348 falls onto the correlation defined by FR I in the plane comparing their optical and radio emission (Chiaberge et al. 1999). Also its luminosity is similar to those of FR I at the same level of core power (see Fig. 4). Although not detected in Chandra images, the upper limit to its nuclear X-ray luminosity is consistent with the link between radio and X-ray luminosities found for FR I by Balmaverde & Capetti (2006). These results suggest that the central engine of 3C 348 is now in a state characteristic of FR I. The current activity level might be a low state phase between multiple outbursts, as its radio morphology suggests. The only difference between 3C 348 and the FR Is (leaving aside the radio morphology and luminosity) is the lower [O III]/H ratio. The H excess cannot be explained as a relic of the previous phase of higher activity (given the 100 kpc size of its FR I radio structure) but possibly to shocks, similar to the case of 3C 314.1.
7 Summary
We studied the properties of the ELEGs, the new spectroscopic class of radio-loud AGN characterized by an extremely low /H ratio (0.5). They also show a deficit of emission and of radio-core power with respect to RGs of similar radio luminosity. We interpret these objects as relic AGN, i.e., galaxies that underwent a large drop in nuclear activity. In the 3CR sample there are seven additional galaxies with a low luminosity for their radio power that we identified as candidate relics, but which were hitherto not classified spectroscopically.
We presented deeper observations for five candidate relics. The newly measured line ratios locate three galaxies in the optical spectroscopic diagnostic diagrams outside the region characteristic of ELEGs, while they are insufficient to establish the nature of the remaining two. Therefore, we cannot confirm any of the candidates as new ELEGs.
We also obtained further observations of the confirmed three ELEGs in order to estimate their NLR gas density, a measurement that was not possible from the survey spectra. We obtained fairly accurate measurements in the range cm-3, enabling us to estimate the emission-lines decay time which results in only 6-12 years for the .
We then explored the spectral evolution after the AGN “death”. As viewed by a distant observer, the NLR can be considered divided into two regions bounded by a parabolic iso-delay surface that corresponds to the active and fossil states of the AGN. The thickness of the intermediate layer is much smaller than the NLR, being only 2-4 pc. Thus, the NLR temporal evolution is dominated by geometric effects. Indeed, the observed spectrum is the superposition of the active and fossil regions, while the contribution of the intermediate layer is negligible. The observed line ratios are set by the relative amount of line emission in the two regions. Thus, the characteristic timescale is the light travel time across the NLR, years, and not the line-decay times.
The expected number of objects caught in the transition phase should then be extremely small (of the order of ), in contrast to the fraction of ELEGs of a few percent found in the 3CR sample. Furthermore, in two ELEGs the large-scale radio structure already shows substantial changes with respect to the classical FR II on a scale of hundreds of kpc, indicating that the drop in the activity level occurred at least years ago. No fossil line emission is expected in these sources. Thus our results confirm that while relic RGs can be associated with AGN that experienced a large drop in activity, the presence of additional sources of ionization must be considered to understand their spectroscopic properties.
Most likely, the class of relic RGs is composed of a mixed bag of objects in different stages of their evolution. 3C 028 has a classical FR II morphology, with well defined jets and compact hot spots, but lacking any nuclear emission. The deficit of line emission with respect to RGs of similar radio power is modest, less than a factor of 10 even in . This suggests that the drop in nuclear activity occurred very recently ( years ago) and that the emission-lines are still dominated by fossil emission.
In 3C 314.1 no nuclear emission is seen in the optical or radio bands. The lack of hot spots in its radio source (extended over 250 kpc) indicates that the AGN switch-off occurred at least years ago. No fossil line emission can be present. We suggest two alternatives in which the lines are powered by i) shocks, whose crossing time of the NLR is sufficiently long, years, to be still active even in these late phases of evolution, or ii) the ionizing continuum of an evolved stellar population, an interpretation supported by the low EW of the emission-lines.
Finally, 3C 348 appears to be a transient from a powerful RG to a low luminosity FR I radio source. Considering the size of the FR I radio structure embedded in the radio relic (100 kpc), the transition must have occurred at least years ago. 3C 348 shares the nuclear properties of FR Is from the point of view of the emission lines and the radio and optical continuum. The H excess, which causes the anomalous low value of the /H ratio, can be ascribed to relic shocks from its past, high-power phase.
Acknowledgements.
We wish to honor the memory of our great friend and colleague David Axon.References
- Akujor et al. (1991) Akujor, C. E., Spencer, R. E., Zhang, F. J., et al. 1991, MNRAS, 250, 215
- Allen et al. (2008) Allen, M. G., Groves, B. A., Dopita, M. A., Sutherland, R. S., & Kewley, L. J. 2008, ApJS, 178, 20
- Bahcall et al. (1972) Bahcall, J. N., Kozlovsky, B.-Z., & Salpeter, E. E. 1972, ApJ, 171, 467
- Baldi et al. (2010) Baldi, R. D., Chiaberge, M., Capetti, A., et al. 2010, ApJ, 725, 2426
- Balmaverde & Capetti (2006) Balmaverde, B. & Capetti, A. 2006, A&A, 447, 97
- Balmaverde et al. (2006) Balmaverde, B., Capetti, A., & Grandi, P. 2006, A&A, 451, 35
- Baum & Heckman (1989) Baum, S. A. & Heckman, T. 1989, ApJ, 336, 702
- Binette & Robinson (1987) Binette, L. & Robinson, A. 1987, A&A, 177, 11
- Bruzual & Charlot (2003) Bruzual, G. & Charlot, S. 2003, MNRAS, 344, 1000
- Burstein & Heiles (1982) Burstein, D. & Heiles, C. 1982, AJ, 87, 1165
- Burstein & Heiles (1984) Burstein, D. & Heiles, C. 1984, ApJS, 54, 33
- Buttiglione et al. (2009) Buttiglione, S., Capetti, A., Celotti, A., et al. 2009, A&A, 495, 1033
- Buttiglione et al. (2010) Buttiglione, S., Capetti, A., Celotti, A., et al. 2010, A&A, 509, A6
- Buttiglione et al. (2011) Buttiglione, S., Capetti, A., Celotti, A., et al. 2011, A&A, 525, A28+
- Capetti (2011) Capetti, A. 2011, A&A, 535, A28
- Capetti & Baldi (2011) Capetti, A. & Baldi, R. D. 2011, A&A, 529, A126+
- Capetti et al. (2011) Capetti, A., Buttiglione, S., Axon, D. J., et al. 2011, A&A, 527, L2+
- Cardelli et al. (1989) Cardelli, J. A., Clayton, G. C., & Mathis, J. S. 1989, ApJ, 345, 245
- Chiaberge et al. (1999) Chiaberge, M., Capetti, A., & Celotti, A. 1999, A&A, 349, 77
- Feretti et al. (1984) Feretti, L., Gioia, I. M., Giovannini, G., Gregorini, L., & Padrielli, L. 1984, A&A, 139, 50
- Floyd et al. (2008) Floyd, D. J. E., Axon, D., Baum, S., et al. 2008, ApJS, 177, 148
- Giovannini et al. (1988) Giovannini, G., Feretti, L., Gregorini, L., & Parma, P. 1988, A&A, 199, 73
- Gizani & Leahy (2003) Gizani, N. A. B. & Leahy, J. P. 2003, MNRAS, 342, 399
- Kewley et al. (2006) Kewley, L. J., Groves, B., Kauffmann, G., & Heckman, T. 2006, MNRAS, 372, 961
- Leahy & Perley (1991) Leahy, J. P. & Perley, R. A. 1991, AJ, 102, 537
- Morganti et al. (1993) Morganti, R., Killeen, N. E. B., & Tadhunter, C. N. 1993, MNRAS, 263, 1023
- Osterbrock (1989) Osterbrock, D. E. 1989, Astrophysics of Gaseous Nebulae and Active Galactic Nuclei (Mill Valley: Univ. Sci. Books)
- Smith et al. (1976) Smith, H. E., Smith, E. O., & Spinrad, H. 1976, PASP, 88, 621
- Spinrad et al. (1985) Spinrad, H., Marr, J., Aguilar, L., & Djorgovski, S. 1985, PASP, 97, 932
- Stasińska et al. (2008) Stasińska, G., Vale Asari, N., Cid Fernandes, R., et al. 2008, MNRAS, 391, L29