On the Evolution of the Bi-Modal Distribution of Galaxies in the Plane of Specific Star Formation Rate versus Stellar Mass
Abstract
We have compared the observed distribution of galaxies in the plane of specific star formation rate versus stellar mass with the predictions of the Garching semi-analytic model at redshifts 0, 1 and 2. The goal is to test whether the implementation of radio mode AGN feedback, which is responsible for terminating the formation of stars in high mass galaxies, provides an adequate match to current high-redshift observations. The fraction of quenched galaxies as a function of stellar mass in the models is in good agreement with data at z=0 and z=1. By z=2, there are too few quenched galaxies with low stellar masses in the models. At z=2, the population of galaxies with no ongoing star formation is clearly separated from the ‘main sequence’ of star-forming galaxies in the data. This is not found in the models, because z=2 galaxies with stellar masses less than are predicted to host black holes with relatively low masses (less than ). The current implementation of radio mode feedback from such black holes reduces the cooling rates from the surrounding halo, but does not generate sufficient energy to stop star formation entirely. We suggest that the models may be brought into better agreement with the data if black hole growth is triggered by disc instabilities in addition to major mergers, and if feedback mechanisms associated with the formation of galactic bulges act to quench star formation in galaxies.
keywords:
galaxies: evolution – galaxies: active – galaxies: high-redshift.1 Introduction
Deep galaxy surveys have revealed that in star-forming galaxies, star formation rate is correlated with stellar mass, giving rise to a relation referred to as the ‘main sequence of star-forming galaxies’ (Daddi et al. (2007); Noeske et al. (2007)). This relation displays time evolution – galaxies of fixed mass form stars at progressively lower rates at later times. The scatter around the relation is quite small ( 0.3 dex) and exhibits little redshift dependence. The picture which emerges from this is that the star formation histories of most star-forming galaxies have been relatively quiescent. Longer periods of continuous star formation may be interspersed with short periods of elevated star formation (starbursts) resulting from interactions or mergers (Kauffmann et al. (2006)). The bursts are thought to contribute to the scatter around the main sequence.
In contrast, massive galaxies that are ‘red and dead’ occupy a different, but well-defined region of the SFR - mass plane. These objects can be understood from the point of view of their histories: they are likely the remnants of major mergers between star forming galaxies. Such mergers destroy disks and produce bulges, and lead to starbursts if the progenitors are gas-rich. The merger may drive accretion onto a central supermassive black hole, thus triggering an active galactic nucleus (AGN). The effect of the consumption of gas into stars during the merger and feedback from supernovae and AGN ‘quench’ these massive systems, shutting off their star formation and thus reddening their colours.
In this paper, we compare the distribution of galaxies in the specific star formation rate - stellar mass plane from three different observational galaxy catalogues with predictions from the Guo et al. (2011) semi-analytic model of galaxy formation and evolution. We do this for three redshift intervals to analyse the evolution of this relation and to understand the key processes which lead to it. Although satellite galaxies in clusters may have their star formation inhibited due to the removal of their gas reservoir by ram-pressure stripping or tidal interactions with their neighbours (called satellite quenching), this process pertains to a relatively small fraction of the more massive galaxies. In the semi-analytic models, the main driver of the quenching of very massive galaxies is AGN ‘radio mode’ feedback (Croton et al. (2006), hereafter C06). This mechanism injects energy into the gas surrounding the galaxy, preventing it from cooling, condensing onto the galaxy and subsequently forming stars. The efficiency of this type of feedback is dependent on the amount of gas in a hot phase within the halo (this is higher for more massive haloes), as well as on the mass of the accreting black hole, which in turn depends on the host galaxy’s merger history. Because both haloes and black holes form hierarchically through mergers in the models, it is therefore important to check that sufficient massive haloes and black holes have had time to grow and produce the observed proportion of massive, quiescent galaxies at high redshifts (e.g. McCarthy et al. (2004); Toft et al. (2009); Williams et al. (2010)). Such a comparison can therefore be a useful tool to probe this aspect of the model.
2 Data
2.1 Observational Datasets
The galaxy samples in this work were drawn from several surveys and three redshift bins were considered. The shallowest sample, with galaxies in a redshift interval of 0.025 z 0.05 and referred throughout as z 0 , was drawn from data as used in Wang et al. (2011) - a catalogue constructed by matching galaxies with stellar masses greater than from the sixth data release (DR6) of the Sloan Digital Sky Survey (SDSS) (York et al. (2000)) with the fourth data release of the GALEX survey (Martin et al. (2005)).
The deeper samples were based on those used by Wuyts et al. (2011), hereafter referred to as W11. They were drawn from the GOODS-S and UDS catalogues, as described in their paper. Each of these two catalogues contained galaxies separated in two bins of redshift, namely 0.5 z 1.5 and 1.5 z 2.5. They are referred throughout as z 1 and z 2, respectively. The UDS catalogue was based on data from several different surveys (Cosmic Assembly Near-infrared Deep Extragalactic Legacy Survey (CANDELS), Grogin et al. (2011); Koekemoer et al. (2011); Spitzer Extended Deep Survey (SEDS), PI: G. Fazio; Ultra Deep Survey (UDS), PI: O. Almaini; SpUDS - a Spitzer public legacy program on the UDS, PI: J. Dunlop) and ground-based data, on an area of 200 , which constituted the UDS area covered by CANDELS (see Galametz et al. (in prep.) for details on the photometric catalogue and W11 for the derived stellar population properties). The GOODS-S catalogue was constructed in a similar way, on an area from the GOODS-South field (Great Observatories Origins Deep Survey, a 148 area centred on the Chandra Deep Field South) covered by CANDELS-Wide and CANDELS-Deep.
Where possible, W11 estimated the star formation rates using combined ultraviolet and mid-infrared or far-infrared photometry. For objects lacking an infrared detection, they used stellar population synthesis model fits to the UV-to-8 m spectral energy distributions to estimate parameters such as stellar masses and SFRs. We refer the reader to their paper for further details. W11 constructed SFR - stellar mass planes and studied the variation of structural properties of galaxies across the plane, finding for example a clear separation between the two galaxy populations in terms of Sersic index.
In our work, we make use of the W11 data with a cut in stellar mass at , above which the two deep samples are complete. The number of galaxies in each of the redshift bins is shown in Table 1.
| Redshift | SDSS | UDS | GOODS-S |
|---|---|---|---|
| 0 | 10456 | - | - |
| 1 | - | 975/8033 | 748/5467 |
| 2 | - | 1000/6649 | 554/3763 |
2.2 Semi-analytic model
The Garching semi-analytic model simulates galaxies starting from the merger trees of dark matter haloes of the Millennium Run (Springel et al. (2005)). The latter is a cosmological, N-body, dark matter only simulation with particles in a box 500 Mpc/h in size. The cosmological parameters used were based on a combined analysis of the 2dFGRS (Colless et al. (2001)) and the first-year release WMAP data (Spergel et al. (2003)) and are as follows: = 0.25, = 0.045, = 0.75, = 0.9, n = 1 and = 73 . The semi-analytic model populates the haloes with galaxies, which evolve according to the merger histories of their parent haloes as well as according to analytic ‘recipes’ governing the baryonic physics. These include gas cooling, star formation, supernova and AGN feedback, chemical enrichment, and the effects of galaxy interactions on star formation and bulge formation.
The version of the model used in this analysis is that of Guo et al. (2011). The galaxy parameters used in this work were retrieved from the publicly available Millennium database (Lemson & Virgo Consortium (2006)). Two outputs of this model are available on the database: one associated with the Millennium simulation (described above) and a second with Millennium II (Boylan-Kolchin et al. (2009)), which is a high-resolution version of the former with the same cosmological parameters and particle number but within a simulation box 100 Mpc/h in size. Here we used the outputs resulting from the Millennium merger trees, due to the fact that this simulation contains a larger number of massive galaxies. In order to assure good resolution towards the lower mass end, a cut was made on the number of dark matter particles per halo, i.e. Np 300. This did not affect any results for galaxies with stellar masses greater than . Catalogues from three simulation snapshots closest in redshift to the three observational datasets were retrieved, corresponding to z=0, 0.99 and 2.07.
3 Analysis and Results
3.1 sSFR - Mass planes
We first converted the log(SFR) - log() density plots in W11 into log(sSFR) - log() density plots, i.e. star formation rate per unit mass or specific star formation rate (sSFR) as a function of stellar mass. The specific star formation rate is a measure of the time taken by a galaxy to form its stellar mass at its current star formation rate. This quantity allows for a clearer separation between the star-forming and quiescent populations, as will be seen later.
Next, all mass bins were normalised to unity, using the equation
| (1) |
where represents the count at position , with and sSFR. is the normalised count, the quantity plotted in Fig. 1.
This allowed for an easier comparison between the data and the model, removing the need to scale by the
volume of the survey, which, in some cases was unknown. It also allows us to visualize
the bi-modality of the population on the density plots more easily (see Kauffmann
et al. (2003)).
We note that model galaxies with sSFR=0 were randomly re-assigned a value
corresponding to the locus of the quenched population in the data.
This was done in order to account for the fact that the observations always have a
lower threshold in sSFR, set by the range of models used in the SED fitting.
The effect of this was negligible at high redshift but more important at z 0,
where AGN feedback completely halts star formation in a significant number of galaxies in the simulations.
Fig. 1 shows that the semi-analytic model is in qualitative agreement with the data in that there is a clear main sequence of star forming galaxies and another separated population of massive, red and dead galaxies. A more detailed comparison reveals that at high redshifts the main sequence appears to lie at lower sSFR compared with the data. This discrepancy is well-documented in the literature (e.g. Damen et al. (2009)). Further, in the models the quenched peak appears to be located very close to the main star forming sequence at early times and then travels down in time towards lower star formation rates. In the observations, the quenched galaxies are well separated from the star-forming ones even at z 2.
3.2 Quenched fractions as functions of stellar mass
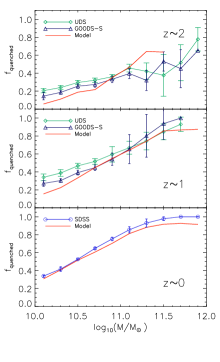
In order to quantify the evolution of the quenched population with redshift, the sSFR-M⋆ plane was divided into slices of constant stellar mass and histograms of the sSFR distribution at fixed mass were constructed (Fig. 2). These histograms can easily be decomposed into two components: one peak corresponding to the star-forming galaxies, and the remainder corresponding to the quenched population. The objective of this exercise is to compute the fraction of the population in the quenched state, per stellar mass bin, and ascertain whether the model fraction matches the observations, and whether model and observations evolve the same way as a function of redshift.
A separation between the two peaks in sSFR was made visually and a Gaussian was fitted to the star-forming peak; the Gaussian was subtracted from the total distribution (which was by construction normalised to unity), leaving the remainder to be interpreted as the quenched fraction. Figure 3 shows the quenched fraction for both data and model at various stellar masses and redshifts. The error bars on the data were computed by bootstrap-resampling the original distribution (500 bootstrap subsets were used). Overall, the model agrees qualitatively with the observations. At redshift 0, the model slightly underpredicts the quenched fraction at high masses whereas at higher redshift, the model underpredicts the fraction at low masses and overpredicts it at high masses. This, taken in conjunction with the information in Figure 2, leads to conclude that the bi-modality persists in the data over a broad mass range, whereas the model only tends to be bi-modal over a mass interval which narrows progressively with increasing redshift (at 2 the transition is quite sharp at ). Outside of this interval, a single mode is preferred.
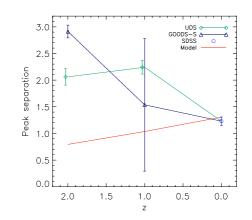
3.3 Peak separation and its evolution
Although the quenched fractions indicate a qualitative similarity between the model and the observations, they are not sensitive to the exact shapes of the distributions, or the separation between the star-forming main sequence and quiescent peaks, which is visibly different between model and data in Figure 1 at higher redshifts. The evolution of the mean peak separation (averaged over all stellar masses) is shown in Fig. 4. It is noteworthy that the general trend in the data is opposite to that in the model. In the observations, the star-forming main sequence and the quenched population are well separated at high redshift and gradually approach each other with time. This approach is mainly due to the decrease in star formation rate on the main sequence at lower redshifts. In the model, there is a slight increase in the separation of the peaks with time. This is caused by the fact that residual star formation rates in the quenched population are larger at high redshifts than at low redshifts.
4 Discussion and Conclusions
We have compared the distribution of galaxies in the plane of specific star formation rate versus stellar mass with the predictions of the Garching semi-analytic model, for three redshift bins. Our main findings are listed below.
i.) There is qualitative agreement between models and data in that there is a well-separated main sequence of star-forming galaxies at low stellar masses and a quenched population at higher masses at all three redshifts in the semi-analytic models.
ii.) The fraction of quenched galaxies as a function of stellar mass in the models is in good agreement with data at z=0. At higher redshifts, there are too few quenched galaxies with low stellar masses in the models.
iii.) The evolution in the separation between the star-forming and quenched populations is not reproduced by the models. In the data, the separation decreases towards low redshift, whereas the the models it remains roughly constant.
Perusal of Figure 1 shows that in the observations, the quenched population gains more and more members as time progresses, but it remains clearly separated from the star forming population even at early times. Moreover, it is clear that in the observations, the quenched population extends across the entire stellar mass range from to at all redshifts (even though the quenched fraction increases significantly towards higher masses). In contrast to this, in the models the quenched population becomes progressively more separated from the star-forming population towards lower redshifts. In addition, the quenched population of high redshift galaxies in the models is confined to galaxies with higher stellar masses than at low redshifts.
Let us now consider the implementation of the AGN ‘radio-mode’ feedback mechanism in the models. This type of black hole activity results from accretion of hot gas from a static halo around the host galaxy, described in detail by C06:
| (2) |
where is the mass of the black hole, is the virial velocity of the parent dark matter halo (or subhalo) and is the fraction of the total halo/subhalo mass in the form of hot gas. Here is a free parameter which controls the efficiency of accretion, and it is taken to be 1.5 . The black hole luminosity is given by:
| (3) |
where = 0.1 is the efficiency with which mass produces energy near the event horizon. The effect of this accretion is assumed to be injection of heat into the surrounding environment, preventing gas to cool, condense onto the galaxy and form stars. The effective cooling rate of gas is then affected in the following way:
| (4) |
This feedback mechanism is assumed to be quiescent and continual and is most effective at late times and for high black hole masses. In equation 2, has little effect on the accretion rate and is approximately constant for 150 at redshift 0, as shown in C06. (We note that because this threshold in is actually at a fixed value of , it evolves as ) . This means that gas cooling suppression, and hence quenching, depends mostly on and , which in turn depend on the history of the galaxy’s parent halo.
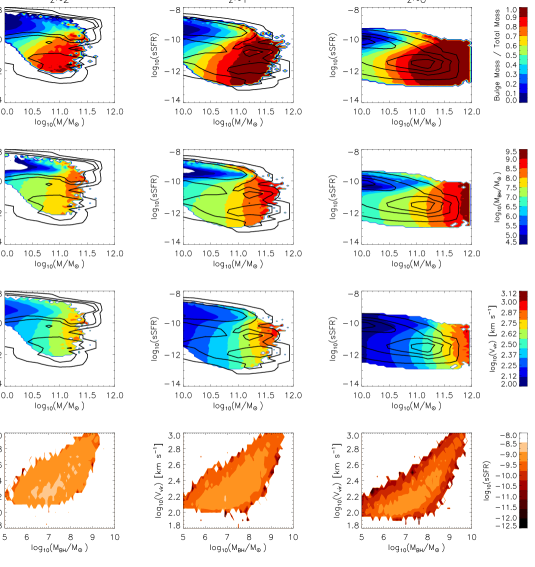
The top three rows of Fig. 5 illustrate the average ratio, and for model galaxies as a function of position in the sSFR - plane. The bottom row represents the distribution of and , colour-coded by sSFR. At a given redshift, the quiescent galaxies are more bulge-dominated, host more massive black holes111There is an exception to this if the galaxy in question has undergone a recent gas-rich merger. In this case there is also a starburst associated with the merger which boosts the star formation rate of the galaxy. and reside in haloes with larger virial velocities than the star-forming ones. The trends of the latter two parameters with redshift go in opposite directions: at a fixed location in the sSFR - plane, black hole masses grow in time, but the virial velocity of the halo decreases in general. The bottom row shows that at z=2, the dynamic range in specific star formation rate across the versus plane is much smaller than at . It can be concluded that, without additional quenching mechanisms, a stronger dependence of the feedback on and/or a weaker dependence on (with the appropriate re-adjustment of ) at might improve the peak separation discrepancy. Favouring over in equation 2 would lead to stronger feedback at early times, where halo virial velocities are high and black hole masses are low compared to their present values.
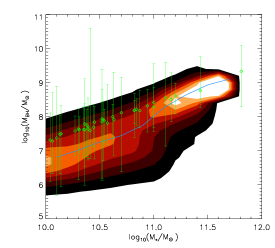
Imposing an ad hoc redshift dependence on the equations that govern so-called radio- AGN feedback is certainly not ideal. Another possibility is to modify the black hole growth model. As can be seen from Figure 6, the quenched population of galaxies with stellar masses less than , should arise from feedback by black holes with masses of . Black hole growth in the model is driven by galaxy mergers, particularly major mergers. There are however other viable black hole feeding mechanisms, such as disc instabilities or deviations from axisymmetry (Bournaud et al. (2011)), that could play a role, especially at higher redshifts, where star-forming galaxies are more gas-rich and so more likely to undergo such processes. In the Guo et al models, low mass bulges are produced by disk instabilities, but black hole growth does not occur during this process. The black hole mass vs. stellar mass relation predicted by the model, for 2, is plotted in Figure 6 together with observational data taken from Simmons et al. (2012). At low stellar masses, black holes are slightly undermassive by about 0.5 dex on average compared to observations, though towards the high mass end the agreement is good. In addition, as seen from the countours in Figure 6, at all stellar masses less than , the models predict a tail of black holes that scatter to masses more than a factor of 10 below the mean. This is not seen in the data. A secular black hole growth mechanism associated with disk instabilities may help boost the average mass of this population, resulting in more efficient quenching.
In addition, quenching mechanisms other than radio-AGN feedback may be required. In the local Universe, the frequency of large-scale FRI-type radio jets in galaxies with low mass black holes is extremely low (Best et al. (2005)). Almost all active galactic nuclei with black holes of this mass are Seyfert galaxies or quasars, where much of the energy liberated during black hole accretion emerges at ultraviolet or optical wavelengths. It may thus be necessary to consider so-called ‘quasar mode’ feedback. In the models, the quasar accretion mode occurs during gas-rich mergers, when progenitor black holes form through the rapid accretion of cold gas. There is a starburst resulting from the merger, which is visible is the second panel of Figure 5 as a band of galaxies with high specific star formation rates and black hole masses, and the merger remnant forms a galactic bulge. The merger consumes most of the gas, and supernovae eject gas from the galaxy and from the halo. In the current models, feedback from this black hole accretion mode is not explicitly modelled. If feedback from black hole formation is violent enough to shut down star formation in a galaxy entirely for a few Gyr, this may result in more realistic SFRs in lower masses galaxies at . Indeed, examination of the top panel of Figure 6 shows that models and data move into better agreement if galaxies with bulge mass-to-total mass ratios greater than have been able to eject all their gas.
Dubois et al. (2012), for example, have implemented a sub-grid model of black hole growth and feedback through quasar and radio mode in hydrodynamical cosmological simulations. They have shown that quasars are increasingly important at high redshift, where cold gas accretion triggers the quasar-mode of feedback. Gradually the cold gas reservoir is depleted by star formation, shock-heating of massive structures and feedback. Thus, the radio-mode becomes dominant at later times. These authors did not, however, investigate whether their simulations could reproduce the observed evolution of the bi-modal galaxy population. This is an important test of all galaxy modelling efforts that include feedback from supermassive black holes.
References
- Best et al. (2005) Best P. N., Kauffmann G., Heckman T. M., Brinchmann J., Charlot S., Ivezić Ž., White S. D. M., 2005, MNRAS, 362, 25
- Bournaud et al. (2011) Bournaud F., Dekel A., Teyssier R., Cacciato M., Daddi E., Juneau S., Shankar F., 2011, ApJL, 741, L33
- Boylan-Kolchin et al. (2009) Boylan-Kolchin M., Springel V., White S. D. M., Jenkins A., Lemson G., 2009, MNRAS, 398, 1150
- Colless et al. (2001) Colless M., et al. 2001, MNRAS, 328, 1039
- Croton et al. (2006) Croton D. J., Springel V., White S. D. M., De Lucia G., Frenk C. S., Gao L., Jenkins A., Kauffmann G., Navarro J. F., Yoshida N., 2006, MNRAS, 365, 11
- Daddi et al. (2007) Daddi E., Dickinson M., Morrison G., Chary R., Cimatti A., Elbaz D., Frayer D., Renzini A., Pope A., Alexander D. M., Bauer F. E., Giavalisco M., Huynh M., Kurk J., Mignoli M., 2007, ApJ, 670, 156
- Damen et al. (2009) Damen M., Förster Schreiber N. M., Franx M., Labbé I., Toft S., van Dokkum P. G., Wuyts S., 2009, ApJ, 705, 617
- Dubois et al. (2012) Dubois Y., Devriendt J., Slyz A., Teyssier R., 2012, MNRAS, 420, 2662
- Grogin et al. (2011) Grogin N. A., et al. 2011, ApJS, 197, 35
- Guo et al. (2011) Guo Q., White S., Boylan-Kolchin M., De Lucia G., Kauffmann G., Lemson G., Li C., Springel V., Weinmann S., 2011, MNRAS, 413, 101
- Kauffmann et al. (2006) Kauffmann G., Heckman T. M., De Lucia G., Brinchmann J., Charlot S., Tremonti C., White S. D. M., Brinkmann J., 2006, MNRAS, 367, 1394
- Kauffmann et al. (2003) Kauffmann G., Heckman T. M., Tremonti C., Brinchmann J., Charlot S., White S. D. M., Ridgway S. E., Brinkmann J., Fukugita M., Hall P. B., Ivezić Ž., Richards G. T., Schneider D. P., 2003, MNRAS, 346, 1055
- Koekemoer et al. (2011) Koekemoer A. M., et al. 2011, ApJS, 197, 36
- Lemson & Virgo Consortium (2006) Lemson G., Virgo Consortium t., 2006, ArXiv Astrophysics e-prints
- Martin et al. (2005) Martin D. C., et al. 2005, ApJL, 619, L1
- McCarthy et al. (2004) McCarthy P. J., Le Borgne D., Crampton D., Chen H.-W., Abraham R. G., Glazebrook K., Savaglio S., Carlberg R. G., Marzke R. O., Roth K., Jørgensen I., Hook I., Murowinski R., Juneau S., 2004, ApJL, 614, L9
- Noeske et al. (2007) Noeske K. G., et al. 2007, ApJL, 660, L43
- Simmons et al. (2012) Simmons B. D., Urry C. M., Schawinski K., Cardamone C., Glikman E., 2012, ApJ, 761, 75
- Spergel et al. (2003) Spergel D. N., Verde L., Peiris H. V., Komatsu E., Nolta M. R., Bennett C. L., Halpern M., Hinshaw G., Jarosik N., Kogut A., Limon M., Meyer S. S., Page L., Tucker G. S., Weiland J. L., Wollack E., Wright E. L., 2003, ApJS, 148, 175
- Springel et al. (2005) Springel V., White S. D. M., Jenkins A., Frenk C. S., Yoshida N., Gao L., Navarro J., Thacker R., Croton D., Helly J., Peacock J. A., Cole S., Thomas P., Couchman H., Evrard A., Colberg J., Pearce F., 2005, Nature, 435, 629
- Toft et al. (2009) Toft S., Franx M., van Dokkum P., Förster Schreiber N. M., Labbe I., Wuyts S., Marchesini D., 2009, ApJ, 705, 255
- Wang et al. (2011) Wang J., Kauffmann G., Overzier R., Catinella B., Schiminovich D., Heckman T. M., Moran S. M., Haynes M. P., Giovanelli R., Kong X., 2011, MNRAS, 412, 1081
- Williams et al. (2010) Williams R. J., Quadri R. F., Franx M., van Dokkum P., Toft S., Kriek M., Labbé I., 2010, ApJ, 713, 738
- Wuyts et al. (2011) Wuyts S., et al. 2011, ApJ, 742, 96
- York et al. (2000) York D. G., et al. 2000, AJ, 120, 1579