Imaging the antiferromagnetic to ferromagnetic first order phase transition of FeRh
Abstract
The antiferromagnetic (AFM) to ferromagnetic (FM) first order phase transition of an epitaxial FeRh thin-film has been studied with x-ray magnetic circular dichroism using photoemission electron microscopy. The FM phase is magnetized in-plane due to shape anisotropy, but the magnetocrystalline anisotropy is negligible and there is no preferred in-plane magnetization direction. When heating through the AFM to FM phase transition the nucleation of the FM phase occurs at many independent nucleation sites with random domain orientation. The domains subsequently align to form the final FM domain structure. We observe no pinning of the FM domain structure.
I Introduction
The metallic alloy FeRh undergoes an uncommon phase transition at TC. Here the magnetic order upon heating changes from antiferromagnetic (AFM) to ferromagnetic (FM) while the lattice simultaneously expands by .Fallot and Hocart (1939) As the transition is first order it involves a latent heat and phase coexistence of the AFM and FM states. The value of TT above room temperature is attractive for technological applications and has lead to proposed uses in thermally assisted magnetic recordingThiele et al. (2003), magnetocaloric refrigirationAnnaorazov et al. (1992) and magnetostrictive transductionIbarra and Algarabel (1994). For any application utilizing the phase transition of FeRh an improved understanding of the dynamics and the phase coexistence is of interest. The phase transition also provides an opportunity to study the general phenomena of phase coexistence in a first order magnetic phase transition. Other materials where a magnetostructural transition plays a crucial role for the properties include the paramagnetic to FM transition in MnAs Wilson and Kasper (1964); Kim et al. (2011) and the interplay between magnetic and structural domains in shape memory alloys like the Heusler alloy Ni2MnGa.Ullakko et al. (1996) Phase coexistence also plays a vital role in strongly correlated materials like Manganites. Uehara et al. (1999); Dagotto et al. (2001)
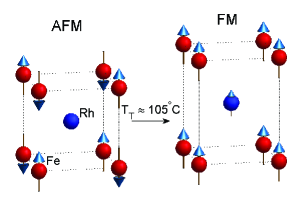
FeRh has the CsCl crystal structure and the magnetic structure is known from Mössbauer spectroscopyShirane et al. (1963), neutron diffractionShirane et al. (1964) and band-structure calculations Moruzzi and Marcus (1992). The unit cell is sketched in Figure 1. The AFM phase is of type II with nearest neighbor Fe atoms aligned antiferromagnetically with moments m and zero magnetic moment on the Rh atoms. In the FM phase the Fe atoms align ferromagnetically and a moment is induced on the Rh atoms, m. In bulk samples the magnetic transition is accompanied by an isotropic structural expansion of , while for thin-films the in-plane expansion is restricted by the substrateMaat et al. (2005). Here the expansion at the phase transition is only along the surface normal as sketched in Figure 1. While the electronic structure is largely unaffected by the transition in both bulk crystalsChen and Lynch (1988) and thin films,Lee et al. (2010) the heat capacity, entropy and electrical resistance all change at TTSharma et al. (2011); Annaorazov et al. (1996). The exact transition temperature depends on both compositionMcKinnon et al. (1970) and the addition of transition metal impuritiesKouvel (1966), which complicates comparison between different experiments. Though the AFM to FM phase transition has been known since 1939 Fallot and Hocart (1939) the physical mechanism behind it is still debated. The first simple empirical model proposed historically assumed a change of sign of the Fe-Fe interaction as a function of the lattice expansion but failed to explain the experimental work, especially the large change in entropy during the transition McKinnon et al. (1970). On the other hand density functional theory (DFT) computations reproduce the existence of the AFM and FM phases and the volume dependency of the lattice constant Moruzzi and Marcus (1992). The low energy difference (0.2 mRy/atom) between the AFM and FM phases could be explained by considering the effect of spin waves Gu and Antropov (2005) and recent local DFT work indicate that the volume dependence of the AFM Fe-Fe exchange interaction combined with the unaffected FM Fe-Rh interaction play a crucial role for the physical properties of FeRh. Sandratskii and Mavropoulos (2011)
The coexistence of the FM and AFM phases during the phase transition has been reported in several recent experiments. X-ray magnetic circular dichroism (XMCD) experiments were interpreted to conclude that even in the early stages of the transition the microscopic FM domains were in the final FM state. Stamm et al. (2008); Radu et al. (2010) The lattice expansion was studied by x-ray diffraction which both directly showed the mixed phase and indicated that the transition was initiated at the free surface of the sample.Kim et al. (2009) Magnetic force microscopy images of polycrystalline samples showed a mixed phaseYokoyama et al. (1998) and magnetization curves have been interpreted to support an Avrami model behavior for the transition.Lu et al. (2010) Similarly, when induced by a fs laser pulse we found that the transition proceeded through the nucleation of many independent and initially unaligned FM domains.Mariager et al. (2012) In order to obtain a microscopic image of the coexisting magnetic phases a spatially resolved probe is however needed and very recently Baldasseroni et al. (2012) used XMCD photoelectron emission microscopy (PEEM) to image the transition. This technique is well suited because PEEM provides spatially resolved images with a resolution down to 50 nm, while XMCD gives excellent magnetic contrast in the FM phase.
In this paper we present XMCD PEEM images obtained at various temperatures of an epitaxial FeRh film which was slowly heated and cooled through the AFM to FM phase transition. We first analyze the domain structure and anisotropy of the FM phase and then focus on images obtained during the phase transition and show how the phase transition is initiated at many independent nucleation sites. We present a quantitative analysis of the nucleation, and finally compare the magnetic process to the structural change studied by x-ray diffraction. This work complements both our previously published work on the same sample on the ultrafast laser induced AFM to FM transitionMariager et al. (2012) and the recent findings by Baldasseroni et al. (2012).
II Experimental details
The FeRh thin film (d = 47 nm) was grown on MgO (001) by co-magnetron sputtering from elemental targets Maat et al. (2005). The single crystal film was epitaxial to the substrate with a (001) surface and as characterized by x-ray diffraction.
The XMCD PEEM measurements were done at the SIM beamline of the Swiss Light SourceFlechsig et al. (2010). This beamline provides circularly polarized light with an energy resolution of E/. The x-ray incidence angle was 16o and all images were recorded at the Fe L3 edge at 708 eV. The field of view was varied from 10-20m and images were recorded with 512512 pixels and a spatial resolution of 50 nm. The electron microscope accelerates and detects the emitted photoelectrons and the depth of view is around 5 nm, limited by the mean free path of the photoelectrons. The XMCD images are obtained from two images taken with left (-) and right (+) circular polarization and x-ray intensity I. The asymmetry is calculated for each pixel as:
| (1) |
The asymmetry is proportional to the magnetization m projected onto the x-ray wavevector K.Scholl et al. (2002) In this case all non-magnetic contrast mechanisms cancel because they are independent of the photon helicity. By measuring for three different sample orientations it is possible to obtain three projections of m to determine its 3 vector components.Guyader et al. (2012) The sample was heated by a small resistive heater, with rates of 0.85o K/min during heating and -0.7o K/min during cooling.
The x-ray diffraction (XRD) experiments were performed at the MicroXAS beamline of the Swiss Light Source. We used a 7 keV x-ray beam in a gracing incidence geometry with incidence angle 0.71∘ which matches the x-ray penetration depth to the film thickness. The (101) Bragg reflection was measured with a PILATUS 100K pixel detector in a rocking curve scan where the sample was rotated around the surface normal in 60 discrete steps in the interval . By recording the data in a 1D scan with a 2D detector the Bragg reflection can be mapped in 3D, which allows tracking of both in-plane and out-of-plane peak shifts and hence the shift in lattice constantMariager et al. (2009). The XRD measurements were performed in air and the temperature was changed in discrete steps while allowing the temperature to stabilize between each measurement.
III Ferromagnetic Domain Structure
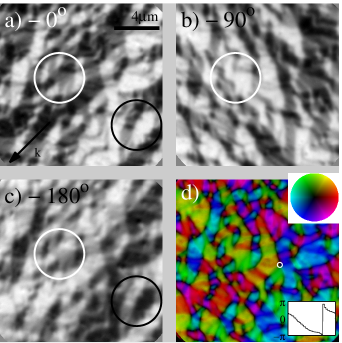
In order to analyze the domain structure of FeRh it is necessary to obtain XMCD PEEM images at least at three different rotations of the sample, and in Figure 2 we show three PEEM images obtained at , and , with the rotation taken around the surface normal. The sample temperature was 150oC, well above TT. In all the images FM domains are clearly visible as black and white contrast and the lengthscale of the domain structures is on the order of m, as seen by comparison to the 4m scalebar. The net moment in the images is essentially zero, as expected when no external field was applied to the sample.
The rotation of the sample by 180o from Figure 2a to c results in a reversal of contrast from black to white and vice versa, as highlighted by the black circles and evident throughout the images. This indicates in-plane magnetic domains because out-of-plane domains do not change contrast upon rotation of the sample. Consistent with this, a 90o rotation results in an interchange of grey domains (m H) with white/black domains. This is highlighted for a single feature by the white circles in Figure 2a-c. The images thus directly shows that the FeRh film is dominated by in-plane magnetization. This magnetic structure is due to the shape anisotropy of the thin film, where the in-plane magnetization minimizes the stray field and therefore the total energy.
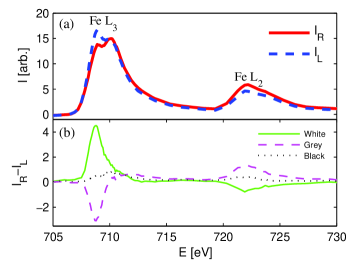
In Figure 3a we show the absorption spectrum from a single domain for respectively left and right circular polarized x-rays. Both the Fe L3 edge at 708 eV and the L2 edge at 721 eV are split in two peaks of which only the peaks at lower energy show dichroism. This is a typical sign of surface oxidation Regan et al. (2001). In this experiment the sample surface was neither capped nor sputtered prior to imaging which explains the surface oxidation. We did subsequently confirm that sputtering 2 nm off the surface removed the oxide layer on a second sample (not shown). In Figure 3b we show the asymmetry for three different domains, corresponding to a respectively white, black and grey area in Figure 2a. This confirms that the patterns in Figure 2a do indeed arise from the magnetic structure of the sample.
The three images in Figure 2 were used to determine the magnetization m(r).Guyader et al. (2012) In Figure 2d we show the azimuth angle of the in-plane magnetization, where the color saturation is a quantitative scale for the magnitude of the moment. Figure 2d reveals domains with a typical lengthscale of 1m and fairly straight domain walls. It also shows the existence of nodes around which the in-plane magnetization rotates 360o. One example is shown in the lower insert in the figure. Here the azimuthal angle is taken along the contour shown as a white circle in Figure 2d, and the 0 to 360o degree rotation is evident. As a consequence there must be an out-of-plane divergence but these vortex cores are too small to be resolved. Previously reported domain patterns for FeRh polycrystalline bulk samplesYokoyama et al. (1998) were likely caused by dipolar interaction between the grains, a feature which is not present in our epitaxial film.
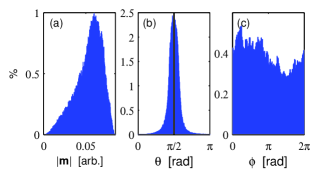
The reconstruction of the three dimensional magnetization vector allows us to determine if the film has preferred directions of the local magnetic moments. In Figure 4 we show histograms of the three spherical coordinates of m: the moment magnitude , the out-of-plane inclination angle and in-plane azimuth angle . Here lies in the range from 0 to with 0 corresponding to the magnetic moment lying along the surface normal and being in-plane. The magnitude of the moment shows one major peak, but is significantly broadened towards zero, because we do not have the resolution to image domain walls. Due to this areas of the sample where the direction of the local magnetic moment changes on a scale shorter than the PEEM resolution will then be measured as having a smaller magnitude of the moment. The histogram of the out-of-plane angle has a clear peak at , confirming the in-plane magnetization which is also visible from the raw images in Figure 2. For the azimuth angle we find a fairly uniform distribution while a strong anisotropy in the plane would give well defined domains and reveal itself as distinct peaks in the histogram. The absence of such peaks indicates that FeRh has a very low magnetocrystalline anisotropy. We are not aware of a measurement of the anisotropy constant K for FeRh, but our result supports the assumption that K is small for FeRh.Guslienko et al. (2004); Bordel et al. (2012)
From the presence of two peaks in a histogram of the asymmetry of a single XMCD image Baldasseroni et al. (2012) concluded that their FeRh film had a four fold anisotropy. However, since the asymmetry for an in-plane magnetized surface is proportional to an isotropic distribution of azimuth angles also results in two peaks in the histogram of the asymmetry. Based on our azimuthal study of the magnetization vector we conclude in contrast to ref. 28 that the crystalline anisotropy is too weak to give a well defined 4 fold easy axis in FeRh.
It has also been suggested that the tetragonal distortion imposed by the substrate leads to a magnetocrystalline anisotropy favoring out-of-plane magnetization of the FM phase, when the ratio between the lattice constants satisfy as for our sample.Bordel et al. (2012) The shape anisotropy was however estimated to be several times larger than the magnetocrystalline anisotropy for a 150 nm film and our results clearly show that the film is 100% in-plane magnetized. This shows that the proposed magnetocrystalline anisotropy if present is too weak to overcome to the shape anisotropy of our 50 nm thin film.
IV Magnetic Phase Transition
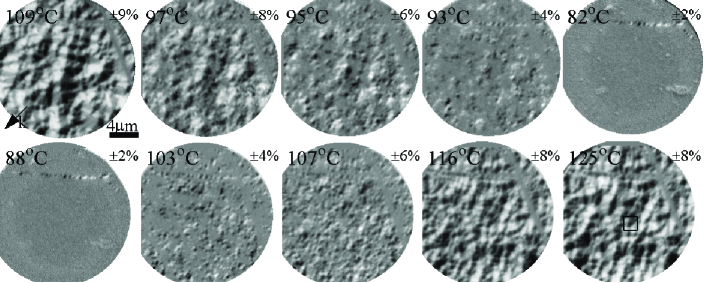
Having established the ability to map FM domain structures we now discuss the AFM to FM phase transition and the phase coexistence. In Figure 5 we show images taken as the sample was cooled (upper row) and heated (lower row) through the AFM to FM transition. The images in Figure 5 show a different region of the sample than the images in Figure 2. The feature consisting of two straight lines which cross in the upper right corner of each image appears to be a scratch on the sample surface, and was used to monitor the drift of the sample. In the following we refer to each image in Figure 5 by the temperature at which it was obtained.
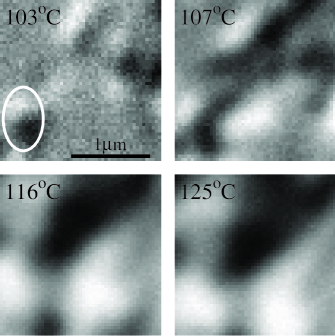
We first focus on the heating process. In the AFM phase (T = 82oC and T = 88oC) no domain structure is visible, because the AFM phase does not show any XMCD. The growth of the FM phase in the AFM matrix then proceeds through the nucleation of many independent domains on a sub micron length-scale (T = 103oC). This directly shows the coexistence of the two magnetic phases expected for a first order phase transition at intermediate temperatures. As the temperature is increased (T = 107oC) the dominant feature remains nucleation of new domains rather than growth of previously nucleated domains. Like the final domain pattern in Figure 2 the initially nucleated domains have no preferred in-plane magnetization directions. As the film reaches a purely FM state neighboring domains to some extent realign upon contact (T = 116oC). This is evident in Figure 6 where the initial black contrast of the circled feature changes to white. The result is in the final structure which as already observed is dominated by domains of size (T = 125oC). Once the transition reaches this state the domain structure is unchanged upon further heating. One example of this nucleation process is highlighted in Figure 6 which shows a magnification of a area corresponding to the square in Figure 5 (T = 125oC). At T = 103oC several independent FM domains are visible and in several cases positive (white) and negative (black) dichroism are paired. This indicates that the independent FM domains form closed magnetic loops in order to minimize the stray field. As the temperature is raised these smaller structures change or grow to larger domains. Figure 5 and Figure 6 show how the AFM to FM transition proceeds through the nucleation of many independent unaligned domains, and subsequent partial reorientation of neighboring domains. This observation agrees with the recent work by Baldasseroni et al. (2012) and with our previous results where we have found the same mechanism to dominate the phase transition when it is induced with a fs laser pulse.Mariager et al. (2012) We find the same nucleation dynamics on both ps and s timescales, suggesting that also the laser induced phase transition is a thermal process.
Because we can only image the FM domains the observed process during cooling is slightly different from heating. In this case we observe how the FM domains disappear, rather than how the AFM phase nucleates in the FM matrix. In Figure 5 we see how the FM domains upon cooling first start to shrink (T = 97o C) and eventually break up (T = 95o C) into independent domains. The result is again a process where the final coexistence of the AFM and FM phase consists of many small sub-micron size FM domains (T = 93o C) in an AFM matrix. This process is similar to heating, but there is less realignment of the FM domains. To quantify this difference we define realignment as a change in sign of dichroism and determine the number of pixels which change sign at some point during heating (cooling). In this case the fraction of the film which realign is 14% during heating and 7% during cooling. We stress that this definition of realignment is a simplification and that the actual fraction of the film which realigns is higher.
The images in Figure 5 taken at T = 109oC and T = 125oC were obtained before and after cooling to the AFM phase. When comparing the two images the two domain structures appear to be independent. To quantify this we again sort pixels according to whether they show positive or negative dichroism, and compare how many pixels are positive in both images. We find a fraction of 0.26, which is practically identical to the 0.25 expected if there was no correlation between the domains in the two images.
A comparison of images during the late stages of cooling (T = 93o C) and early stages of heating (T = 103o C) however reveal a statistical significant correlation of the FM regions 111In both of the images of the sample is FM, while 7% of the sample is FM in both images. This is more than 3 standard deviations higher than the overlap found in a numerical simulation where a 19% FM area was chosen randomly in two images and then compared.. That is, on average the regions which nucleate first during heating also retain the FM states longest during cooling. The magnetization direction is however not correlated in the two images which again shows that the film has no memory of the previous FM phase. This rules out the existence of a single unique pathway between the AFM and FM domain patterns.
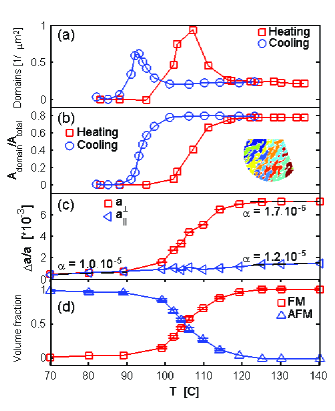
To obtain a more quantitative understanding of the phase transition the images in Figure 5 were analyzed as follows. Due to the low magnetocrystalline anisotropy it is not possible to identify domains by the strength of the asymmetry. In addition the XMCD contrast is significantly weaker at the early stages of the nucleation, which complicates the comparison of domains at different temperatures. Instead we define a domain as a connected area of pixels with either positive or negative dichroism. This is not a precise definition because it depends upon sample orientation (Figure 2), but it allows us to identify the appearing FM nuclei and quantify their number and sizes as well as the total FM area. The result of this analysis is shown in Figure 7. Figure 7a shows the number of individual domains as a function of temperature for both heating and cooling, while Figure 7b shows the FM fraction of the film. The final FM fraction only reaches 0.8 because we do not measure domains with a magnetic moment perpendicular to the x-ray beam which have no magnetic contrast. In reality the entire film is in the FM phase. The quantitative analysis presented in Figure 7 support the qualitative interpretation of the images in Figure 5. The peak seen at intermediate temperatures in Figure 7a confirms that the nucleation proceeds through an initially large number of domains which later realign resulting in fewer domains. We note that the definition of a domain used in this analysis will underestimate the final number of domains according to the standard definition.
We finally note that while a FM surface layer has previously been reported below TT in the AFM phase for both Au, Al and MgO capped FeRh films Ding et al. (2008); Baldasseroni et al. (2012); Fan et al. (2010) we clearly observe no such FM surface layer for the uncapped sample studied here. Though we will not discuss the subject further, we have observed FM surface layers on some uncapped films and imaged FeRh films with 2 nm Pt cap layer without a FM surface. The many different results thus seems to indicate that details in film growth and stoichiometry plays a bigger role in defining the magnetic surface properties than the choice of capping.
V Structural Phase Transition
The AFM to FM phase transition in FeRh has two connected components as the change in magnetic order goes hand in hand with a structural expansion. To complete the picture of the transition we show in Figure 7c the lattice expansion as a function of temperature. The shift in lattice constant a can to first approximation be found from the shift in Bragg peak position q because . In addition to the thermal expansion, the out-of-plane lattice constant shows a clear shift of 0.7 % at TT. The in-plane lattice constant only shows linear thermal expansion through the entire temperature range. The in-plane thermal expansion of the FeRh film is close to the value for MgO ( at T = 300 K).Browder (1969) The one dimensional expansion thus appears to be due to in-plane pinning to the MgO substrate. This difference from the isotropic expansion in bulk crystals has been reported previously.Maat et al. (2005)
In the diffraction experiment we measure the total diffraction from the two coexisting phases. The Bragg peak measured during the phase-transition is a superposition of two peaks originating from the AFM and FM phases respectively and can be decomposed into two peaks corresponding to the two phasesMariager et al. (2012). As the integrated intensity is proportional to the scattering volume the volume fraction of the AFM and FM phase as a function of temperature can then be determined. In Figure 7d we show the volume fractions of the AFM and FM phase during the transition. We find agreement between the evolution of the FM structure and the magnetic order. The small differences in temperature is expected given the difference in how the temperature was changed and measured.
VI Discussion
The high resolution magnetic images obtained of the phase transition and the phase coexistence in FeRh allows us to speculate about which microscopic mechanisms drive the phase transition. Here three observations play a crucial role. First, the many independent nucleation sites present on a sub-micron length scale indicate that the driving mechanism must appear on a similar or smaller length scale. Second, the correlation between images taken during cooling and heating show that there exist either pinning defects or local impurity fluctuations leading to local variations in transition temperature. Third, the magnetization direction in the FM phase is not pinned neither for the final structure nor during nucleation.
Concerning the existence of pinning centres our spatial resolution makes it difficult to discern between a transition that appears at topographic features such as defects or strain fields as suggested for the AFM to FM transition in Gd5Ge4 Moore et al. (2006) or due to a broader but fixed local variation of the transition temperature such as suggested for Ru doped CeFe2 Roy et al. (2004) and the Heusler alloy NiMnIn.Sharma et al. (2010) Clear topographic features such as the scratches visible in Figure 5 or intentionally produced antidots (not shown) however do not dominate as nucleation centres. In addition rather than observing nucleation only at fixed sites we observe nucleation in all regions but at different temperatures. These two observations suggest that local impurity variations lead to changes in the volume free energy large enough to compensate for the interfaces created during phase coexistence.Imry and Wortis (1979) The resulting heterogenous nucleation was also observed in previous work on FeRh. Maat et al. (2005); Lu et al. (2010); Baldasseroni et al. (2012)
The many independent nucleation sites could support the recent theoretical suggestion that local fluctuations in magnetic moment and/or volume acts as driving ”forces” for the transition Derlet (2012). The many independent nucleation sites then indicate a high attempt frequency and/or a low energy barrier for the transition. This can also explain the fact that the domain pattern is dominated by many small domains because the existence of many independent nucleation centers means that even a moderate domain wall coercivity will result in many small magnetic domains.
We did not apply a magnetic field to the sample because an external magnetic field distorts the path of the photoelectrons and hereby reduces the resolution of the microscope. In an applied magnetic field it could be studied if the nucleated FM phase nucleate aligned to the field, align to the field immediately after nucleation or only after a full FM domain pattern is achieved. We have previously indirectly observed the latter case at fields of 0.1 T when the phase transition was induced by a fs laserMariager et al. (2012). This question of alignment relates to the question of how the AFM and FM domains are related to one another, if at all. A theoretical pathway has been used in calculations, where the Fe moments rotate during the transformation from AFM to FM Sandratskii and Mavropoulos (2011). In this case an AFM domain can give rise to four different directions of the magnetic moment in the FM phase. From our comparison of images taken at the late stages of cooling and early stages of heating, we confirm that there is no unique pathway between the AFM and FM order. It was also calculated and shown for one film that the tetragonal crystal structure imposed on the film by the substrate leads to a magnetocrystalline anisotropy which strengthens this rotation of the moments.Bordel et al. (2012) Depending on the preferred magnetization direction this effect might however be negated by the shape anisotropy, as in our experiment. To verify a possible relation between the AFM and FM domain structures an experimental probe of the AFM domain structure is needed. These are scarce but one candidate could be x-ray linear magnetic dichroismSpanke et al. (1998); Stöhr et al. (1999). While this technique has been applied successfully to oxides only few studies of metallic systems exist.
VII Conclusions
To summarize we used XMCD PEEM to measure the FM domain structure and XRD to confirm the structural changes of an epitaxial FeRh thinfilm. The film was in-plane magnetized due to shape anisotropy and with no preferred in-plane direction of the magnetization, which indicates a low magnetocrystalline anisotropy. The resulting domain structure had a lengthscale of and the magnetic domains were not pinned when the film was repeatedly cycled through the transition. We directly observed the phase coexistence expected for a first order phase transition in the XMCD PEEM images, which are ideally suited to study this phenomenon. We found that the phase transition proceeds by nucleation at many small and independent sub-micron sized sites. This effect dominates over growth of already existing FM domains and neighboring domains only subsequently and to some extent realign to form the final FM domain pattern. These findings match our previously developed model for the laser induced phase transitionMariager et al. (2012) and the existence of the same dynamics on ps and s timescale suggest that the laser induced phase transition is also a thermal process. A further understanding of the AFM to FM pathway and the underlying driving forces could be obtained by imaging also the AFM phase or by time-resolved XMCD PEEM.
Acknowledgements.
The PEEM images were obtained at the X11MA beamline, and the x-ray diffraction experiments were performed on the X05LA beam line, both at the Swiss Light Source, Paul Scherrer Institut, Villigen, Switzerland. We thank D. Grolimund and C. Borca of X05LA for help and P. Derlet for fruitful discussions. We thank E. E. Fullerton of U. C. San Diego for preparing the sample. This work was supported by the Swiss National Foundation through NCCR MUST.References
- Fallot and Hocart (1939) M. Fallot and R. Hocart, Rev. Sci. 77, 498 (1939).
- Thiele et al. (2003) J. U. Thiele, S. Maat, and E. E. Fullerton, Appl. Phys. Lett. 82, 2859 (2003).
- Annaorazov et al. (1992) M. P. Annaorazov, K. A. Asatryan, G. Myalikgulyev, S. A. Nikitin, A. M. Tishin, and A. L. Tyurin, Cryogenics 32, 867 (1992).
- Ibarra and Algarabel (1994) M. R. Ibarra and P. A. Algarabel, Phys. Rev. B 50, 4196 (1994).
- Wilson and Kasper (1964) R. H. Wilson and J. S. Kasper, Acta Crystallogr. 17, 95 (1964).
- Kim et al. (2011) J. Kim, A. Akinaga, and J. Kim, Appl. Phys. Lett. 98, 102511 (2011).
- Ullakko et al. (1996) K. Ullakko, J. K. Huang, C. Kantner, R. C. O’Handley, and V. V. Kokorin, Appl. Phys. Lett. 69, 1966 (1996).
- Uehara et al. (1999) M. Uehara, S. Mori, C. H. Chen, and S.-W. Cheong, Nature 399, 560 (1999).
- Dagotto et al. (2001) E. Dagotto, T. Hotta, and A. Moreo, Phys. Rep. 344, 1 (2001).
- Shirane et al. (1963) G. Shirane, C. W. Chen, R. Nathans, and P. A. Flinn, J. Appl. Phys. 34, 1044 (1963).
- Shirane et al. (1964) G. Shirane, R. Nathans, and C. W. Chen, Phys. Rev. 134, A1547 (1964).
- Moruzzi and Marcus (1992) V. L. Moruzzi and P. M. Marcus, Phys. Rev. B 46, 2864 (1992).
- Maat et al. (2005) S. Maat, J.-U. Thiele, and E. E. Fullerton, Phys. Rev. B 72, 214432 (2005).
- Chen and Lynch (1988) L.-Y. Chen and D. W. Lynch, Phys. Rev. B 37, 10503 (1988).
- Lee et al. (2010) J.-S. Lee, E. Vescovo, L. Plucinski, C. M. Schneider, and C.-C. Kao, Phys. Rev. B 82, 224410 (2010).
- Sharma et al. (2011) M. Sharma, H. M. Aarbogh, J. U. Thiele, S. Maat, E. E. Fullerton, and C. Leighton, J. Appl. Phys. 109, 083913 (2011).
- Annaorazov et al. (1996) M. P. Annaorazov, S. A. Nikitin, A. L. Tyurin, K. A. Asatryan, and A. K. Dovletov, J. Appl. Phys. 79, 1689 (1996).
- McKinnon et al. (1970) J. B. McKinnon, D. Melville, and E. W. Lee, J. Phys. C 1, 46 (1970).
- Kouvel (1966) J. S. Kouvel, J. Appl. Phys. 37, 1257 (1966).
- Gu and Antropov (2005) R. Y. Gu and V. P. Antropov, Phys. Rev. B 72, 012403 (2005).
- Sandratskii and Mavropoulos (2011) L. M. Sandratskii and P. Mavropoulos, Phys. Rev. B 83, 174408 (2011).
- Stamm et al. (2008) C. Stamm, J.-U. Thiele, T. Kachel, I. Radu, P. Ramm, M. Kosuth, J. Minár, H. Ebert, H. A. Dürr, W. Eberhardt, et al., Phys. Rev. B 77, 184401 (2008).
- Radu et al. (2010) I. Radu, C. Stamm, N. Pontius, T. Kachel, P. Ramm, J.-U. Thiele, H. A. Dürr, and C. H. Back, Phys. Rev. B 81, 104415 (2010).
- Kim et al. (2009) J. W. Kim, P. J. Ryan, Y. Ding, L. H. Lewis, M. Ali, C. J. Kinane, B. J. Hickey, C. H. Marrows, and D. A. Arena, Appl. Phys. Lett. 95, 222515 (2009).
- Yokoyama et al. (1998) Y. Yokoyama, M. Usukura, S. Yuasa, Y. Suzuki, H. Miyajuma, and T. Katayama, J. Magn. Magn. Mater. 177-181, 181 (1998).
- Lu et al. (2010) W. Lu, Y. Wang, B. Yan, and T. Suzuki, J. Mater. Sci. 45, 4919 (2010).
- Mariager et al. (2012) S. O. Mariager, F. Pressacco, G. Ingold, A. Caviezel, E. Möhr-Vorobeva, P. Beaud, S. L. Johnson, C. J. Milne, E. Mancini, S. Moyerman, et al., Phys. Rev. Lett. 108, 087201 (2012).
- Baldasseroni et al. (2012) C. Baldasseroni, C. Bordel, A. X. Gray, A. M. Kaiser, F. Kronast, J. Herrero-Albillos, C. M. Schneider, C. S. Fadley, and F. Hellman, Applied Physics Letters 100, 262401 (pages 5) (2012).
- Flechsig et al. (2010) U. Flechsig, F. Nolting, A. F. Rodriguez, J. Krempasky, C. Quitmann, T. Schmidt, S. Spielmann, and D. Zimoch, AIP Conf. Proc. 1234, 319 (2010).
- Scholl et al. (2002) A. Scholl, H. Ohldag, F. Nolting, J. Stöhr, and H. A. Padmore, Rev. Sci. Instr. 73, 1362 (2002).
- Guyader et al. (2012) L. L. Guyader, A. Kleibert, A. F. Rodriguez, S. E. Moussaoui, A. Balan, M. Buzzi, J. Raabe, and F. Nolting, J. Electron. Spectrosc. Relat. Phenom. p. DOI: 10.1016/j.elspec.2012.03.001 (2012).
- Mariager et al. (2009) S. O. Mariager, S. L. Lauridsen, A. Dohn, N. Bovet, C. B. Sorensen, C. M. Schlepuetz, P. R. Willmott, and R. Feidenhans’l, J. Appl. Cryst. 42, 369 (2009).
- Regan et al. (2001) T. J. Regan, H. Ohldag, C. Stamm, F. Nolting, J. Lüning, J. Stöhr, and R. L. White, Phys. Rev. B 64, 214422 (2001).
- Guslienko et al. (2004) K. Y. Guslienko, O. Chubykalo-Fesenko, O. Mryasov, R. Chantrell, and D. Weller, Phys. Rev. B 70, 104405 (2004).
- Bordel et al. (2012) C. Bordel, J. Juraszek, D. W. Cooke, C. Baldasseroni, S. Mankovsky, J. Minár, H. Ebert, S. Moyerman, E. E. Fullerton, and F. Hellman, Phys. Rev. Lett. 109, 117201 (2012).
- Ding et al. (2008) Y. Ding, D. A. Arena, J. Dvorak, M. Ali, C. J. Kinane, C. H. Marrows, B. J. Hickey, and L. H. Lewis, J. Appl. Phys. 103, 07B515 (2008), 52nd Annual Conference on Magnetism and Magnetic Materials, Tampa, FL, NOV 05-09, 2007.
- Fan et al. (2010) R. Fan, C. J. Kinane, T. R. Charlton, R. Dorner, M. Ali, M. A. de Vries, R. M. D. Brydson, C. H. Marrows, B. J. Hickey, D. A. Arena, et al., Phys. Rev. B 82, 184418 (2010).
- Browder (1969) S. S. Browder, James Steve; Ballard, Applied Optics 8, 793 (1969).
- Moore et al. (2006) J. D. Moore, G. K. Perkins, Y. Bugoslavsky, L. F. Cohen, M. K. Chattopadhyay, S. B. Roy, P. Chaddah, K. A. Gschneidner, and V. K. Pecharsky, Phys. Rev. B 73, 144426 (2006).
- Roy et al. (2004) S. B. Roy, G. K. Perkins, M. K. Chattopadhyay, A. K. Nigam, K. J. S. Sokhey, P. Chaddah, A. D. Caplin, and L. F. Cohen, Phys. Rev. Lett. 92, 147203 (2004).
- Sharma et al. (2010) V. K. Sharma, J. D. Moore, M. K. Chattopadhyay, K. Morrison, L. F. Cohen, and S. B. Roy, J. Phys.-Condes. Matter 22, 016008 (2010).
- Imry and Wortis (1979) Y. Imry and M. Wortis, Phys. Rev. B 19, 3580 (1979).
- Derlet (2012) P. M. Derlet, Phys. Rev. B 85, 174431 (2012).
- Spanke et al. (1998) D. Spanke, V. Solinus, D. Knabben, F. U. Hillebrecht, F. Ciccacci, L. Gregoratti, and M. Marsi, Phys. Rev. B 58, 5201 (1998).
- Stöhr et al. (1999) J. Stöhr, A. Scholl, T. J. Regan, S. Anders, J. Lüning, M. R. Scheinfein, H. A. Padmore, and R. L. White, Phys. Rev. Lett. 83, 1862 (1999).