Flare-like variability of the Mg IIÅ emission line in the -ray blazar 3C 454.3
Abstract
We report the detection of a statistically significant flare-like event in the Mg IIÅ emission line of 3C 454.3 during the outburst of autumn 2010. The highest levels of emission line flux recorded over the monitoring period (2008 - 2011) coincide with a superluminal jet component traversing through the radio core. This finding crucially links the broad-emission line fluctuations to the non-thermal continuum emission produced by relativistically moving material in the jet and hence to the presence of broad-line region clouds surrounding the radio core. If the radio core were located at several parsecs from the central black hole then our results would suggest the presence of broad-line region material outside the inner parsec where the canonical broad-line region is envisaged to be located. We briefly discuss the implications of broad-emission line material ionized by non-thermal continuum on the context of virial black hole mass estimates and gamma-ray production mechanisms.
1. Introduction
It has been long known that the optical emission of the flat spectrum radio quasar 3C 454.3 at is highly variable (Angione, 1968), showing structural and flux variability on its parsec scale jet (Pauliny-Toth et al., 1987) and also correlated variability among different wave bands (Tornikoski et al., 1994). The recurrent flaring behaviour of 3C 454.3 over the last six years (2005-2011, Fuhrmann et al., 2006; Giommi et al., 2006; Raiteri et al., 2008b, a; Vercellone et al., 2008; Striani et al., 2010; Ackermann et al., 2010; Vercellone et al., 2011) has permitted the assembly of an exquisite multiwavelength time resolved database (e.g. Bonning et al., 2009; Raiteri et al., 2011; Sasada et al., 2012) allowing to probe intraday variability in the source (e.g Foschini et al., 2010; Gaur et al., 2012). Despite the precious database compiled, no general consensus about the location of the gamma-ray production zone in 3C 454.3 has been reached so far. Some studies (e.g. Tavecchio et al., 2010; Poutanen & Stern, 2010) favor the scenario where the gamma-ray emission in 3C 454.3 is generated close to the central black hole (BH) within the canonical broad-line region (BLR), which is located within the inner parsec. However, other works (e.g. Sikora et al., 2008; Jorstad et al., 2010) find that the scenario where gamma-rays are produced far from the central BH, within or downstream of the radio core at distances much larger than 1 pc, best reproduces the observations of 3C 454.3.
In this work we explore the variability of the broad-emission lines in 3C 454.3 in order to use it as an auxiliary piece of information to probe the geometry and physics of the innermost regions of 3C 454.3 and to provide evidence for the above scenarios of the gamma-ray production. Although 3C 454.3 has been monitored extensively at all wavelengths, its broad-emission lines have been scarcely systematically studied (Raiteri et al., 2008a; Smith et al., 2009; Benítez et al., 2010). The present work is the first to address the variability of emission lines in 3C 454.3 during the era with the largest sample of its optical spectra ever compiled.
2. Observations
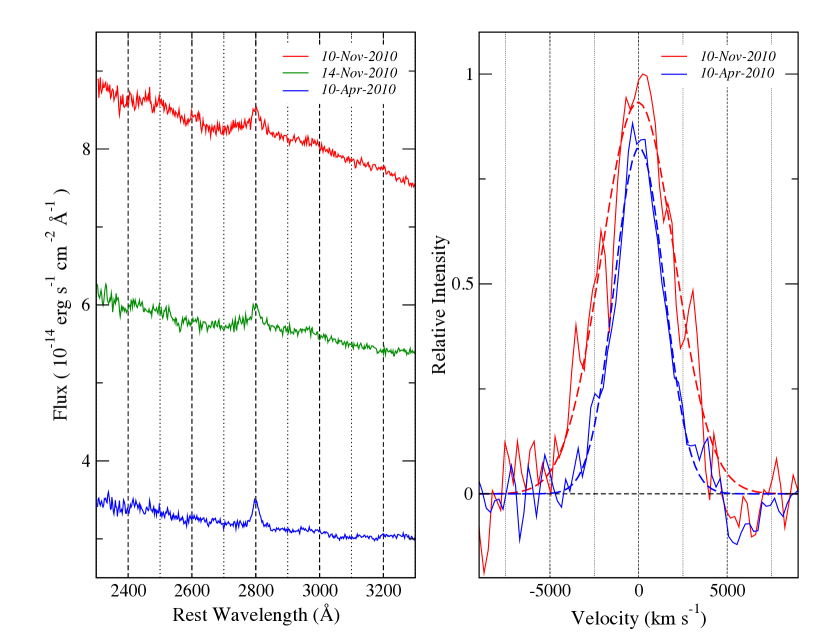

The optical spectra used in this work are taken from the Ground-based Observational Support of the Fermi Gamma-ray Space Telescope at the University of Arizona monitoring program111http://james.as.arizona.edu/?psmith/Fermi/Website, details on the observational setup and reduction process are presented in Smith et al. (2009). In this work we only consider spectra that have been calibrated against the V-band magnitude. The spectra have been brought to the rest frame of the source, a cosmological correction of the form has been performed and no correction for galactic reddening was applied. The left panel of Figure 1 displays three optical spectra of 3C 454.3 taken at three different periods of activity. Here, we present a brief description of our spectral fitting, which is based on least-squares minimization using the MPFIT package (Markwardt, 2009) and closely follows the methodology described in Torrealba et al. (2012). Firstly, the featureless continuum is approximated by a power law function and subtracted from the spectrum. Then, the optical Fe II emission is fitted using the template of Vestergaard & Wilkes (2001). After the local continuum and Fe II emission subtraction (see right panel of Figure 1), for all of the spectra, the Mg IIÅ emission line flux was measured by integrating the line profile in the range 2725-2875 Å . The spectra in our database were taken with different slit sizes (different resolutions) which prevents us to do an immediate analysis of the Mg IIÅ FWHM evolution. Therefore, we only measure the flux of Mg II line which is not affected by spectral resolution.
The errors associated with the Mg IIÅ flux measurements comprise three different error factors. The first error factor is the random error due to dispersion of the spectra and the signal to noise ratio, estimated as in Tresse et al. (1999). The second factor is the error introduced by the subtraction of Fe emission, , where is the rms of the spectrum after iron subtraction, is the line-peak in the continuum-less spectrum, is the line flux, and is the fraction of the line flux within the range of integration where no iron subtraction was performed. The ratio is basically the inverse of the S/N ratio of the line-peak, and the second term is introduced to scale the S/N to the fraction of the line flux that could be affected by the iron subtraction. The third error factor is a result of flux calibration, which is approximated by the RMS of flux measurements from contiguous observing campaigns (P. Smith, private communication). Here, we take a very conservative approach and approximate the flux calibration error by the standard deviation of the flux over the three-year monitoring period excluding the observing season showing the highest levels of Mg IIÅ line flux (). The sum of the first and second error factors is considered here as the error of measurements () and is presented in the data points shown in Figures 1 to 4 and listed in Table 1. However, the sum of all three sources of error, hereafter called total error (), is used in our statistical analysis of variability. The UV-continuum Å and Fe II fluxes are also listed in Table 1.
Figure 2 shows the multiwavelength behaviour of 3C 454.3 during the Mg IIÅ monitoring period. The gamma-ray light curve from 0.1 to 200 GeV shown in panel was built by using data from the Large Area Telescope (LAT) reduced and analyzed with the Fermi Science Tools v9r23p1 along with the latest diffuse model files. We have used the user-contributed software to generate the spectral models and produce the gamma-ray light curve. The Mg IIÅ flux evolution is shown in panel . The light curve of the Fe II emission is displayed in panel (c). The UV-continuum Å flux shown in panel has been measured from the featureless continuum after removal of Fe II template, and the error reported is the RMS of the spectrum within 2900-2950 Å. The optical linear polarization data displayed in panel was also taken from the Steward monitoring program. The -band light curve shown in panel is taken from the Yale Fermi/SMARTS project222http://www.astro.yale.edu/smarts/glast/tables/3C454.tab. The single dish monitoring data at 37 GHz (mm) presented in panel is adopted from the Metsähovi quasar monitoring program (Teraesranta et al., 1998). The vertical stripes in each panel of Figure 2 show the ejection times of new blobs from the radio core (Jorstad et al., 2012). Hereafter, we refer to radio core as the unresolved feature in mm (43 GHz) VLBI maps associated with the emergence of new superluminal components, unless the frequency of observation is explicitly stated.
3. Variability of the Mg IIÅ emission line.


The flux evolution of the integrated Mg IIÅ emission line (top panel) and the rest frame UV-continuum Å (bottom panel) are shown in Figure 3 and the data is displayed on Table 1. The significance of the fluctuations with respect to the mean flux () are shown over-plotted as dashed lines. The flux density at 37 GHz (8mm) is symbol size and color coded – the larger and lighter the symbol, the more intense the millimeter emission. Variability of the Mg IIÅ emission can be already suggested from visual inspection of the light curve and it is confirmed by the large values obtained with the MPFIT package by fitting a constant flux. Under the assumption that the Mg IIÅ light curve can be represented by a constant line, the best fit shows a value of . Hence, taking into account the degrees of freedom of the fit (Ndof = 205), the probabilities of getting this value by chance (estimated with routine MPCHITEST of MPFIT library) is . Such a small probability allows us to reject the hypothesis that the emission from the Mg IIÅ line did not vary over the last three years.
However, no evidence of statistically significant variability in the H flux of 3C 454.3 was found by Raiteri et al. (2008a) after analyzing 16 NIR spectra taken over a six-month period in 2007 (12 June - 03 November) during a faint optical state. Similar to Figure 8 of Raiteri et al. (2008a), we show the response of the Mg IIÅ line flux to the UV-continuum Å in Figure 4. The root mean square uncertainty (where are the individual errors and is the number of spectra) of the Mg IIÅ line flux is over-plotted as a dot-dashed line. As can be seen, the root mean square of the uncertainties in the measurements of the Mg IIÅ line flux is considerably smaller than its standard deviation (). Following the same reasoning that Raiteri et al. (2008a) used to discard variability in the H line emission of 3C 454.3, we then find that over the period of time considered in this work (2008-2011) the Mg IIÅ line flux variability is well resolved and therefore statistically significant.
We find that during the monitoring period, the spectral variation () of the Mg IIÅ line is 1.7. The peak-to-peak change in the Mg IIÅ light curve is 60% of the mean line flux, while the minimum and maximum Mg IIÅ line flux reached are about 20% and 40% of the mean line flux, respectively. Because of the sparsely sampled Mg IIÅ light curve we are only able to estimate an upper-limit to its variability timescale: month.
Now that we have shown that variability of Mg IIÅ in 3C 454.3 is statistically significant, it is instructive to investigate whether there is a causal link between major Mg IIÅ line flux variations and variability at other wavelengths, see Figure 2. We have also intentionally added a color bar in Fig 3 and 4 to show that the highest levels of Mg IIÅ line flux (), occurred over a short period of time (), coincide with the mm fluxes above 35 Jy (light red to yellow in color scale). The vertical stripes in Figure 2 and 3 show the times when new blobs were ejected from the radio core, thus suggesting that the highest levels of Mg IIÅ line flux occurred after the onset of a mm flare and before a new component was seen for the first time leaving the radio core. A mm flare presumably starts to rise as the moving disturbance enters the radio core (León-Tavares et al., 2011b) and by definition, the ejection time indicates when such component passed through the middle of the radio core; see Figure 3 in León-Tavares et al. (2012). Therefore, the observed causality of events suggests that the highest levels of Mg IIÅ emission line flux were reached when a superluminal jet component was traversing through the radio core
How can we be sure that the ionizing continuum was produced within the radio core and not by other thermal sources like the accretion disk? The high degree of linear polarization (see panel in Figure 2) together with the short time scale of variability and the presence of a gamma-ray counterpart, suggest that the major UV-continuum Å flare had a non-thermal origin. This can be taken as an evidence for a non-thermal source being responsible for the ionization of the BLR clouds. In further support of this suggestion, in the left panel of Figure 4 we can identify a correlation between Mg IIÅ and UV-continuum Å () which becomes significant () when the mm emission rises above 30 Jy. In addition, we also find a significant correlation between Fe II and UV-continuum Å emission (see right panel in Figure 4) in consistency with Benítez et al. (2010). The latter becomes tighter with increasing mm emission, thus also supporting the scenario in which a complex structure of the BLR is ionized by the jet. In order to determine the kinematical properties of the BLR clouds illuminated by the inner jet, we will perform a detailed analysis of the emission line profiles (studying the FHWM Mg IIÅ evolution) in a forthcoming paper.
At this point, a discerning reader might ask, why was not a Mg IIÅ flare associated to the component ejected in late 2009? Although explaining the physics of correlated multiwavelength behaviour in 3C 454.3 is out of the scope of this work (and we refer the reader to other recent studies, e.g. Bonnoli et al., 2011; Raiteri et al., 2011; Wehrle et al., 2012), we speculate that the detection of high levels of Mg IIÅ emission might be related to the amount of energy dissipated by the jet component when passing through the radio core. From Figure 2, it can be gleaned that the energy dissipation in the events of 2009 and 2010 took place downstream and upstream of the radio core, respectively. By using the maxima of UV-continuum Å emission as a proxy for the energy dissipated, we see that the event of 2010 released twice as much energy than the event from 2009. If the amount of energy released at the premises of the radio core depends on whether the energy dissipation occurs upstream or downstream of the radio core is something that deserves further investigation.
4. Summary and Discussion
The optical spectra of 3C 454.3 have been acquired, as part of the Ground-based Observational Support of the Fermi Gamma-ray Space Telescope at the University of Arizona monitoring program, over a period of three years (2008-2011) and due to its redshift () we have had access to the middle-UV region of the spectrum, allowing us to monitor its Mg IIÅ broad-emission line and adjacent UV-continuum Å. We summarize our results as follows:
-
•
We find a statistically significant flare-like event in the Mg IIÅ light curve of 3C 454.3. The maximum Mg IIÅ line flux recorded is above 40% of the mean flux and the spectral variation () of the Mg IIÅ line is 1.7. However, due to the sparsely sampled Mg IIÅ light curve we are only able to estimate an upper-limit to its variability timescale month.
-
•
The highest levels of Mg IIÅ line flux () occurred after mm flare onset, during an increase in the optical polarization percentage, before the emergence of a new superluminal component from the radio core and within the largest -ray flare ever seen. This finding crucially links the broad-emission line fluctuations to the non-thermal continuum emission produced by relativistically moving material in the jet and hence to the presence of broad-line region clouds surrounding the radio core.
The results presented above indicate that the radio core plays a pivotal role in the energy release of 3C 454.3. However, there is no general consensus about the true nature – and location – of the radio core in radio-loud AGN. Some studies propose that the radio core is a recollimation shock and a genuine stationary feature along the parsec scale jet (e.g. Gomez et al., 1995) thought to be located at a considerable distance from the black hole. On the other hand, recent observational evidence suggests that for sources with a misaligned jet (i.e. M 87) the radio core might coincide with the BH (Hada et al., 2011). Recenlty, Pushkarev et al. (2012) studied the nuclear opacity in the parsec scale jet of a large sample of AGN. The authors report that, for 3C 454.3, the distance from the radio core at 15 GHz to the apex of the jet is about 20 parsecs. Although the radio core at 43 GHz should be located closer to the BH, the findings of Pushkarev et al. (2012) encourage the view that the radio core in 3C 454.3 is located well downstream (outside) the canonical BLR.
Despite the true nature and location of the radio core in 3C 454.3 the most important implication of our main finding – jet powering broad-emission lines during intense outbursts – is the presence of broad-line region material surrounding the radio core. If the radio core is embedded within the canonical BLR, then the ionization of the BLR by the jet would make the mirror model to the production of gamma-rays as proposed by Ghisellini & Madau (1996) feasible. Moreover, a likely interaction of BLR clouds with the base of the jet might contribute to the observed levels of high-energy emission (Araudo et al., 2010; Bosch-Ramon et al., 2012). Conversely, if the radio core is located far from the BH, then broad-line region material should be present at distances of parsecs from the BH.
Observational evidence for the presence of BLR material located at parsec scales down the radio core has been found by coordinated spectroscopic and VLBI monitoring studies. More specifically, Arshakian et al. (2010) and León-Tavares et al. (2010) found that for the radio galaxies 3C 390.3 333 http://www.metsahovi.fi/~leon/movies/3c3903.gif and 3C 120 444http://www.metsahovi.fi/~leon/movies/3c120.gif the variable optical continuum starts to rise when a new superluminal component leaves the radio core seen at 15 GHz and its maximum occurs when the component passes through a stationary feature located downstream of the radio core. Since these two radio galaxies are known to reverberate (Shapovalova et al., 2010; Grier et al., 2012), in the sense that the H broad-emission line responds to changes in the optical continuum, the authors conclude that the jet can power a significant amount of broad-line emission particularly during strong continuum flares in these objects.
The above results suggest the presence of an additional component of the BLR, dubbed as outflowing BLR, which in effect might be filled with BLR material dragged by the relativistic jet as it propagates downstream of the BH or perhaps could be a sub-relativistic outflow arising from an accretion-disk wind. The notion of a dynamic and extended BLR has been previously proposed in several works (e.g. Popović et al., 2001; Elitzur & Shlosman, 2006). Although these studies have focused on non-blazar sources, the presence of an outflowing BLR has already been suggested for sources like 3C 273 (Paltani & Türler, 2003) and 3C 454.3 (Finke & Dermer, 2010) where it could serve as an alternative source of seed photons for the Inverse Compton scattering as proposed by León-Tavares et al. (2011b).
Regardless of whether the radio core is close (1 pc ) or far (1 pc) from the BH, the fact that broad-emission lines respond to changes of the non-thermal continuum prevents us to use the single epoch virial BH mass estimates in this source because the latter assumes: (i) a single localized ionization source (i.e. accretion disk) and (ii) virial equilibrium of the BLR clouds. The latter assumptions cannot be fulfilled during episodes of strong flaring activity in 3C 454.3, hence the ionization of BLR clouds by non-thermal emission might introduce uncertainties to the BH mass estimates derived by assuming virial equilibrium of the BLR. Alternative scaling relations to weigh the BH in strongly beamed sources are discussed and implemented in León-Tavares et al. (2011a).
| JD-2450000 | Mg IIÅ | Fe II | UV-continuum Å | |||
|---|---|---|---|---|---|---|
| flux (10-13 erg cm-2 s-1) | error | flux (10-13 erg cm-2 s-1 ) | error | flux(10-14 erg cm-2 s-1 Å-1 ) | error | |
| 4743.8350 | 1.412 | 0.019 | 2.418 | 0.478 | 1.759 | 0.005 |
| 4745.7251 | 1.261 | 0.016 | 1.962 | 0.476 | 1.698 | 0.005 |
| 4746.7104 | 1.248 | 0.018 | 2.094 | 0.477 | 1.648 | 0.005 |
| 4747.8491 | 1.199 | 0.016 | 2.333 | 0.474 | 1.850 | 0.005 |
| 4748.7373 | 1.336 | 0.028 | 2.164 | 0.479 | 2.159 | 0.009 |
| 4767.6724 | 1.322 | 0.016 | 2.389 | 0.473 | 0.864 | 0.005 |
| 4768.6597 | 1.357 | 0.018 | 2.416 | 0.473 | 0.971 | 0.006 |
| 4769.8086 | 1.321 | 0.014 | 2.308 | 0.474 | 0.923 | 0.004 |
| 4770.7051 | 1.320 | 0.016 | 2.101 | 0.475 | 0.821 | 0.004 |
| 4772.6831 | 1.327 | 0.014 | 2.020 | 0.474 | 0.788 | 0.004 |
Note. — Table 1 is published in its entirely in the electronic edition of the Astrophysical Journal Letters. A portion is shown here for guidance regarding its form and content.
References
- Ackermann et al. (2010) Ackermann, M., Ajello, M., Baldini, L., et al. 2010, ApJ, 721, 1383
- Angione (1968) Angione, R. J. 1968, PASP, 80, 339
- Araudo et al. (2010) Araudo, A. T., Bosch-Ramon, V., & Romero, G. E. 2010, A&A, 522, A97
- Arshakian et al. (2010) Arshakian, T. G., León-Tavares, J., Lobanov, A. P., et al. 2010, MNRAS, 401, 1231
- Benítez et al. (2010) Benítez, E., Chavushyan, V. H., Raiteri, C. M., et al. 2010, in Astronomical Society of the Pacific Conference Series, Vol. 427, Accretion and Ejection in AGN: a Global View, ed. L. Maraschi, G. Ghisellini, R. Della Ceca, & F. Tavecchio, 291
- Bonning et al. (2009) Bonning, E. W., Bailyn, C., Urry, C. M., et al. 2009, ApJ, 697, L81
- Bonnoli et al. (2011) Bonnoli, G., Ghisellini, G., Foschini, L., Tavecchio, F., & Ghirlanda, G. 2011, MNRAS, 410, 368
- Bosch-Ramon et al. (2012) Bosch-Ramon, V., Perucho, M., & Barkov, M. V. 2012, A&A, 539, A69
- Elitzur & Shlosman (2006) Elitzur, M., & Shlosman, I. 2006, ApJ, 648, L101
- Finke & Dermer (2010) Finke, J. D., & Dermer, C. D. 2010, ApJ, 714, L303
- Foschini et al. (2010) Foschini, L., Tagliaferri, G., Ghisellini, G., et al. 2010, MNRAS, 408, 448
- Fuhrmann et al. (2006) Fuhrmann, L., Cucchiara, A., Marchili, N., et al. 2006, A&A, 445, L1
- Gaur et al. (2012) Gaur, H., Gupta, A. C., & Wiita, P. J. 2012, AJ, 143, 23
- Ghisellini & Madau (1996) Ghisellini, G., & Madau, P. 1996, MNRAS, 280, 67
- Giommi et al. (2006) Giommi, P., Blustin, A. J., Capalbi, M., et al. 2006, A&A, 456, 911
- Gomez et al. (1995) Gomez, J. L., Marti, J. M. A., Marscher, A. P., Ibanez, J. M. A., & Marcaide, J. M. 1995, ApJ, 449, L19
- Grier et al. (2012) Grier, C. J., Peterson, B. M., Pogge, R. W., et al. 2012, ApJ, 755, 60
- Hada et al. (2011) Hada, K., Doi, A., Kino, M., et al. 2011, Nature, 477, 185
- Jorstad et al. (2010) Jorstad, S. G., Marscher, A. P., Larionov, V. M., et al. 2010, ApJ, 715, 362
- Jorstad et al. (2012) Jorstad, S. G., Marscher, A. P., Joshi, M., et al. 2012, ArXiv e-prints, arXiv:1205.0520
- León-Tavares et al. (2010) León-Tavares, J., Lobanov, A. P., Chavushyan, V. H., et al. 2010, ApJ, 715, 355
- León-Tavares et al. (2011a) León-Tavares, J., Valtaoja, E., Chavushyan, V. H., et al. 2011a, MNRAS, 411, 1127
- León-Tavares et al. (2012) León-Tavares, J., Valtaoja, E., Giommi, P., et al. 2012, ApJ, 754, 23
- León-Tavares et al. (2011b) León-Tavares, J., Valtaoja, E., Tornikoski, M., Lähteenmäki, A., & Nieppola, E. 2011b, A&A, 532, A146
- Markwardt (2009) Markwardt, C. B. 2009, in Astronomical Society of the Pacific Conference Series, Vol. 411, Astronomical Data Analysis Software and Systems XVIII, ed. D. A. Bohlender, D. Durand, & P. Dowler, 251
- Paltani & Türler (2003) Paltani, S., & Türler, M. 2003, ApJ, 583, 659
- Pauliny-Toth et al. (1987) Pauliny-Toth, I. I. K., Porcas, R. W., Zensus, J. A., et al. 1987, Nature, 328, 778
- Popović et al. (2001) Popović, L. Č., Stanić, N., Kubičela, A., & Bon, E. 2001, A&A, 367, 780
- Poutanen & Stern (2010) Poutanen, J., & Stern, B. 2010, ApJ, 717, L118
- Pushkarev et al. (2012) Pushkarev, A. B., Hovatta, T., Kovalev, Y. Y., et al. 2012, A&A, 545, A113
- Raiteri et al. (2008a) Raiteri, C. M., Villata, M., Larionov, V. M., et al. 2008a, A&A, 491, 755
- Raiteri et al. (2008b) Raiteri, C. M., Villata, M., Chen, W. P., et al. 2008b, A&A, 485, L17
- Raiteri et al. (2011) Raiteri, C. M., Villata, M., Aller, M. F., et al. 2011, A&A, 534, A87
- Sasada et al. (2012) Sasada, M., Uemura, M., Fukazawa, Y., et al. 2012, PASJ, 64, 58
- Shapovalova et al. (2010) Shapovalova, A. I., Popović, L. Č., Burenkov, A. N., et al. 2010, A&A, 517, A42
- Sikora et al. (2008) Sikora, M., Moderski, R., & Madejski, G. M. 2008, ApJ, 675, 71
- Smith et al. (2009) Smith, P. S., Montiel, E., Rightley, S., et al. 2009, ArXiv e-prints, arXiv:0912.3621
- Striani et al. (2010) Striani, E., Vercellone, S., Tavani, M., et al. 2010, ApJ, 718, 455
- Tavecchio et al. (2010) Tavecchio, F., Ghisellini, G., Bonnoli, G., & Ghirlanda, G. 2010, MNRAS, 405, L94
- Teraesranta et al. (1998) Teraesranta, H., Tornikoski, M., Mujunen, A., et al. 1998, A&AS, 132, 305
- Tornikoski et al. (1994) Tornikoski, M., Valtaoja, E., Terasranta, H., et al. 1994, A&A, 289, 673
- Torrealba et al. (2012) Torrealba, J., Chavushyan, V., Cruz-González, I., et al. 2012, RevMexAA, 48, 9
- Tresse et al. (1999) Tresse, L., Maddox, S., Loveday, J., & Singleton, C. 1999, MNRAS, 310, 262
- Vercellone et al. (2008) Vercellone, S., Chen, A. W., Giuliani, A., et al. 2008, ApJ, 676, L13
- Vercellone et al. (2011) Vercellone, S., Striani, E., Vittorini, V., et al. 2011, ApJ, 736, L38
- Vestergaard & Wilkes (2001) Vestergaard, M., & Wilkes, B. J. 2001, ApJS, 134, 1
- Wehrle et al. (2012) Wehrle, A. E., Marscher, A. P., Jorstad, S. G., et al. 2012, ApJ, 758, 72