Crystalline Silicates in Evolved Stars. I.
Spitzer/IRS Spectroscopy of
IRAS 16456-3542, 18354-0638, and 23239+5754
DRAFT:
Abstract
We report the Spitzer Infrared Spectrograph (IRS) observations of three evolved stars: IRAS 16456-3542, 18354-0638, and 23239+5754. The 9.9–37.2 Spitzer/IRS high resolution spectra of these three sources exhibit rich sets of enstatite-dominated crystalline silicate emission features. IRAS 16456-3542 is extremely rich in crystalline silicates, with 90% of its silicate mass in crystalline form, the highest to date ever reported for crystalline silicate sources.
1 Introduction
The field of circumstellar silicate research started in the 1960s when Kamijo (1963) first theoretically investigated the condensation of dust grains in the circumstellar envelopes around M type long period variables and argued that silica (SiO2) should be the most abundant condensed species. Gilman (1969) showed several years later that grains around oxygen-rich cool giants are mainly silicates such as Al2SiO3 and Mg2SiO4. The presence of silicate dust in evolved stars was first revealed through the detection of the 9.7 Si–O stretching emission band in M stars (Woolf & Ney, 1969). This was later further supported by the detection of the 18 O–Si–O bending emission band, also in M stars (Treffers & Cohen, 1974). The 9.7 and 18 silicate bands have also been seen in absorption in evolved stars with an extended, heavily obscured circumstellar dust shell (see Jones & Merrill 1976; Bedijn 1987 and references therein).
All the earlier observations showed that the 9.7 and 18 circumstellar silicate bands were broad, smooth and featureless, suggesting that they were predominantly amorphous (Molster & Kemper, 2005).111The atoms in an amorphous silicate grain are arranged in a random manner. In contrast, in crystalline silicates, the highly ordered counterparts of amorphous silicates, the atoms are arranged in an ordered lattice structure. Indeed, they can be well fitted with laboratory data for amorphous olivine silicates (e.g. see Dorschner et al. 1995). This picture has dramatically changed in the 1990s, thanks to the Infrared Space Observatory (ISO) and the Spitzer Space Telescope. Using the Short Wavelength Spectrometer (SWS) on board ISO, Waters et al. (1996) obtained the 12–45 emission spectra of six oxygen-rich evolved stars. They for the first time reported the detection of crystalline silicates in evolved stars, as revealed by the narrow emission features characteristic of crystalline silicate minerals at wavelengths between 30 and 45.
Crystalline silicates have now been observed in all evolutionary stages of evolved stars: red giants and supergiants, asymptotic giant branch (AGB) stars, post-AGB stars, planetary nebulae (PNe) and luminous blue variable (LBV) stars222LBV stars are very bright, massive, short-lived, hypergiant variable stars, with a luminosity exceeding , a mass up to 150, and a lifetime of only a few million years. LBVs are a stage in the evolution of very massive stars. They may evolve to Wolf-Rayet stars before exploding into supernovae. (Waters et al., 1996, 1999; Sylvester et al., 1999; Molster et al., 2002a, b, c). Extragalactic crystalline silicates have also been found in evolved stars by Spitzer in the Large Magellanic Cloud (e.g. Kastner et al. 2006; Sloan et al. 2006, 2008; Zijlstra et al. 2006) and in R 71, a LBV star by ISO (Voors et al., 1999). We note that like amorphous silicates, crystalline silicates are usually found in oxygen-rich environments (Molster & Kemper, 2005).333In an oxygen-rich environment, the C/O ratio is smaller than one. All carbon atoms will be bound in CO and there will be some extra oxygen atoms left to form silicates and oxides (Gail, 2010). In contrast, if the circumstellar envelope around an evolved star is carbon-rich (i.e. C/O 1), all oxygen atoms will be bound in CO and therefore no silicates or oxides will be able to form; instead, one expects to form carbonaceous dust and SiC dust (Gail, 2010). However, the presence of crystalline silicates in carbon-rich evolved stars has also been reported (Waters et al., 1998a, b; Molster et al., 2001). In these cases the crystalline silicate grains were likely produced in previous oxygen-rich mass-loss episodes (Molster & Kemper, 2005; Henning, 2010).
The identification of circumstellar crystalline silicates has been made based on the characteristic mid-IR bands of crystalline silicates. The ISO SWS and LWS (Long Wavelength Spectrometer) spectra of evolved stars in the 2.4 to 195 wavelength region allow one to identify at least 49 narrow bands which are attributed to crystalline silicates, with distinct emission bands at approximately 10, 18, 23, 28, 33, 40 and 60 (Molster et al., 2002a, b). The widths and peak wavelengths of these bands and their relative strengths contain useful information about the crystalline silicate composition (e.g. the Fe/Mg ratio) and stoichiometry (e.g. olivine or pyroxene where ; see Koike et al. 1993; Jaeger et al. 1998). The mid-IR spectra of evolved stars obtained by ISO and Spitzer so far indicate that circumstellar crystalline silicates all appear to be extremely Mg-rich and Fe-poor or even Fe-free (i.e. forsterite or enstatite ; see Molster & Kemper 2005; Henning 2010).
However, there are several outstanding problems about crystalline silicates remain to be addressed: First, the exact composition and stoichiometry of crystalline silicate dust in evolved stars are not precisely known. Second, the mechanism for making circumstellar crystalline silicates remains debated. Third, it is unclear whether (and how) the fraction of silicate dust in crystalline form depends on the mass loss rate, the temperature of the circumstellar dust shell, and the evolutionary stage of an evolved star (Kemper et al., 2001; Molster & Kemper, 2005; Wooden, 2008; Henning, 2010). It has also been suggested that high crystallinity ( 10%) is typically associated with the presence of a disk, rather than being correlated with the mass-loss rate (Kemper et al., 2001; Molster & Kemper, 2005). Further, it is widely believed that interstellar dust originates from stardust produced by evolved stars.444But also see Draine (2009) and Zhukovska et al. (2008) who argued that the dust in the interstellar medium (ISM) is not really “stardust” but condensed in the ISM as the interstellar dust destruction rates are higher than the injection rates of stardust into the ISM (Jones et al., 1994). It is puzzling that interstellar silicates are predominantly amorphous (Kemper et al., 2004; Li & Draine, 2001; Li et al., 2007) while an appreciable fraction of circumstellar silicates – the primary source of interstellar dust – are crystalline.
To improve our understanding of these questions, we plan to systematically explore the spectroscopic properties of astronomical crystalline silicates and their formation, evolution, and dependence on the properties of the parent stars as well as their relevance to interstellar silicates. In this work we present the Spitzer/IRS spectra of three evolved objects (IRAS 16456-3542, 18354-0638, and 23239+5754) all of which display rich sets of crystalline silicate emission features. This is a part of our ongoing efforts for a systematic investigation of crystalline silicates in evolved stars.
2 Observation and Data Reduction
The data were obtained through the Spitzer Cycle 3 GO proposal (Spitzer Program ID 30403; PI: Biwei Jiang).555See http://adsabs.harvard.edu/abs/2006sptz.prop30403J. Sixteen evolved objects (post-AGB stars and PNe) have been observed through this program. They were selected from the Infrared Astronomical Satellite (IRAS) Point Source Catalog (PSC), with their IRAS color indices satisfying and . This is to exclude young stellar objects (YSOs) or galaxies and limit us to evolved stars (van der Veen & Habing, 1988). In this work we focus on the three sources (IRAS 16456-3542, 18354-0638, and 23239+5754) whose mid-IR spectra are characterized by rich sets of crystalline silicate emission features. The other (13) objects will be discussed elsewhere. In Table 1 we list their IR brightness (and thus colors) and their SIMBAD classification.
These sources were observed using the Infrared Spectrograph (IRS) on board Spitzer with the Short-High (SH) and Long-High (LH) modules during Cycle 3 from June 2006 to May 2007. The data were taken in ‘staring mode’ at two nod positions along each IRS slit. Thanks to the anticipated high brightness of the sources, no specific off-set observations for measuring the background were needed. The journal of observation is shown in Table 2.
We start the data processing from the Spitzer Science Center’s pipeline data set (version S16.1.0). The program is used to combine unflatfielded image (droopres) and the rogue pixels image from the same campaign for a compound mask, afterwards this combined mask is applied to the flatfielded image (bcd) to remove rogue and flagged pixels as much as possible. The spectra are extracted from the cleaned image in the SPICE software package and further analysis is done in the SMART (version 6.2.6) package.
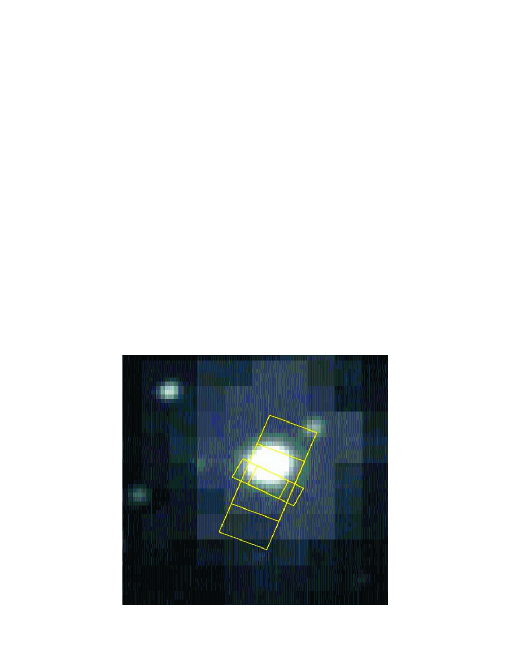
Since the LH aperture (11.122.3) is larger than the SH aperture (4.711.3) and it is likely that some sources are so extended that unlike the LH slit, the SH slit could not cover the entire emission area, one sometimes need to multiply a scaling factor in order for the SH flux to agree with the flux of the LH part. The consequence of the aperture difference shows up clearly in IRAS 23239+5754, for which the SH spectrum must be multiplied by a factor of 5.2 to agree with the LH flux at the overlap part and for the whole spectrum to be consistent with the previous MSX (Midcourse Space Experiment) and IRAS photometry. As shown in Figure 1, for IRAS 23239+5754 the SH slit covers less than half of the emission range while the LH slit covers most of the emission area, confirming a factor of 5.2 difference. The flux matching between the SH part and the LH part is much better for IRAS 16456-3542, and 18354-0638. We just need a scale factor of 1.2–1.3.
The reduced spectra of these three sources are displayed in Figure 2, where the objects are ordered in terms of their evolutionary classes: post-AGB stars and PNe. Based on their ionized nebular emission lines, we classify IRAS 16456-3542 and 23239+5754 as PNe, consistent with the previous classifications in the literature. For the sources lack of nebular lines, they are commonly considered either as post-AGB stars or as extremely evolved AGB stars.666The AGB and post-AGB distinction is made based on previous studies available in the literature as the Spitzer spectra provide no further decisive information for this classification. In this context we classify IRAS 18354-0638 as a post-AGB star (see §3.1).
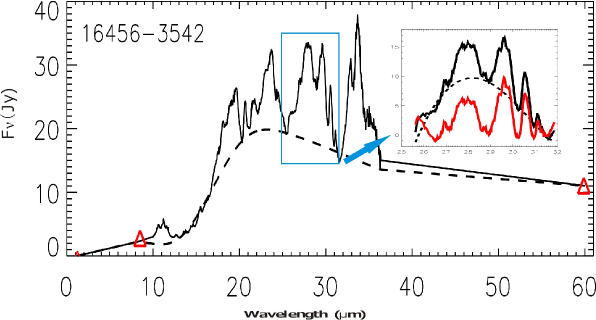
The IRS wavelength range between 9.9 and 37.2 is full of spectral features arising from crystalline silicates. In order to clearly illustrate the crystalline silicate features, We try to subtract the underlying continuum. Instead of adopting a single-temperature blackbody spectrum, we simply fit the global continuum by a mathematical spline function. This approach was taken by Molster et al. (2002b) in a comprehensive analysis of the ISO spectra of 17 oxygen-rich circumstellar dust shells surrounding evolved stars. For an overview of the IR spectral energy distribution (SED), previous photometric data, in the 2MASS J band, MSX A band777The MSX A (msxA), B1 (msxB1), B2 (msxB2), C (msxC), D (msxD), and E (msxE) bands respectively peak at 8.28, 4.29, 4.35, 12.13, 14.65, and 21.34 (Egan & Price, 1996). and IRAS 60 band, are supplemented. The continuum is then maximized and subtracted. In principle, the strength of the features might be underestimated since there is a possibility that very broad features are mistaken as continuum. After this global continuum subtraction, one more step is taken to remove the “local continuum” by a third-order polynomial. The so-called “local continuum” refers to the part that is above the global continuum while below the minimum of the features. This step would possibly further underestimate the strengths of the features. Figure 3 is an example for subtracting the continuum underneath the spectral features.
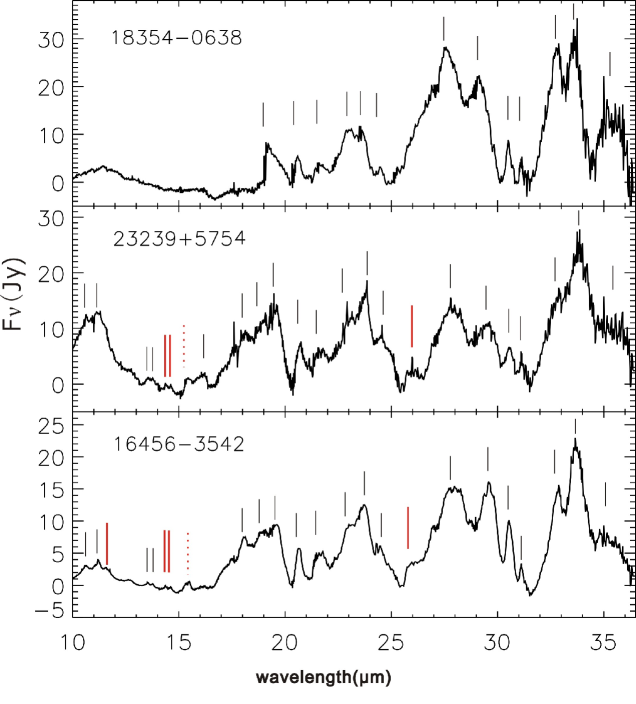
Figure 4 displays the continuum-subtracted spectral features of these three sources (IRAS 16456-3542, 18354-0638, and 23239+5754). Table 3 lists the peak wavelengths and FWHM (full width half maximum) of the crystalline silicate features derived from a Gaussian fitting. The spectral features are compared with the ISO spectrum of NGC 6302, a PN (Molster et al., 2002b). The features previously identified in the Molster sample are labeled by thin vertical lines.
Probably due to the high resolution and sensitivity of Spitzer/IRS, several “new features” (labeled by thick vertical lines in Figure 4) appear to be present in the IRS spectra of these sources: (1) the 11.6 feature seen in IRAS 16456-3542, (2) the 14.4 feature (or the 14.6 feature) seen in IRAS 16456-3542 and IRAS 23239+5754, (3) the 15.4 feature seen in IRAS 23239+5754 and in IRAS 16456-3542,888We cannot exclude the possibility that this feature may be the same as the 15.2 feature reported in Molster et al. (2002b). and (4) the 25.47 feature in IRAS 23239+5754 (or the 25.85 feature in IRAS 16456-3542). These “new features” have not previously been reported in the literature. A more detailed study of a large sample of both astronomical and laboratory crystalline silicate spectra is necessary for confirming these “new” features.
3 Results: Remarkably Rich Spectra of Crystalline Silicates at 10–37
3.1 Overview of the Three Objects Rich in Crystalline Silicates
The three sources which show abundant features of crystalline silicates are IRAS 16456-3542, 18354-0638, and 23239+5754. We discuss these objects below, in the order of their evolutionary stages.
-
1.
IRAS 18354-0638. The Spitzer/IRS spectrum of this source exhibits one nebular line (i.e. [SIII] at 33.5) which may suggest the start of a nebular phase. We hesitate to classify it as a PN because PNe usually exhibit 3 nebular lines (while IRAS 18354-0638 displays only one emission line). We classify it as a post-AGB star.999We note that this star is not in the Torún catalog of post-AGB stars (Szczerba et al., 2007). In comparison with the other two objects (IRAS 23239+5754 and 16456-3542; see below) which display abundant crystalline silicate features and are classified as PNe, this object seems to be at an earlier stage of evolution (i.e. extreme AGB or post-AGB).
-
2.
IRAS 23239+5754. This object is a very young bipolar PN with a complex inner structure inside the bipolar lobes. The effective temperature of the central star is about (Preite-Martinez & Pottasch, 1983). The mean temperature of the bulk dust in the circumstellar shell is 200 K, as estimated from the overall IR spectral energy distribution (Zhang & Kwok, 1990). Several nebular lines (e.g., [SIV] at 10.5, [NeII] at 12.8, [SIII] at 18.7, [SIII] at 33.48, and [NeIII] at 36.0) clearly show up in its IRS spectrum. This source is well known for its pure fluorescent H2 emission in the near IR wavelength region (Ramsay et al., 1993). It has long been suspected to be a binary.
Also known as Hubble 12 at a distance of 3 kpc (Kingsburgh & Barlow, 1992), this PN, in particular its multiple coaxial rings in the whole-scale bipolar structure, has been well studied in the literature (see e.g. Kwok & Hsia 2007 and references therein). The shape of this object reveals that it is probably at a very early PN phase, with a kinematic age of 300 years (Miranda & Solf, 1989). The multiple rings extend about 4 8. This size is comparable to the aperture of the IRS SH slit (3.7 11.3) and much smaller than the IRS LH slit (11.1 22.3). As discussed in §2, this explains the discrepancy between the SH and LH fluxes.
-
3.
IRAS 16456-3542. This object is also known as PN G347.4+05.8 and H1-2. Its central star is a “Weak Emission-Line Star” (WELS; Gesicki et al. 2006). With a dynamical age of 1400 years (Gesicki et al., 2006), it is a young PN (but more evolved than IRAS 23239+5754). Phillips (2002) derived a distance of 2.47 kpc, but larger distances have also been suggested (e.g., 6.96 kpc [Zhang (1995)], 9.01 kpc [Phillips (2004)]). In addition to the crystalline silicate bands, this object also emits at the 11.3, 12.7 and 16.4 PAH bands (see Figure 2).
3.2 Percentages of Crystalline Silicates
To derive the mass percentage of crystalline silicates, we follow Molster et al. (2002c) to apply a simple dust emission model to fit the observed IRS spectra (including the continuum underlying the crystalline silicate features). This model assumes that the dust shell is optically thin in the IR. The SED is then fitted with mass absorption coefficients multiplied by blackbody functions :
| (1) |
The dust species considered here include: (1) amorphous silicate,101010For IRAS 18354-0638 amorphous carbon fits better than amorphous silicates. For this object, the crystalline fraction is the mass fraction of crystalline silicate relative to the total dust mass. (2) forsterite, and (3) enstatite. For each species, we consider both a cool component and a warm component respectively at temperature and .111111The dust temperature is treated as a free parameter in the range of . We start with a single-temperature component and then add a component at another temperature to see if the reduced significantly drops. The mass of dust species , , is a multiplication factor related to the total mass and only represents the relative mass ratio.121212To derive the true dust mass, the knowledge of the distance of the object is required. The relative mass ratio of different components does not depend on the distance and can be correctly determined in this way.
The absorption coefficient of amorphous silicate is calculated from the optical constants of Ossenkopf et al. (1992) with Mie theory, assuming the dust to be spherical with radii = 0.1, the typical size of interstellar dust.131313The 9.7 amorphous silicate band in our sources is better fitted in terms of small-sized grains than large ones. For the minerals (forsterite and enstatite), the optical properties measured in laboratory depend on the size, shape, structure and chemical composition of the dust analog. We adopt those of Koike et al. (1999) because their coefficients closely resemble the IRS spectra of our sources.
The relative mass of each component (amorphous silicate, forsterite and enstatite) is treated as a free parameter. For enstatite, we consider two sub-types: clino-enstatite and ortho-enstatite. Following Molster et al. (2002c), we assume equal mass of ortho- and clino-enstatite.141414Enstatite emits at 20.65 and 21.7 (Molster et al., 1999). The relative strengths of these two features show a notable difference between clino-enstatite and ortho-enstatite: for clino-enstatite they are about equally narrow, while for ortho-enstatite the 21.7 feature is stronger and broader than the 20.65 feature. The 20.65 and 21.7 features are comparably narrow in the three sources considered here and in AFGL 4106, the source in which these two features were first identified by Molster et al. (1999).
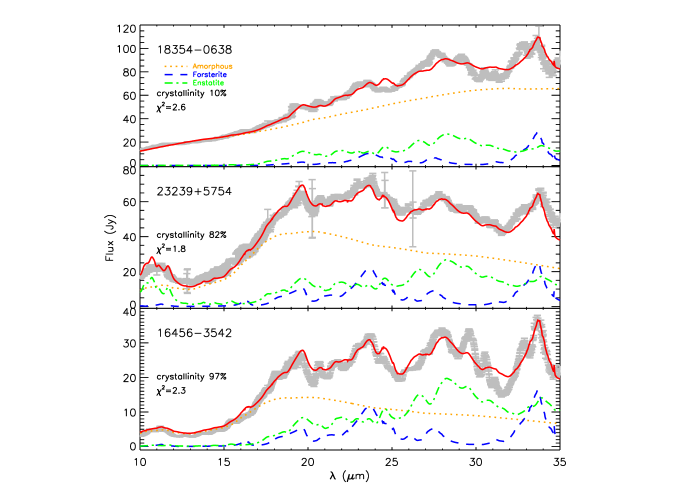
We take the Levenberg-Marquart minimization algorithm to obtain the best-fit. The results of the SED fitting are shown in Figure 5 and the parameters are listed in Table 4. The mass percentage of crystalline silicates is , and respectively for IRAS 18354-0638 (see Footnote 10), 23239+5754 and 16456-3542. Except for IRAS 18354-0638, the fraction of crystalline silicate is much higher than the average of 10% in evolved stars (Kemper et al., 2001), and the amount of crystalline silicate even exceeds amorphous silicate. In IRAS 16456-3542, the fraction of crystalline silicate reaches 97%, which exceeds the highest crystalline fraction measured so far from the crystalline silicate emission spectra (75% in IRAS 09425-6040 Molster et al. 2001).151515Several crystalline silicate absorption features were detected recently in a distant absorber at 0.89 toward PKS 1830-211, a gravitationally lensed quasar (Aller et al., 2012). The crystalline fraction derived from the absorption spectrum of this object may be 95%. Even when we take into account the uncertainty ( 5%) in the modeling, the fraction of crystalline silicate in this source is one of the highest. We conclude that there must be some evolved stars in which the silicates are even completely crystallized.
Under the assumption that the crystalline silicate in the evolved stars has only two forms: enstatite and forsterite, the mass ratio of the two forms is approximately 4, 54 and 24 respectively in these three sources, implying that the main form of crystalline silicate is enstatite i.e. MgSiO3. Enstatite accounts for more than two-thirds of the crystalline silicate dust. This result is consistent with Molster et al. (2002c) who found the enstatite to forsterite mass ratio is between 1 and 11.4 for 12 evolved objects.
4 Discussion
The model fit presented in §3.2 shows that although most of the crystalline silicate features can be fitted reasonably well in terms of two silicate mineral types (i.e. forsterite and enstatite), some features are not well fitted (see Figure 5). Most noticeably, the feature at 32.7, prominent in all three sources and particularly strong in IRAS 18354-0638 (in which the 32.7 feature is nearly as strong as the 33.5 feature), is not accounted for by the current model consisting of forsterite and enstatite minerals. Similarly, the model fails in predicting the features at 29.6, 30.6 and 31.1 seen in all three sources (see Figure 5). We note that the 29.6, 30.6 and 31.1 features seem to comprise a group as they have similar relative intensities in all three sources, with the 29.6 feature being the strongest and the 31.1 feature being the weakest. Such a phenomenon was also seen in the larger sample of Molster et al. (2002a). One may speculate that these features arise from a dust mineral other than enstatite and forsterite. It is also interesting to note that the overall spectral features at 10–35 of IRAS 23239+5754 and IRAS 16456-3542 are similar to each other (probably because they are both very young PNe), except that the 29.6 feature is much stronger in the older PN IRAS 16456-3542 than that in the younger PN IRAS 23239+5754.
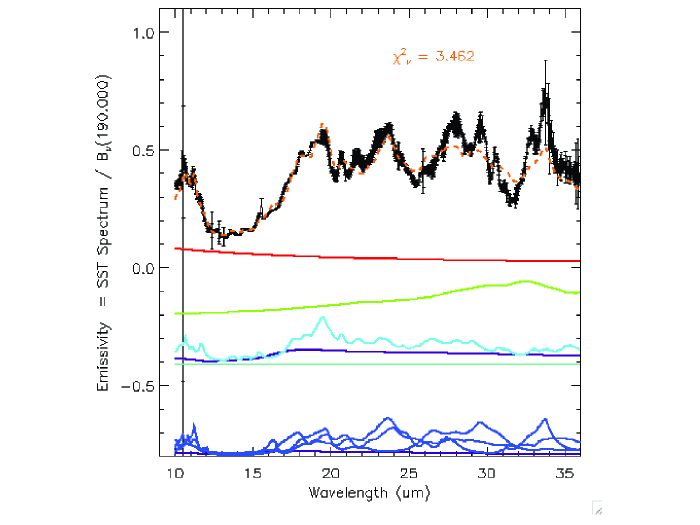
In summary, the modeling approach discussed in §3.2 assumes three grain types: (1) spherical amorphous silicates of radii = 0.1 with the indices of refraction taken from Ossenkopf et al. (1992); (2) crystalline forsterite and (3) crystalline enstatite for which the mass absorption coefficients are taken from Koike et al. (1999).161616For crystalline forsterite and enstatite we do not need to assume grain size, shape, etc. For each grain type, two temperatures are assumed (i.e. a cold component and a warm component) unless a single temperature model results in more or less the same . To examine whether the silicate crystallinity derived in §3.2 is dependent on the modeling technique, we take a different approach: we follow the approach documented in detail by Lisse et al. (2007, 2008) and incorporate more sizes and more silicate mineral compositions. The detailed mineralogy of the dust is determined by comparing the observed Spitzer/IRS spectrum to a wide range of plausible silicate minerals with high-quality mid-IR transmission and thermal emission laboratory spectra. The calculated model flux from each mineralogical component is the product of a blackbody of characteristic temperature times the experimentally determined absorption efficiency for each sized particle, summed over all particles in the dust population. For illustration, in Figure 6 we show the Spitzer/IRS spectrum of IRAS 16456-3542 and the model spectrum as well as the appropriately scaled contributions from each grain species. The overall fit is reasonably good, although not as good as that described in §3.2 (see Figure 5). The derived silicate crystallinity is 90%, consistent with the silicate crystallinity of 97% derived in §3.2.
Finally, we note that various techniques have been proposed in the literature to fit the crystalline silicate emission spectra (e.g., Molster et al. 2002a; Honda et al 2004; Sargent et al. 2006; Lisse et al. 2007; Gielen et al. 2008). All these approaches treat dust size, composition and temperature as free parameters. This is physically incorrect (see Li et al. 2004). The equilibrium temperature of dust is sensitive to its size and composition: smaller grains have higher temperatures, and silicates with a higher Fe/Mg ratio have higher temperatures. The dust temperature is also sensitive to the distance from the dust to the illuminating source (see Li et al. 2004). Therefore, one cannot treat the dust temperature as an adjustable parameter independent of the dust composition and size. The dust mass is very sensitive to the dust temperature. The crystalline fraction derived from all the approaches in which the dust temperature is treated as a free parameter should be taken with caution. The correct approach should physically calculate the dust temperature for a given dust size of a given composition at a given distance from the illuminating source (e.g., see Li & Greenberg 1998; Chen et al. 2007).
5 Summary
We report the 9.9–37.2 spectra of three evolved objects (post-AGB stars and PNe) using the high-resolution mode of the IRS instrument on board Spitzer. These objects exhibit rich sets of crystalline silicate emission features. These features are fitted by a mixture of three dust species: amorphous silicate, crystalline forsterite, and crystalline enstatite, with each species consisting of a warm component and a cold component. It is found that the crystalline silicates are dominated by crystalline enstatite. The crystalline silicate spectral modeling shows that IRAS 16456-3542, has a degree of silicate crystallinity (i.e. mass fraction of silicate dust in crystalline form) of 97%, the highest to date in crystalline silicate sources.
References
- Aller et al. (2012) Aller, M. C., Kulkarni, V. P., York, D. G., Vladilo, G., Welty, D. E., & Som, D. 2012, ArXiv e-prints
- Bedijn (1987) Bedijn, P. J. 1987, A&A, 186, 136
- Chen et al. (2007) Chen, C. H., Li, A., Bohac, C., Kim, K. H., Watson, D. M., van Cleve, J., Houck, J., Stapelfeldt, K., Werner, M. W., Rieke, G., Su, K., Marengo, M., Backman, D., Beichman, C., & Fazio, G. 2007, ApJ, 666, 466
- Dorschner et al. (1995) Dorschner, J., Begemann, B., Henning, T., Jaeger, C., & Mutschke, H. 1995, A&A, 300, 503
- Draine (2009) Draine, B. T. 2009, in Astronomical Society of the Pacific Conference Series, Vol. 414, Cosmic Dust - Near and Far, ed. T. Henning, E. Grün, & J. Steinacker, 453
- Egan & Price (1996) Egan, M. P., & Price, S. D. 1996, AJ, 112, 2862
- Gail (2010) Gail, H.-P. 2010, in Lecture Notes in Physics, Berlin Springer Verlag, Vol. 815, Lecture Notes in Physics, Berlin Springer Verlag, ed. T. Henning, 61–141
- Gesicki et al. (2006) Gesicki, K., Zijlstra, A. A., Acker, A., Górny, S. K., Gozdziewski, K., & Walsh, J. R. 2006, A&A, 451, 925
- Gielen et al. (2008) Gielen, C., van Winckel, H., Min, M., Waters, L. B. F. M., & Lloyd Evans, T. 2008, A&A, 490, 725
- Gilman (1969) Gilman, R. C. 1969, ApJ, 155, L185
- Henning (2010) Henning, T. 2010, ARA&A, 48, 21
- Honda et al (2004) Honda, M., Kataza, H., Okamoto, Y. K., Miyata, T., Yamashita, T., Sako, S., Fujiyoshi, T., Ito, M., Okada, Y., Sakon, I., & Onaka, T. 2004, ApJ, 610, 49
- Jaeger et al. (1998) Jaeger, C., Molster, F. J., Dorschner, J., Henning, T., Mutschke, H., & Waters, L. B. F. M. 1998, A&A, 339, 904
- Jones et al. (1994) Jones, A. P., Tielens, A. G. G. M., Hollenbach, D. J., & McKee, C. F. 1994, ApJ, 433, 797
- Jones & Merrill (1976) Jones, T. W., & Merrill, K. M. 1976, ApJ, 209, 509
- Kamijo (1963) Kamijo, F. 1963, PASJ, 15, 440
- Kastner et al. (2006) Kastner, J. H., Buchanan, C. L., Sargent, B., & Forrest, W. J. 2006, ApJ, 638, L29
- Kemper et al. (2004) Kemper, F., Vriend, W. J., & Tielens, A. G. G. M. 2004, ApJ, 609, 826
- Kemper et al. (2001) Kemper, F., Waters, L. B. F. M., de Koter, A., & Tielens, A. G. G. M. 2001, A&A, 369, 132
- Kingsburgh & Barlow (1992) Kingsburgh, R. L., & Barlow, M. J. 1992, MNRAS, 257, 317
- Koike et al. (1993) Koike, C., Shibai, H., & Tuchiyama, A. 1993, MNRAS, 264, 654
- Koike et al. (1999) Koike, C., Tsuchiyama, A., Suto, H., & et al. 1999, in Proc. of the 32nd ISAS Lunar and Planetary Symposium, 32, 175
- Kwok & Hsia (2007) Kwok, S., & Hsia, C. H. 2007, ApJ, 660, 341
- Li & Draine (2001) Li, A., & Draine, B. T. 2001, ApJ, 550, L213
- Li & Greenberg (1998) Li, A., & Greenberg, J. M. 1998, A&A, 331, 291
- Li et al. (2004) Li, M. P., Zhao, G., & Li, A. 2004, ApJ, 613, L145
- Li et al. (2007) Li, M. P., Zhao, G., & Li, A. 2007, MNRAS, 382, L26
- Lisse et al. (2007) Lisse, C. M., Beichman, C. A., Bryden, G., & Wyatt, M. C. 2007, ApJ, 658, 584
- Lisse et al. (2008) Lisse, C. M., Chen, C. H., Wyatt, M. C., & Morlok, A. 2008, ApJ, 673, 1106
- Miranda & Solf (1989) Miranda, L. F., & Solf, J. 1989, A&A, 214, 353
- Molster & Kemper (2005) Molster, F., & Kemper, C. 2005, Space Sci. Rev., 119, 3
- Molster et al. (2002a) Molster, F. J., Waters, L. B. F. M., & Tielens, A. G. G. M. 2002a, A&A, 382, 222
- Molster et al. (2002b) Molster, F. J., Waters, L. B. F. M., Tielens, A. G. G. M., & Barlow, M. J. 2002b, A&A, 382, 184
- Molster et al. (2002c) Molster, F. J., Waters, L. B. F. M., Tielens, A. G. G. M., Koike, C., & Chihara, H. 2002c, A&A, 382, 241
- Molster et al. (1999) Molster, F. J., Waters, L. B. F. M., Trams, N. R., Van Winckel, H., Decin, L., van Loon, J. T., Jäger, C., Henning, T., Käufl, H.-U., de Koter, A., & Bouwman, J. 1999, A&A, 350, 163
- Molster et al. (2001) Molster, F. J., Yamamura, I., Waters, L. B. F., Nyman, L.-Å., Käufl, H.-U., de Jong, T., & Loup, C. 2001, A&A, 366, 923
- Ossenkopf et al. (1992) Ossenkopf, V., Henning, T., & Mathis, J. S. 1992, A&A, 261, 567
- Phillips (2002) Phillips, J. P. 2002, ApJS, 139, 199
- Phillips (2004) Phillips, J. P. 2004, MNRAS, 353, 589
- Preite-Martinez & Pottasch (1983) Preite-Martinez, A., & Pottasch, S. 1983, A&A, 126, 31
- Ramsay et al. (1993) Ramsay, S. K., Chrysostomou, A., Geballe, T. R., Brand, P. W. J. L., & Mountain, M. 1993, MNRAS, 263, 695
- Sargent et al. (2006) Sargent, B., Forrest, W. J., D’Alessio, P., Li, A., Najita, J., Watson, D. M., Calvet, N., Furlan, E., Green, J. D., Kim, K. H., Sloan, G. C., Chen, C. H., Hartmann, L., & Houck, J. R. 2006, ApJ, 645, 395
- Sloan et al. (2006) Sloan, G. C., Devost, D., Bernard-Salas, J., Wood, P. R., & Houck, J. R. 2006, ApJ, 638, 472
- Sloan et al. (2008) Sloan, G. C., Kraemer, K. E., Wood, P. R., Zijlstra, A. A., Bernard-Salas, J., Devost, D., & Houck, J. R. 2008, ApJ, 686, 1056
- Sylvester et al. (1999) Sylvester, R. J., Kemper, F., Barlow, M. J., de Jong, T., Waters, L. B. F. M., Tielens, A. G. G. M., & Omont, A. 1999, A&A, 352, 587
- Szczerba et al. (2007) Szczerba, R., Siódmiak, N., Stasińska, G., & Borkowski, J. 2007, A&A, 469, 799
- Treffers & Cohen (1974) Treffers, R., & Cohen, M. 1974, ApJ, 188, 545
- van der Veen & Habing (1988) van der Veen, W. E. C. J., & Habing, H. J. 1988, A&A, 194, 125
- Voors et al. (1999) Voors, R. H. M., Waters, L. B. F. M., Morris, P. W., Trams, N. R., de Koter, A., & Bouwman, J. 1999, A&A, 341, L67
- Waters et al. (1998a) Waters, L. B. F. M., Beintema, D. A., Zijlstra, A. A., de Koter, A., Molster, F. J., Bouwman, J., de Jong, T., Pottasch, S. R., & de Graauw, T. 1998a, A&A, 331, L61
- Waters et al. (1998b) Waters, L. B. F. M., Cami, J., de Jong, T., Molster, F. J., van Loon, J. T., Bouwman, J., de Koter, A., Waelkens, C., Van Winckel, H., Morris, P. W., Cami, J., Bouwman, J., de Koter, A., de Jong, T., & de Graauw, T. 1998b, Nature, 391, 868
- Waters et al. (1996) Waters, L. B. F. M., Molster, F. J., de Jong, T., Beintema, D. A., Waelkens, C., Boogert, A. C. A., Boxhoorn, D. R., de Graauw, T., Drapatz, S., Feuchtgruber, H., Genzel, R., Helmich, F. P., Heras, A. M., Huygen, R., Izumiura, H., Justtanont, K., Kester, D. J. M., Kunze, D., Lahuis, F., Lamers, H. J. G. L. M., Leech, K. J., Loup, C., Lutz, D., Morris, P. W., Price, S. D., Roelfsema, P. R., Salama, A., Schaeidt, S. G., Tielens, A. G. G. M., Trams, N. R., Valentijn, E. A., Vandenbussche, B., van den Ancker, M. E., van Dishoeck, E. F., Van Winckel, H., Wesselius, P. R., & Young, E. T. 1996, A&A, 315, L361
- Waters et al. (1999) Waters, L. B. F. M., Voors, R. H. M., Morris, P. W., Trams, N. R., de Koter, A., & Lamers, H. J. G. L. M. 1999, in Lecture Notes in Physics, Berlin Springer Verlag, Vol. 523, IAU Colloq. 169: Variable and Non-spherical Stellar Winds in Luminous Hot Stars, ed. B. Wolf, O. Stahl, & A. W. Fullerton, 381
- Wooden (2008) Wooden, D. H. 2008, Space Sci. Rev., 138, 75
- Woolf & Ney (1969) Woolf, N. J., & Ney, E. P. 1969, ApJ, 155, L181
- Zhang (1995) Zhang, C.Y. 1995, ApJS, 98, 659
- Zhang & Kwok (1990) Zhang, C. Y., & Kwok, S. 1990, A&A, 237, 479
- Zhukovska et al. (2008) Zhukovska, S., Gail, H.-P., & Trieloff, M. 2008, A&A, 479, 453
- Zijlstra et al. (2006) Zijlstra, A. A., Matsuura, M., Wood, P. R., Sloan, G. C., Lagadec, E., van Loon, J. T., Groenewegen, M. A. T., Feast, M. W., Menzies, J. W., Whitelock, P. A., Blommaert, J. A. D. L., Cioni, M.-R. L., Habing, H. J., Hony, S., Loup, C., & Waters, L. B. F. M. 2006, MNRAS, 370, 1961
| IRAS Name | Type | 2MASS (magnitude) | MSX (Jy) | IRAS (Jy) | |||||||
|---|---|---|---|---|---|---|---|---|---|---|---|
| 183540638 | Post-AGB | 8.55 | 5.85 | 4.51 | 9.10 | 19.60 | 24.40 | 49.10 | 18.90 | 68.00 | 39.20 |
| 23239+5754 | Young PN | 10.23 | 9.83 | 8.81 | 10.99 | 16.95 | 18.53 | 50.81 | 20.86 | 71.22 | 35.79 |
| 164563542 | PN | 11.83 | 11.48 | 10.53 | 2.26 | 3.84 | 7.06 | 22.19 | 4.88 | 29.61 | 10.96 |
| Star No. | IRAS Name | MSX6C Name | Date observed | Data Version | Comment |
|---|---|---|---|---|---|
| 1 | 183540638 | G025.547000.0529 | 04/20/07 | S16.1.0 | |
| 2 | 23239+5754 | G111.877702.8509 | 09/09/06 | partial S16.1.0 | poor LH nod2 |
| 3 | 164563542 | G355.733403.4721 | 03/25/07 | partial S16.1.0 |
| IRAS 18354-0638 | IRAS 23239+5754 | IRAS 16456-3542 | |||
|---|---|---|---|---|---|
| FWHM | FWHM | FWHM | |||
| 10.63 | 0.11 | 10.60 | 0.24 | ||
| 11.26 | 0.39 | 11.22 | 0.17 | ||
| 11.61 | 0.27 | ||||
| 13.54 | 0.22 | 13.55 | 0.25 | ||
| 13.75 | 0.25 | 13.75 | 0.23 | ||
| 14.18 | 0.12 | ||||
| 14.40 | 0.13 | 14.39 | 0.26 | ||
| 14.63 | 0.08 | 14.61 | 0.19 | ||
| 15.45 | 0.33 | 15.39 | 0.31 | ||
| 16.10 | 0.60 | 16.10 | 0.30 | ||
| 17.47 | 0.99 | 17.43 | 0.39 | ||
| 18.00 | 0.53 | 18.96 | 0.42 | ||
| 19.45 | 0.83 | 19.59 | 0.54 | 19.61 | 0.50 |
| 20.65 | 0.34 | 20.70 | 0.31 | 20.65 | 0.29 |
| 21.66 | 0.47 | 21.60 | 0.45 | 21.60 | 0.53 |
| 23.09 | 0.54 | 23.07 | 0.50 | ||
| 23.21 | 1.21 | 23.74 | 0.49 | 23.68 | 0.53 |
| 24.49 | 0.23 | 24.58 | 0.39 | 24.52 | 0.24 |
| 25.47 | 0.55 | 25.85 | 0.30 | ||
| 27.73 | 0.85 | 27.72 | 1.30 | 27.88 | 1.14 |
| 29.19 | 0.85 | 29.53 | 0.86 | 29.58 | 0.66 |
| 30.54 | 0.29 | 30.59 | 0.36 | 30.57 | 0.27 |
| 31.11 | 0.19 | 31.12 | 0.14 | 31.13 | 0.14 |
| 32.78 | 0.95 | 32.81 | 0.50 | 32.80 | 0.42 |
| 33.57 | 0.88 | 33.80 | 0.93 | 33.72 | 0.62 |
| 35.41 | 1.36 | 35.64 | 1.55 | 35.55 | 1.14 |
Note. — Compared with the crystalline silicate feature list of Molster et al. (2002a), the features in Roman are at the same wavelength as that of Molster et al. (2002a). The features peaking at appreciably different wavelengths are listed in italic. Those listed in bold face are new features, not identified previously.
| Source | Crystallinity(%) | |||||||
|---|---|---|---|---|---|---|---|---|
| 183540638 | 79 | 87 | 85 | 213 | 4 | |||
| 232395754 | 129 | 81 | 150 | 54 | ||||
| 164563542 | 67 | 125 | 72 | 144 | 158 | 24 |
Note. — From left to right: the source, the temperatures of the cool forsterite component (), the warm forsterite component (), the cool enstatite component (), the warm enstatite component (), the cool amorphous silicate component (), and the warm amorphous silicate component (), the mass ratio of enstatite to forsterite (), and the derived silicate crystallinity (i.e. the mass fraction of silicate dust in crystalline form).