Effect of Eu doping and partial oxygen isotope substitution on magnetic phase transitions in (Pr1-yEuy)0.7Ca0.3CoO3 cobaltites
Abstract
We study experimentally and theoretically the effect of Eu doping and partial oxygen isotope substitution on the transport and magnetic characteristics and spin-state transitions in (Pr1-yEuy)0.7Ca0.3CoO3 cobaltites. The Eu doping level is chosen in the range of the phase diagram near the crossover between the ferromagnetic and spin-state transitions (). We prepared a series of samples with different degrees of enrichment by the heavy oxygen isotope 18O, namely, containing 90%, 67%, 43 %, 17 %, and 0 % of 18O. Based on the measurements of ac magnetic susceptibility and electrical resistivity , we analyze the evolution of the sample properties with the change of Eu and 18O content. It is demonstrated that the effect of increasing 18O content on the system is similar to that of increasing the Eu content. The band structure calculations of the energy gap between and bands including the renormalization of this gap due to the electron-phonon interaction reveal the physical mechanisms underlying such similarity.
pacs:
72.80.Ga, 75.30.Wx, 32.10.Bi, 71.27.+a, 71.15.Mb, 75.25.DkI Introduction
Most magnetic oxides are characterized by a strong interplay of electron, lattice, and spin degrees of freedom giving rise to multiple phase transitions and different types of ordering. The phase transitions are often accompanied by the formation of different inhomogeneous states. In such a situation, the oxygen isotope substitution provides a unique tool for investigating inhomogeneous states in magnetic oxides, which allows studying the evolution of their properties in a wide range of the phase diagram. Sometimes, particularly if a system is close to the crossover between different states (usually leading to a phase separation), the isotope substitution can lead to significant changes in the ground state of the system Babushkina1998 .
A good example of such phenomena is provided by cobaltites. These perovskite cobalt oxides have attracted a special interest owing to the possibility of the spin-state transitions (SST) for the Co ions induced by temperature or doping goodenough.jap65 ; asai.jpsj98 ; saitoh.prb97 ; tokura.prb98 ; korotin.prb96 ; berggold.prb08 ; ovchinnikov.UFN10 and the related phase separation phenomena maignan.jpcm02 ; leighton.prb03 ; louca.prl06 ; podlesnyak.prl08 ; sboychakov.prb09 ; louca.prb09 ; leighton.prb10 ; podlesnyak.prb11 . The effect of 16O O isotope substitution on the properties of (Pr1-yEuy)0.7Ca0.3CoO3 cobaltites () was studied earlier in our paper Kalinov2010 . It was found that with increasing Eu content, the ground state of the compound changes from a “nearly metallic” ferromagnet (ferromagnetic metallic clusters embedded into an insulating host) to a “weakly magnetic insulator” at , regardless the isotope content. A pronounced SST was observed in the insulating phase (in the samples with ), whereas in the nearly-metallic phase (at ), the magnetic properties were quite different, without any indications of a temperature-induced SST. Using the magnetic, electrical, and thermal data, we constructed the phase diagram for this material. The characteristic feature of this phase diagram is a broad crossover range near corresponding to a competition of the phases mentioned above. The 16O O substitution gives rise to an increase in temperature of the SST and to a slight decrease in the ferromagnetic (FM) transition temperature .
However, a number of problems important for understanding the physics of the systems with spin-state transitions have not been touched upon in the study reported in Ref. Kalinov2010, . The most important question is the relation between the changes caused by varying the composition (increase of concentration of the smaller rare-earth ions Eu) and that due to isotope substitution, and the physical mechanism underlying these changes. From the phase diagram obtained in Ref. Kalinov2010, and in the present paper, we see that there exists some correlation between these changes, but the situation is not so simple: in the right part of the phase diagram, see Fig. 12 below, the SST temperature increases both with the increase of Eu content and with the increase of isotope mass (going from 16O to 18O). At the same time, in the left part of this phase diagram the effect of increasing the Eu content and of increasing the oxygen mass on the phase transition (which is then the transition to a nearly ferromagnetic state) is just the opposite: an increase in Eu content leads to a decrease in , but the increase of oxygen mass – to the increase in .
Another important open question concerns the behavior of separate phases in the regime of phase separation. There are many different correlated systems, in which phase separation was detected in some range of compositions, temperatures, external fields, etc. Typically, the measured transition temperatures in this case changes e.g. with doping. However, it often remains unclear whether this change is the effect occurring in separate regions of different phases, or is just the result of averaging out over the inhomogeneous system. To answer these questions, we now carried out the detailed study of the behavior of (PrEu)CoO3, using as a tool the possibility of fine tuning the properties of the system by partial isotope substitution. This partial substitution plays in effect the role similar to that of doping, external pressure, etc. The obtained results established the possibility of “rescaling” the changes in the system with doping and with isotope substitution and allowed us to clarify the questions formulated above.
As regards the second question formulated above, just the possibility of fine tuning the properties of the system inside the region of phase separation, provided by partial isotope substitution, allows studying the behavior of different phases within this phase separated regime individually, which would be very difficult to get by other means. Our results obtained in this way demonstrate that not only the average critical temperatures change with doping and with isotope substitution, but also “individual” transition temperatures (the ferromagnetic transition temperature in more metallic regions and the SST temperature in more insulating parts of the sample) do change with chemical and isotope composition.
As regards the main, the first question formulated above, about the mechanisms governing the change of properties of the system with chemical and isotope composition, the experimental findings reported in the present paper provided us an opportunity to formulate a realistic theoretical model clarifying the mechanisms underlying the pronounced isotope effects in cobaltites exhibiting spin-state transitions. The theoretical analysis demonstrates that the main factor is the change of the effective bandwidth with the change both of chemical and isotope composition. The opposite trends in two parts of phase diagram mentioned above find natural explanation in this picture.
To analyze the effects of the partial oxygen isotope substitution for the doped cobaltites in the crossover region of the phase diagram, we have prepared a series of oxide materials with nearly continuous tuning of their characteristics. This allows tracing the evolution of relative content of different phases as a function of the ratio 18O/16O of the contents of oxygen isotopes. Note that there were only few investigations of this kind, one of which we undertook earlier for (La1-yPry)0.7Ca0.3MnO3 manganites Babushkina2000 . Here, the pronounced isotope effect manifesting itself in (Pr1-yEuy)0.7Ca0.3CoO3 cobaltites indeed provides us with a unique possibility to address the problems discussed above through the use of the partial oxygen isotope substitution.
II Experimental
Polycrystalline (Pr1-yEuy)0.7Ca0.3CoO3 samples were prepared by the chemical homogenization (“paper synthesis”) method Balagurov99 through the use of the following operations. At first, non-concentrated water solutions of metal nitrates Pr(NO3)3, Eu(NO3)3, Ca(NO3)2, and Co(NO3)2 of 99.95% purity were prepared. The exact concentration of dissolved chemicals was established by gravimetric titration and, in the case of Co-based solution, by means of potentiometric titration. The weighted amounts of metal nitrate solutions were mixed in stoichiometric ratio and the calculated mixture of nitrates were dropped onto the ash-free paper filters. The filters were dried out at about 80∘C and the procedure of the solutions dropping was performed repeatedly. Then, the filters were burned out and the remaining ash was thoroughly ground. It was annealed at 800∘C for 2 h to remove carbon. The powder obtained was pressed into the pellets and sintered at 1000∘C in the oxygen atmosphere for 100 h. Finally, the samples were slowly cooled down to room temperature by switching off the furnace.
Samples were analyzed at room temperature by the powder X-ray diffraction using Cu radiation. All detectable peaks were indexed by the space group. According to the X-ray diffraction patterns, all (Pr1-yEuy)0.7Ca0.3CoO3 samples were obtained as single-phase polycrystalline materials.
We prepared a series of ceramic cobaltite samples with the degrees of enrichment by 18O equal to 90%, 67%, 43%, 17%, and 0%. These values were determined by the changes in the sample mass in the course of the isotope exchange and by the mass spectrometry of the residual gas in the oxygen exchange contour. The samples were annealed in the appropriate 16O–18O gas mixture at 950 ∘C during 48 h at total pressure of 1 bar. The similarity of the oxygen isotope composition in the sample to that in the gas medium indicated that a thermodynamic equilibrium was achieved during annealing and, hence, the difference in the diffusion rates of the oxygen isotopes did not significantly affect the results of the investigation. We also note that the mass of a sample annealed in 16O2 remained unchanged within the experimental error during the prolonged heat treatment. Therefore, we can conclude that the annealing procedure does not change the oxygen stoichiometry in the compounds under study.
The Eu doping of these samples was chosen to be near and at the both sides of the crossover doping level : a composition with the high Eu content exhibiting the SST, a low-Eu composition corresponding to the nearly ferromagnetic state, and the sample at the phase crossover, where both and , were observed.
Note here that the set of samples described above was specially prepared for the present study. It turned out that the data obtained for these samples differ somehow from that reported in Ref. Kalinov2010, (samples of set 1). In particular, the values of the transition temperatures between phases are different for these two sets of samples. We thoroughly analyzed the possible causes of such difference. The samples of both sets prepared by the same technique do not differ by X-ray diffraction data, have the same oxygen stoichiometry, but the calcium content in set 1 appeared to be lower than that corresponding to the nominal composition. At the same time, the samples of set 2 correspond with a high accuracy to the chemical formula (Pr1-yEuy)0.7Ca0.3CoO3. As will be discussed below, this leads to some general shift of the phase diagram toward larger values of of the average ionic radius (i.e. to the lower Eu content). Nevertheless, the general form of the phase diagram remains the same.
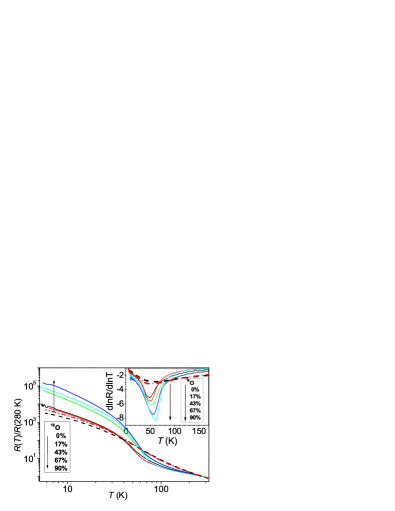
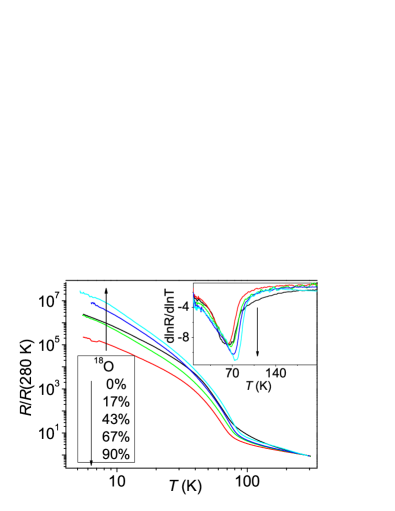
For all samples, we measured the temperature dependence of the real and imaginary parts of the ac magnetic susceptibility and electrical resistivity . The resistivity measurements discussed below were taken on cooling the samples. The measurements of ac magnetic susceptibility were performed in ac magnetic field with a frequency 667 Hz and an amplitude of about 5 Oe in the dc magnetic field of the Earth. Based on these measurements, we were able to analyze the evolution of the sample properties with the change Eu and 18O content. For achieving a better reliability, the isotope shifts O) and O) (where is the average atomic mass of oxygen isotopes) were determined based on the susceptibility data obtained both on cooling and on heating. Within the experimental error, we did not observe the temperature hysteresis in the vicinity of the transition to the ferromagnetic phase, whereas near the SST, the hysteresis did not exceed 1 K. In the figures further on, we represent the plots corresponding to the heating of the samples. The value of transition temperatures were determined from the minimum of the logarithmic temperature derivative of susceptibility. The transition temperatures were determined by linear approximation as demonstrated in Fig. 1. Although the critical temperatures depend on the chosen method of determining of critical temperature, the isotopic shift is nearly insensitive to the choice of determination procedure. The resistivity of the samples was measured by the conventional four-probe technique in the temperature range from 4.2 to 300 K. The value of the metal–insulator transition temperature can be determined from the logarithmic derivative of (see inset of Fig. 2).
III Experimental results
1. For the samples with (Eu content ), the material correspond to a “weakly magnetic insulator”, in notation of Ref. Kalinov2010, . The curves give clear indications of an SST at manifesting itself as a peak in (see Fig. 1). We see that increases with the 18O content. The high-temperature phase is a paramagnet and a relatively good conductor, (see Fig. 2).
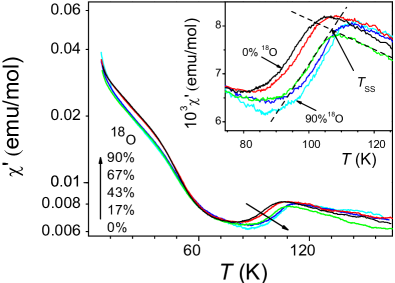
The low-spin (LS) insulating phase is dominant below the crossover temperature of about 100 K. The increase in at low temperatures is most probably caused by an incomplete transition, after which there may remain small magnetic (and presumably more conducting) clusters immersed into the LS state bulk insulator. As a result of this crossover to a LS state, the electrical resistance increases by 10–12 orders of magnitude, which can be treated as a metal–insulator transition (MI), see Fig. 2). In these compounds, the metal–insulator transition is accompanied (or caused) by the SST. Note here that the studies of the oxygen isotope effect are performed in most cases using low-density ceramic samples with an open porosity. This gives rise to the granularity effects related to the existence of thin spacers at the grain boundaries with the properties somehow different from those of the grains themselves. In the magnetic oxides under study, the phase separation coming from the competition between different kinds of the exchange interaction also manifests itself.
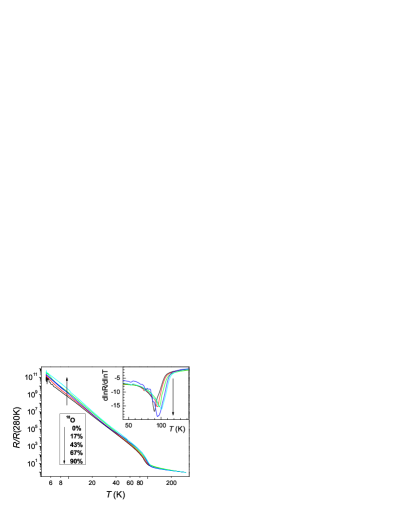
All these factors lead to significant changes in the temperature dependence of electrical resistivity, so that the temperature derivative of remains negative for the compositions under study. Nevertheless, the characteristic features of the , which are observed in the vicinity of SST and are suppressed in the composition range corresponding to ferromagnetism, allow arguing that we see the manifestation of the metal–insulator transition in one of the phases.
The increase of 18O content does not produce a significant effect on at low , although is slightly larger in the samples with heavy oxygen. The mass dependence of correlates well with the isotopic shift of (see Fig. 3). According to the calculation of isotopic constant ( is the averaged oxygen mass); , we have the value and . Increasing the oxygen mass promotes the development of the LS state.
2. The most important results are obtained for the samples with Eu content ( and 0.16). They correspond to a wide concentration range of the phase separation.
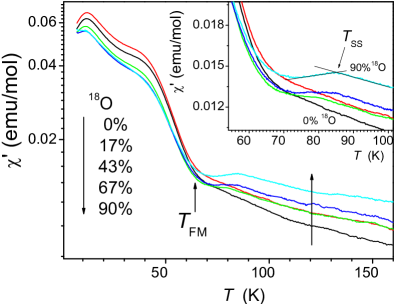
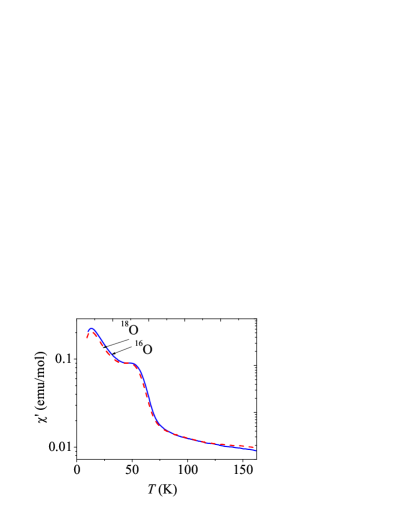
For the sample with , we observe in curves a feature corresponding to a steep increase of the magnetization on cooling at 60–70 K (see Fig. 4). This behavior is caused by the FM phase arising in these samples. In addition, in the temperature dependence of resistivity, we see a steep increase of resistivity characteristic of the metal–insulator transition similar to that observed for the samples with (see Fig. 5). The transition temperature corresponds to the minimum of the logarithmic derivative of the resistivity (see the inset in Fig. 5. This means that here we deal also with the change in the relative content of metallic and insulating phases suggesting the existence of the regions corresponding to the LS insulating state and the correlation between the MI and SS transitions. At the same time we do not observe any clear indications of the SST in the temperature dependence of the magnetic susceptibility. Thus, the samples with turn out to be at the boundary of the phase separation range. The increasing in the oxygen mass favors the LS state as well as suppression of the FM phase and of the metallization.
The values of the isotopic constant calculated for the MI and FM transitions in this sample are and , respectively. For this sample, the isotope shifts of the characteristic transition temperatures are illustrated in Fig. 6.
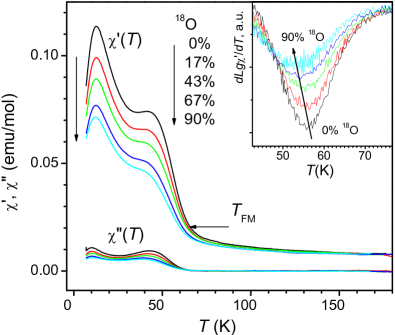
For the samples with , the effect of the partial oxygen isotope substitution by 18O manifests itself even clearer. Here, we observed the features characteristic both of FM and SS transitions. On the one hand, the temperatures dependence of exhibits a steep growth at 60–70 K similar to that in the sample 0.14 indicating the existence of the FM transition. On the other hand, in , we observed a clearly pronounced peak, which can be attributed to SST at (Fig. 7). The curves also demonstrate that the transition to the LS state gradually disappears as the oxygen mass decreases. In samples with small 18O content (%), this transition is hardly seen due to the gradual transformation from the LS to FM state when the oxygen mass decreases. The curves for samples with 17% and 43% of 18O corresponding to the crossover range between different phase states nearly coincide. Note also that for (as well as in the samples with ) the temperature decreases as of the average mass of oxygen increses.
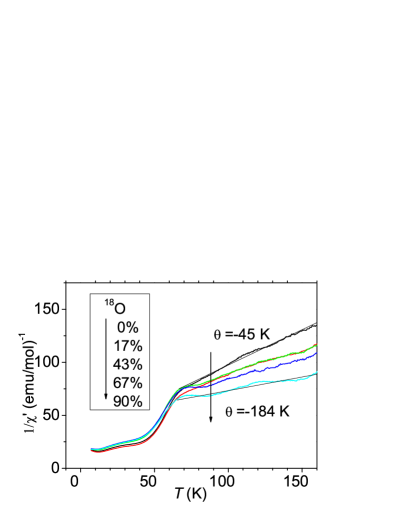
In addition, the Curie–Weiss temperature in the formulas for the inverse magnetic susceptibility considerably decreases with the increase in the average mass of oxygen isotopes (see Fig. 8). For the samples with the largest oxygen mass, we have K, whereas for the samples with 16O, K. This phenomenon may be related to the transition from the antiferromagnetic interaction to ferromagnetic one. Note that Fig. 4 demonstrates that in the paramagnetic range is nearly zero; this means that the absorption related to the itinerant charge carriers is very small and does not produce a significant effect on and hence on the values of .
For the sample with as well as for samples with and 0.2, we have found the resistivity increases as the temperature decreases (by 5-7 orders of magnitude), with the MI transition in the vicinity of 70 K (Fig. 9). Both the resistivity and magnetic susceptibility data clearly indicate that this sample is in the phase-separation range. The temperatures of MI and SS transitions increase with the average mass oxygen (see the inset in Fig. 9). In the sample with , we see the same general tendency, namely the increase in and the decrease of as the average oxygen isotope mass increases. Here, the values of the isotope constant are and ; the isotopic shifts of the characteristic transition temperatures are illustrated in Fig. 10.
3. Finally, the samples with (Eu content ) fall into the range of “nearly metallic” ferromagnet. In Ref. Kalinov2010, , it was shown that at the compositions with a low Eu content correspond to the domains of the metallic ferromagnetic phase embedded in a weakly magnetic nonconducting matrix.
According to the temperature dependence plotted in Fig. 11, the magnetization steeply increases on cooling at about K (i.e. the ferromagnetic phase arises). With the increase in the average oxygen mass, the value of decreases at low temperatures. Here, we have (18O) (16O) and the maximum isotope shift of does not exceed 2–3 K.
The electrical resistivity for these samples () increases at low temperatures, even when the ferromagnetic phase arises. This behavior is quite similar to that observed in the samples with and (see Fig. 5). We note that the electrical resistance in the samples with 18O is higher than in those with 16O. However, with the decrease of Eu content down to , the MI peculiarity in the resistance is suppressed. Such a behavior of for samples with can be compared with that for samples (see Fig. 5 and the inset of this figure). The resistivity for samples corresponds to a more smooth curve than for samples with , although the regular course of the temperature dependence remains nearly unchanged. Thus, the samples with do not become truly metallic but their behavior differs from the behavior of the samples with (they do not exhibit indications of an SST). Therefore, we argue that in the phase diagram, the composition with lies outside the crossover region, on the left-hand side of it. The value of isotope constant is .
We note here that for such a complicated system, there is no genuinely accurate method for determining thermodynamic values of transition temperatures and especially . Probably, the closest to the actual value is the onset temperature of the transition (). The value of can be determined by different methods, but as we have already mentioned in Sec. II, the isotope shift of the transition temperature is nearly insensitive to the definition of . Therefore, in Figs. 3, 6, and 10, we show only the isotope shifts of the transition temperatures and not the temperatures themselves.
IV Discussion of experimental results
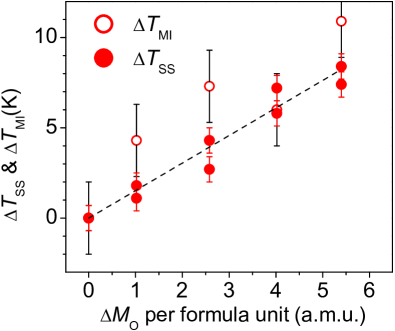
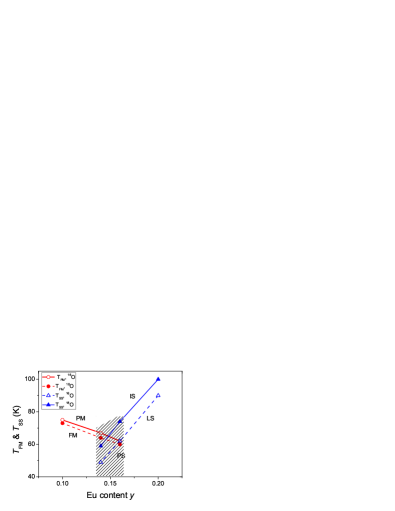
The obtained data for the temperatures of the phase transitions can be presented in the form of a phase diagram (Fig. 12). It illustrates that as the of Eu content increases, the system transforms from the nearly metallic ferromagnet to the LS insulating state undergoing LS IS spin-state transitions ISstate . Between these states, we have a broad crossover region corresponding to the phase separation. Indeed, the simultaneous observation both of and in the samples with Eu content and 0.16 is a clear evidence of the phase separation in the system.
These samples also provide a spectacular illustration of the effect related to the variable content of 18O. In particular, for the samples with , the temperature dependence of magnetic susceptibility (Fig. 4) exhibits a pronounced feature corresponding to the SST at high values of 18O content. With decreasing the 18O content, this feature becomes weaker and disappears below 17% of 18O. Hence, we see that the change on the average oxygen mass can drastically affect the phase composition of the cobaltite samples.
The oxygen isotope substitution 16O O shifts the phase equilibrium toward the insulating state. For the heavier isotope, the SST temperature increases, while the ferromagnetic transition temperature decreases. Varying the average oxygen mass is a unique tool for investigating special properties of phase separation in cobaltites near the crossover between the FM and LS phases. We also see that the effect of increasing the 18O content on the system is similar to that of increasing the Eu content.
We emphasize that the general structure of the phase diagram shown in Fig. 12 is similar to that reported in Ref. Kalinov2010, . The partial oxygen isotope substitution allows a much more detailed study of the evolution of the state of doped perovskite cobaltites in the most interesting region corresponding to the phase separation. This is exactly the main objective of our work, which could not be significantly affected by the difference in the composition of two sets of samples.
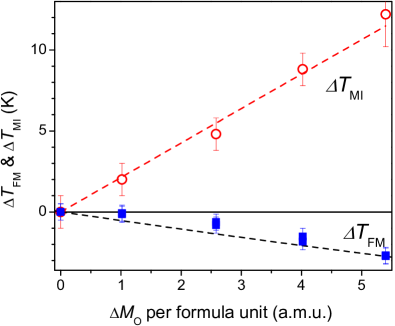
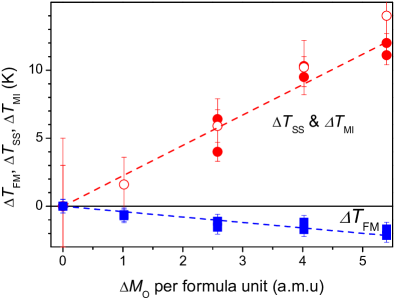
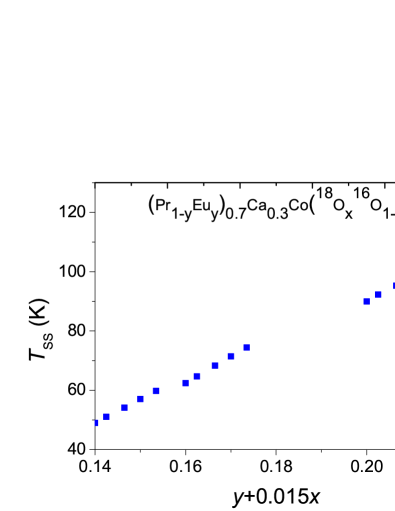
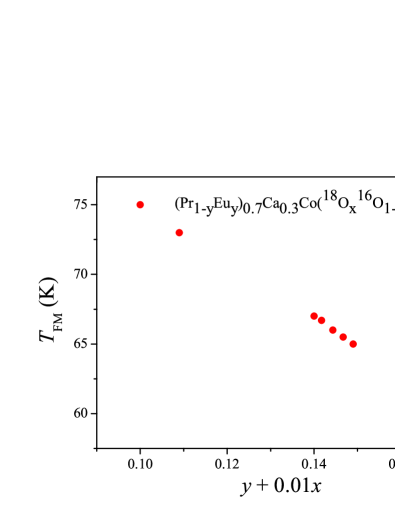
The analysis of these results for different chemical and isotope composition demonstrates that the effect of the increase in the Eu content and of the average oxygen mass are qualitatively similar. We can rescale the dependence of the transition temperature on both parameters using the combined variable , for or for , where is the relative content of 18O, as shown in Fig. 13. Both the temperatures of SS and FM transitions depend almost linearly on this combined variable. We see that the change of Eu content by 1% is equivalent to the change of the isotope content by 70–100 %. This actually the most important result of the present study. The theoretical analysis of these results is given in the next sections.
V Calculation details
To explain the composition and isotope dependence of the properties of our system (see Fig. 12), especially the similar dependence of the SST temperature and the temperature of the FM transition illustrated in Fig. 13, we propose a realistic model (Section VII) based predominantly on the change of the electron bandwidth with chemical and isotope composition. Some input, as well as the estimates of relevant parameters are taken from the ab initio band structure calculations for the limiting “pure” compositions corresponding to (PrCoO3) and (EuCoO3).
The crystal structure of PrCoO3 obtained in Ref. Knizek2009, for K was utilized in those calculations. For EuCoO3, the lattice parameters were taken from Ref. Baier2005, . The exact atomic positions for EuCoO3 are unknown, and we therefore used the same positions as for PrCoO3 (with the correct unit cell volume for EuCoO3). The splitting between different one-electron energy levels was calculated within the local density approximation (LDA) in the framework of the method of linear muffin-tin orbitals (LMTO) Andersen1984 . Partially filled but physically unimportant states of the Eu and Pr were treated as frozen Nekrasov2003 .
The Brillouin-zone (BZ) integration in the course of self-consistency iterations was performed over a mesh of 144 k-points in the irreducible part of the BZ.
VI Doping dependence: LDA results
There are different ways to estimate the SST temperature with the use of the band structure calculation. The most direct way is to calculate the total energies of different spin states Korotin96 ; Streltsov11 . However, in the case of the doped system this would require very large supercells. Moreover, currently, we have no single commonly accepted model that can explain all experimental facts. Various combinations of a static or dynamic order of the different spin states are discussed in the literature Nekrasov2003 ; Knizek2009-2 ; Haverkort-06 ; Ren-11 ; Lamonova-11 . This is the reason why we chose an alternative approach.
The energy of any of the spin states depends on two important parameters: the single-electron energy difference between the highest and the lowest levels, and the intra-atomic Hund’s rule exchange coupling . The Hund’s rule energy is an atomic characteristic and does not change appreciably either with the Eu doping or with the isotope substitution. Hence, to investigate the dependence of the SST temperature on the doping or isotope substitution in the first approximation, we can focus on the study of the single parameter, . If is large enough (), it is energetically favorable to localize all electrons in the low-lying subshell of Co3+, i.e., the system is in the LS state. With a decrease of the crystal-field splitting, some electrons can be transferred to the subshell, which allows the system to gain the exchange energy, since there are more electrons with the same spin. As we will show below, both the isotope substitution and the doping can be related to the crystal-field splitting.
In order to estimate , we used the Wannier function projection procedure proposed in Ref. Streltsov2005, , which allows projecting the full-orbital band Hamiltonian onto the subspace of a few states (five states of Co). With the Fourier transformation, we obtain the Hamiltonian in real space, from which the splitting between highest in energy and lowest can be easily calculated. For PrCoO3, we obtain eV.
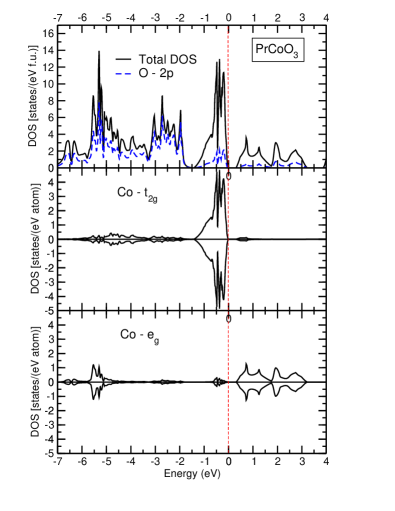
The total and partial densities of states (DOS) obtained for PrCoO3 in the LDA calculations are presented in Fig. 14. In the octahedral symmetry, the 3 states of Co are split into and subbands. In the LDA, the valence band is mostly formed by the Co states, while the conduction band is determined by the Co states. The O band is located in the energy range from –7 to –1.5 eV.
The DOS for EuCoO3 is qualitatively very similar and corresponding calculations of result in the value of 2.14 eV. The increase of the excitation energy on going from PrCoO3 to EuCoO3 is caused by two factors. The first is the lanthanide contraction: the substitution of the large Pr3+ by smaller Eu3+ ions leads to some decrease of the Co–O distance and to the corresponding increase in the hybridization, which leads to an increase in the difference between the centers of the and bands. The second effect is related to the decrease in the effective widths of and energy bands with the corresponding increase in the energy gap between them. This narrowing of energy bands on going from PrCoO3 to EuCoO3 is also related, in effect, with the lanthanide contraction, because of which the tilting of CoO6 octahedra increases and the Co–O–Co angle and the corresponding bandwidth decrease in going from PrCoO3 to EuCoO3. Both these effects eventually lead to the increase in with the Eu content, which leads to the enhanced stabilization of the LS state of Co3+ (see the more detailed discussion of these effects in Sec. VII).
This change of the crystal-field splitting (CFS) results in the modification of the SST temperature, since this transition is due to the competition of the Hund’s rule exchange coupling and the CFS Nekrasov2003 .
It was found in Refs. Kalinov2010, and Babushkina2010, (see also Fig. 12) that the change of the Eu content in (Pr1-yEuy)0.7Ca0.3CoO3 by 0.02 leads to the change of the SST temperature by about 14 K. In the first approximation, it is possible to neglect the presence of Ca and interpolate the change of the CFS for the complex system like (Pr1-yEuy)0.7Ca0.3CoO3 using the values of the CFS for (PrCoO3) and (EuCoO3). Indeed, the substitution of Ca for Eu3+/Pr3+ gives rise to ligand holes, which manifest themselves mainly in the rigid shift of the O-2 band upwards resulting in a slight increase of the CFS. Such a linear interpolation predicts the change of the SST temperature by 16 K, if changes by 0.02, which is in an excellent agreement with the experiment.
VII Isotope substitution: Model results
The isotope substitution does not change the chemical properties of the ions such as the oxidation numbers or bonding energies. However, it affects the crystal lattice through the modification of the phonon spectra. Below, following the approach in Ref. Babushkina98, , we demonstrate the effect of this modification on the electronic and magnetic properties and hence on the SST.
In the tight-binding model, the band spectra of a solid is determined by the on-site ionic energy levels and the hopping matrix elements between different sites . The ionic energies are obviously independent of the mass of the ions, being determined by the quantum numbers and the intra-atomic Coulomb and exchange interactions. The hopping parameters depend on the type of the orbitals (), bonding type (), and the distance between ions, . According to the famous Harrison parametrization Harrison1999 ; Andersen1977 in the absence lattice vibrations, the hopping integrals, e.g., between orbitals of the oxygen and transition metal -orbitals equal to
| (1) |
where coefficients depend on the type of the bonding and can be different for different metals and ligands Harrison1999 ; Slatter-Koster .
The static version of (1) can be generalized taking into account the presence of lattice vibrations, i.e. phonons, which depend on the ion masses. The mean hopping matrix element can be calculated as
| (2) | |||||
where is the mean square displacement from the equilibrium position due to phonons. Since , we can simplify the last equation expanding it to series to the 4th order
| (3) |
In the static limit , the last formula coincides with (1).
In the Debye model at zero temperature, the mean square displacement is written as Reissland1973
| (4) |
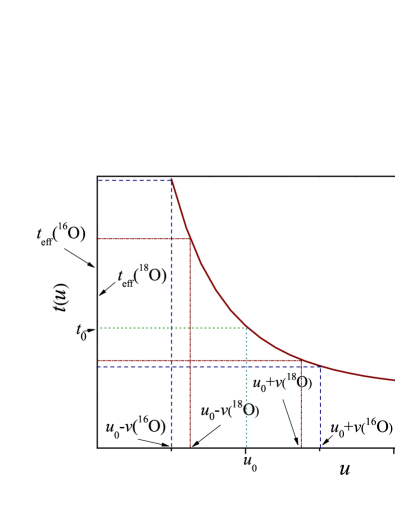
Here is the mass of vibrating ions and is the Debye temperature. Due to different mass the mean square displacement in the compounds enriched by 16O or 18O will be different. The Debye temperature for the very similar system, LaCoO3 was found to be 600 K Stolen1997 . One may use this value to estimate in (Pr1-yEuy)0.7Ca0.3CoO3. Then, the mean-square displacement is for 18O and for 16O. According to (3), this leads to the decrease in the effective bandwidth in going from 16O to 18O. A qualitative explanation of this effect is presented in Fig. 15a. For strong electron-phonon coupling, the same effect could be attributed to the polaron band narrowing depending on the isotope mass.
The SST temperature depends on the energy difference between and subbands, which is defined by the widths of corresponding bands and the positions of their centers. We start with the study of the bandwidths dependence on the ligand ion mass (see the schematic illustration in Fig. 15b).
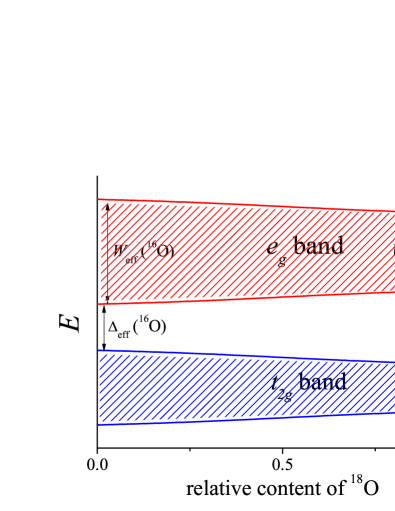
To calculate the change in the bandwidth caused by the 16O 18O substitution, we needs to know the hopping integrals, which depend on two unknown parameters and . The coefficients can in principle be evaluated as it is prescribed, for instance, in Ref. Harrison1999, . However, for a better precision, we calculated parameters from the LDA and bandwidths in pure PrCoO3. The equilibrium Co–O distance in its turn can be evaluated from the actual crystal structure data for EuCoO3 and PrCoO3.
Finally, performing all these calculations, one gets that the bandwidth decreases by 22 K when 16O is replaced by 18O. The decrease in the bandwidth is two times larger and equals 44 K. In effect, the minimum energy of the transition increases by 33 K. Hence, the SST temperature due to the change of the bandwidth must increase similarly in passing from 16O to 18O in qualitative accordance with the experiment (we even overestimate the actually observed changes; see Fig. 12).
We consider the second mechanism, which affects the SST and is related to the dependence of changes in the centers of gravity of corresponding bands (i.e., the CFS) with the isotope substitution. It turns out that this effect counteracts the first one (change of the effective and bandwidths), but this second effect is much smaller numerically (see below). Generally speaking, there are two main contributions to the CFS, . One comes from the Coulomb interaction of the electrons with the negatively charged ligands, another is due to the hybridization between orbitals of metal ions and orbitals of the ligands Ballhausen1962 ; Sugano1970 . For most oxides of transition metals, both terms act in “the same direction”, resulting to the same sequence of levels Ushakov2011 . That is why so crude approaches as the atomic sphere approximation (ASA) Skiver1984 often used in the ab initio calculations provide quite precise band structure in most cases. The effect of the Coulomb term can be omitted or effectively incorporated into the kinetic energy contribution. Below, we follow the same strategy by considering the kinetic energy only, keeping in the mind that the Coulomb contribution can be taken into account via the parameter renormalization.
In the second order of the perturbation theory, the CFS between and subbands is written as
| (5) |
where is the charge-transfer energy (which corresponds to the transition), and are the hopping matrix elements for different types of bonds.
Because the average hopping decreases in passing from 16O to 18O according to Eqs. (3) and (4), the CFC should also decrease as follows from Eq. (5). As a result, this contribution should lead to the opposite tendency: a decrease of the SST transition temperature in going from 16O to 18O. However, this effect does not exceed a few kelvins at realistic values of the charge-transfer energy in cobaltites Chainani1992 .
Note also that we estimated here the changes in the distance between the edges of and subbands. However, at finite temperatures, we must have not only the transitions between the band edges but just from one subband to another. Such a temperature-induced smearing could diminish somehow our estimates of the isotope effect in SST.
In Fig. 13b, we see that the isotope effect for , being much weaker than for , is of the opposite sign. Nevertheless, there is the same similarity between the effects of the Eu content and the oxygen isotope substitution. This is in agreement with our expectations, because the ferromagnetism of the low-Eu doped samples with metallic clusters should be stabilized by the double-exchange mechanism, according to which is proportional to the effective bandwidth of itinerant electrons. This bandwidth decreases for the heavier isotope, and that is why decreases at the 16O O substitution as well as at increasing Eu content, see Fig. 13b. A schematic illustration of the mechanism underlying the oxygen isotope effect discussed above is given in Fig. 15.
VIII Conclusions
Experimental studies carried out for (Pr1-yEuy)0.7Ca0.3CoO3 cobaltites with varying isotope substitution of 16O by 18O demonstrated that there exists a strong similarity in the changes caused by the chemical composition (increasing the Eu content) and those arising from the oxygen isotope substitution. The chemical composition was chosen because in this range a crossover occurs between the ferromagnetic near-metallic state with magnetic Co ions to the nonmagnetic insulator with the low-spin Co3+ (, ), see Fig. 12.
The main experimental conclusion presented in Fig. 13 is that one can rescale the behavior of this system. The dependence of the spin-state transition temperature and of the ferromagnetic transition temperature on the Eu content and on the content of the heavier isotope 18O can be represented by the same almost linear plot as function of the combined variables and , respectively. This means, for example, that for the the SST, the change of the Eu content by 0.007 is equivalent to the substitution of 50% of 16O by 18O. In addition, this clearly demonstrates that not only the average transition temperatures change with doping and with isotope substitution, but also the transition temperatures for each separate phase vary with chemical and isotope composition.
Based on this similarity between the role of chemical and isotope composition for the SST and for the transition to the ferromagnetic state at a smaller Eu content, we propose a theoretical explanation of the isotope effect in these transitions. We investigate the corresponding changes and estimate the relevant parameters using the ab initio band structure calculations. These results together with the analytical model allow explaining the observed behavior. In particular, the isotope effect both in the spin-state and ferromagnetic transitions is interpreted in terms of the change in the corresponding widths of the bands occurring due to the electron-phonon renormalization, which depends on the atomic masses of the respective isotopes.
All this demonstrates once again that the oxygen isotope substitution is a powerful tool for revealing salient features in the behavior of strongly correlated magnetic oxides.
Summarizing, we can say that using this approach, we established, first, that in the aforementioned crossover range, we can clearly distinguish two coexisting phases, nearly insulating exhibiting a spin-state transition and nearly metallic “ferromagnetic”, with the different behavior of the transition temperatures. Second, we have found that these transition temperatures depend almost linearly on the content of the heavy oxygen isotope, which is a nontrivial observation clearly demonstrating that the electronic structure could be effectively controlled by isotopes. Third, based on these observations and using the parameters deduced from our band-structure calculations, we put forward a simplified model capturing the main physics of the isotope effect in the systems with SSTs and quantitatively describing the experimental data.
This work is supported by the Russian Foundation for Basic Research (projects 10-02-00140-a, 10-02-00598-a, 10-02-96011-a, 11-02-00708-a, 11-02-91335-NNIO-a, and 13-02-00374), by the Ural Branch of Russian Academy of Sciences through the young-scientist program, by the German projects DFG GR 1484/2-1, FOR 1346, by Köln University via German Excellence Initiative, and by the European network SOPRANO.
References
- (1) N. A. Babushkina, L. M. Belova, O. Yu. Gorbenko, A. R. Kaul, A. A. Bosak, V. I. Ozhogin, and K. I. Kugel, Nature 391, 159 (1998).
- (2) J. B. Goodenough and P. M. Raccah, J. Appl. Phys. 36, 1031 (1965).
- (3) K. Asai, A. Yoneda, O. Yokokura, J. M. Tranquada, G. Shirane, and K. Kohn, J. Phys. Soc. Jpn. 67, 290 (1998).
- (4) T. Saitoh, T. Mizokawa, A. Fujimori, M. Abbate, Y. Takeda, and M. Takano, Phys. Rev. B 55, 4257 (1997).
- (5) Y. Tokura, Y. Okimoto, S. Yamaguchi, H. Taniguchi, T. Kimura, and H. Takagi, Phys. Rev. B 58, R1699 (1998).
- (6) M. A. Korotin, S. Y. Ezhov, I. V. Solovyev, V. I. Anisimov, D. I. Khomskii, and G. A. Sawatzky, Phys. Rev. B 54, 5309 (1996).
- (7) K. Berggold, M. Kriener, P. Becker, M. Benomar, M. Reuther, C. Zobel, and T. Lorenz, Phys. Rev. B 78, 134402 (2008).
- (8) N. B. Ivanova, S. G. Ovchinnikov, M. M. Korshunov, I.M. Eremin, and N. V. Kazak, Usp. Fiz. Nauk. 179, 837 (2009) [Physics - Uspekhi 52, 789 (2009)].
- (9) R. Ganguli, A. Maignan, C. Martin, M. Hervieu, and B. Raveau, J. Phys.: Condens. Matter 14, 8595 (2002).
- (10) J. Wu and C. Leighton, Phys. Rev. B 67, 174408 (2003).
- (11) D. Phelan, Despina Louca, K. Kamazawa, S.-H. Lee, S. Rosenkranz, M. F. Hundley, J. F. Mitchell, Y. Motome, S. N. Ancona, and Y. Moritomo, Phys. Rev. Lett. 97, 235501 (2006).
- (12) A. Podlesnyak, M. Russina, A. Furrer, A. Alfonsov, E. Vavilova, V. Kataev, B. Büchner, Th. Strässle, E. Pomjakushina, K. Conder, and D. I. Khomskii, Phys. Rev. Lett. 101, 247603 (2008).
- (13) A. O. Sboychakov, K. I. Kugel, A. L. Rakhmanov, and D. I. Khomskii, Phys. Rev. B 80, 024423 (2009).
- (14) J. Yu, Despina Louca, D. Phelan, K. Tomiyasu, K. Horigane, and K. Yamada, Phys. Rev. B 80, 052402 (2009).
- (15) S. El-Khatib, Shameek Bose, C. He, J. Kuplic, M. Laver, J. A. Borchers, Q. Huang, J. W. Lynn, J. F. Mitchell, and C. Leighton, Phys. Rev. B 82, 100411 (2010).
- (16) A. Podlesnyak, G. Ehlers, M. Frontzek, A. S. Sefat, A. Furrer, Th. Strässle, E. Pomjakushina, K. Conder, F. Demmel, and D. I. Khomskii, Phys. Rev. B 83, 134430 (2011).
- (17) A. V. Kalinov, O. Yu. Gorbenko, A. N. Taldenkov, J. Rohrkamp, O. Heyer, S. Jodlauk, N. A. Babushkina, L. M. Fisher, A. R. Kaul, A. A. Kamenev, T. G. Kuzmova, D. I. Khomskii, K. I. Kugel, and T. Lorenz, Phys. Rev. B 81, 134427 (2010).
- (18) N. A. Babushkina, A. N. Taldenkov, L.M. Belova, E. A. Chistotina, O. Yu. Gorbenko, A. R. Kaul, K. I. Kugel, and D. I. Khomskii, Phys. Rev. B 62, R6081 (2000).
- (19) A. M. Balagurov, V. Yu. Pomjakushin, D. V. Sheptyakov, V. L. Aksenov, N. A. Babushkina, L. M. Belova, A. N. Taldenkov, A. V. Inyushkin, P. Fischer, M. Gutmann, L. Keller, O. Yu. Gorbenko, and A. R. Kaul, Phys. Rev. B 60, 383 (1999); O. Yu. Gorbenko, O. V. Melnikov, A. R. Kaul, A. M. Balagurov, S. N. Bushmeleva, L. I. Koroleva, and R. V. Demin, Mater. Sci. Eng. B 116, 64 (2005).
- (20) As follows e.g. from the results of Ref. podlesnyak.prb11, , the magnetic states of Co ions generated by doping are most probably IS states. For the following treatment, however, it is not critical whether we deal with the IS or HS states.
- (21) K. Knížek, J. Hejtmánek, Z. Jirák, P. Tomeš, P. Henry, and G. André, Phys. Rev. B 79, 134103 (2009).
- (22) J. Baier, S. Jodlauk, M. Kriener, A. Reichl, C. Zobel, H. Kierspel, A. Freimuth, and T. Lorenz, Phys. Rev. B 71, 014443 (2005).
- (23) O. K. Andersen and O. Jepsen, Phys. Rev. Lett. 53, 2571 (1984).
- (24) I. A. Nekrasov, S. V. Streltsov, M. A. Korotin, and V. I. Anisimov, Phys. Rev. B 68, 235113 (2003).
- (25) S. V. Streltsov and N. A. Skorikov, Phys. Rev. B 83, 214407 (2011).
- (26) M. A. Korotin, S. Yu. Ezhov, I. V. Solovyev, V. I. Anisimov, D. I. Khomskii, and G. A. Sawatzky, Phys. Rev. B 54, 5309 (1996).
- (27) K. Knížek, Z. Jirák, J. Hejtmánek, P. Novák, and W. Ku, Phys. Rev. B 79, 014430 (2009).
- (28) Y. Ren, J.-Q. Yan, J.-S. Zhou, J. B. Goodenough, J. D. Jorgensen, S. Short, H. Kim, T. Proffen, S. Chang, and R. J. McQueeney, Phys. Rev. B 84, 214409 (2011).
- (29) M. W. Haverkort, Z. Hu, J. C. Cezar, T. Burnus, H. Hartmann, M. Reuther, C. Zobel, T. Lorenz, A. Tanaka, N. B. Brookes, H. H. Hsieh, H.-J. Lin, C. T. Chen, and L. H. Tjeng, Phys. Rev. Lett. 97, 176405 (2006).
- (30) K. V. Lamonova, E. S. Zhitlukhina, R. Yu. Babkin, S. M. Orel, S. G. Ovchinnikov, and Y. G. Pashkevich, J. Phys. Chem. A 115, 13596 (2011).
- (31) S. V. Streltsov, A. S. Mylnikova, A. O. Shorikov, Z.V. Pchelkina, D. I. Khomskii, and V. I. Anisimov, Phys. Rev. B 71, 245114 (2005).
- (32) N. Babushkina, A. Taldenkov, A. Kalinov, L. Fisher, O. Gorbenko, T. Lorenz, D. Khomskii, and K. Kugel, Zh. Eksp. Teor. Fiz. 138, 215 (2010) [JETP 111, 189 (2010)].
- (33) N. A. Babushkina, L. M. Belova, V. I. Ozhogin, O. Yu. Gorbenko, A. R. Kaul, A. A. Bosak, D. I. Khomskii, and K.I. Kugel, J. Appl. Phys. 83, 7369 (1998).
- (34) W. Harrison, Elementary Electronic Structure (World Scientific, Singapore, 1999).
- (35) O. Andersen and O. K. Jepsen, Physica B 91, 317 (1977).
- (36) J. C. Slater and G. F. Koster, Phys. Rev. 94, 1498 (1954).
- (37) J. Reissland, The Physics of Phonons (Wiley, New York, 1973).
- (38) S. Stølen, F. Grønvold, H. Brinks, T. Atake, and H. Mori, Phys. Rev. B 55, 14103 (1997).
- (39) C. Ballhausen, Introduction to Ligand Field Theory (McGraw-Hill, New York, 1962).
- (40) H. Sugano, S. Tanabe, and Y. Kamimura, Multiplets of Transition-Metal Ions in Crystals (Academic Press, New York, 1970).
- (41) A. Ushakov, S. V. Streltsov, and D. I. Khomskii, J. Phys.: Condens. Matter 23, 445601 (2011).
- (42) H. Skiver, The LMTO Method (Springer-Verlag, Berlin, 1984).
- (43) A. Chainani, M. Mathew, and D. D. Sarma, Phys. Rev. B 46, 9976 (1992).