Hard x-ray photoemission and density functional theory study of the internal electric field in SrTiO3/LaAlO3 oxide heterostructures
Abstract
A combined experimental and theoretical investigation of the electronic structure of the archetypal oxide heterointerface system LaAlO3 on SrTiO3 is presented. High-resolution, hard x-ray photoemission is used to uncover the occupation of Ti 3d states and the relative energetic alignment - and hence internal electric fields - within the LaAlO3 layer. Firstly, the Ti 2p core level spectra clearly show occupation of Ti 3d states already for two unit cells of LaAlO3. Secondly, the LaAlO3 core levels were seen to shift to lower binding energy as the LaAlO3 overlayer thickness, , was increased - agreeing with the expectations from the canonical electron transfer model for the emergence of conductivity at the interface. However, not only is the energy offset of only 300meV between (insulating interface) and (metallic interface) an order of magnitude smaller than the simple expectation, but it is also clearly not the sum of a series of unit-cell by unit-cell shifts within the LaAlO3 block. Both of these facts argue against the simple charge-transfer picture involving a cumulative shift of the LaAlO3 valence bands above the SrTiO3 conduction bands, resulting in charge transfer only for . We discuss effects which could frustrate this elegant and simple charge transfer model, concluding that although it cannot be ruled out, photodoping by the x-ray beam is unlikely to be the cause of the observed behavior. Turning to the theoretical data, our density functional simulations show that the presence of oxygen vacancies at the LaAlO3 surface at the 25% level reverses the direction of the internal field in the LaAlO3. Therefore, taking the experimental and theoretical results together, a consistent picture emerges for real-life samples in which nature does not wait until and already for , mechanisms other than internal-electric-field-driven electron transfer from idealized LaAlO3 to near-interfacial states in the SrTiO3 substrate are active in heading off the incipient polarization catastrophe that drives the physics in these systems.
pacs:
73.20.-r, 73.40.-c, 73.61.-rI Introduction
Since they were first studied in 2004 by Ohtomo and Hwang, SrTiOLaAlO3 (STO/LAO) heterostructures have attracted a great deal of interest.Ohtomo and Hwang (2004); Huijben et al. (2009); Reyren et al. (2007); Zubko et al. (2011) The nature of the conduction that occurs when an LAO film four or more unit cells (UC) thick is grown on a TiO2 terminated STO substrate, Thiel et al. (2006) is still a subject of intense debate. The so-called ‘polar catastrophe’ is proposed to play a central role in the explanation of this conductivity. Ohtomo and Hwang (2004) According to this model, the electric potential should increase linearly with each layer of LAO that is added to the sample. Because this cannot continue indefinitely, there must be a critical thickness at which the system finds a way of relaxing to a lower energy state. The most widely discussed model entails an electronic reconstruction Okamoto and Millis (2004) (electron transfer picture) whereby electrons are transferred from the outermost AlO2 layer to the TiO2 layer at the interface between STO and LAO. Theoretical calculations have predicted a shift of the LAO energy bands of 0.9 eV per monolayer of LAO.Pentcheva et al. (2010) For LAO overlayers four or more monolayers thick, the top of the LAO valence band should then rise above the bottom of the STO conduction band, leading to the transfer of electrons and averting a potential runaway. The transferred electrons (half an electron per unit cell) then form a conducting quasi two dimensional electron gas (q-2DEG).Okamoto and Millis (2004) Despite the simplicity and elegance of this model, as yet such shifts have not been experimentally observed in oxide MBE Segal et al. (2009) or low O2 partial pressure PLD Takizawa et al. (2011) grown thin films. As the diverging potential, which would certainly exist for an ideal film stack, still needs to be avoided, additional forms of potential compensation or reduction should be considered. One such possibility is the electron doping that would result from oxygen vacancies being formed in the overlayer Bristowe et al. (2011a); Li et al. (2011); Zhong et al. (2010) or in the substrate.Schneider et al. (2010); Herranz et al. (2007); Siemons et al. (2007); Kalabukhov et al. (2007) Removing an oxygen ion from the crystal donates two electrons to the system. These electrons could then occupy the Ti 3d states which are the lowest energy electron-addition states of the whole system, moving to the STO/LAO interface and reducing the built-in potential. Intermixing of cations around the interface is often mentioned as an alternative to electronic reconstruction,Willmott et al. (2007); Qiao et al. (2010); Pauli et al. (2011); Chambers et al. (2010) leading to the formation of La1-xSrxAl1-yTiy Chambers et al. (2010) or Sr1-1.5xLaxO interfaces.Vonk et al. (2012) Note that A-site intermixing by itself does not resolve the polar catastrophe, and it has been pointed out that not diffusive cation disordering but only external (redox) processes can alter the interfacial net charge in systems such as LAO on STO.Bristowe et al. (2011b) Many of these alternatives to the built-in potential paradigm involve energetics and kinetics that could differ from one film growth laboratory and technique to the next, yet the critical LAO overlayer thickness for metallic behaviour of unit cells seems to be a remarkably robust phenomenon. Understanding this is one of the challenges currently facing the field and makes comparison between results from films grown using different techniques very important.
In order to fully understand these systems, knowledge of the conductive layer is vital. The electrostatic fields predicted by the electron transfer picture are so large that they should be easily observable as shifts and (apparent) broadening of LAO core levels on increasing the thickness of the LAO overlayer.Segal et al. (2009) What is measured in a core level experiment is then a weighted total average of core level peaks from each LAO layer. As a result, a potential build-up of 3.2 eV for - for example - 4 layers of LAO would result in significantly broadened La and Al core levels whose maxima would then be shifted by eV, due to the integration in the experiment over the different layer-by-layer shifts. Hard x-ray photoemission spectroscopy (HAXPES) is a powerful tool in detecting such core level shifts in buried interfaces.Fadley (2005) Here we present the results of HAXPES experiments on PLD-grown STO/LAO heterointerfaces. We turn our attention in particular to how the LAO core levels behave as the LAO overlayer thickness increases. We present non-zero LAO core level shifts of meV between two and six layers of LAO. The experimental data show a built-in potential of the same sign as predicted by simple polarisation models. Its magnitude, however, is one order lower, and not of a unit-cell by unit-cell type. We present a DFT-based model in which 25% of the oxygen atoms in the top AlO2 layer have been removed. The reduction of potential build-up by oxygen vacancies is shown to be more than sufficient to account for the only modest electrostatic shifts observed in experiment, and would be in keeping with our experimental observation of Ti3+ centers already for only . We also discuss alternative scenarios, including whether the experiment itself interferes with the build-up or maintenance of the proposed internal field, and although photodoping cannot be ruled out, we present data implying this scenario is unlikely.
II Experiment
The measurements were performed on STO(001) substrates with LAO overlayer thicknesses UC, where is the number of LAO layers. In order to investigate the effect of thick LAO overlayers an additional UC sample was grown. The samples are grown by pulsed laser deposition in an oxygen partial pressure of mbar. Oxygen partial pressure is known to strongly affect the transport properties of these systems.Brinkman et al. (2007) At this relatively high pressure the presence of oxygen vacancies is believed to be strongly reduced compared to synthesis at lower partial pressures. Details of the sample growth have been published elsewhere.Huijben et al. (2009)
The experiments were performed at the double crystal monochromatized KMC-1 beamline Schaefers et al. (2007) using the HiKE endstation Gorgoi et al. (2009) at Helmholtz Zentrum Berlin. Unless stated otherwise, a photon energy of keV was used, and the total energy resolution was set to be meV. 111This enables us to detect core level shifts of the order of meV. No surface treatment was necessary because of the large electron inelastic mean free path at this photon energy ( 4 nm, as calculated by the TPP-2M relation.Tanuma et al. (2003)) Additional experiments were carried out using a laboratory AlKα source (1486 eV, nm) and with synchrotron radiation of energies spanning 2.15 keV to 6 keV ( nm to nm, respectively). All experiments were carried out at room temperature and all energy referencing was done by measuring the energy position of Au 4f core levels. Contact between the sample and the gold reference was made using standard silver paint, and - apart from a 2 mm bare space - the film surface was coated with commercial colloidal graphite contacting agent. During the photoemission experiments themselves - both for the synchrotron-based as well as AlKα-based - we checked for photon flux dependent effects by varying the photon flux over more than an order of magnitude, confirming that the measured kinetic energy, peak positions and widths remained unchanged. In order to eliminate even the smallest error caused by residual electrical charging in the La 4d and Al 2s core level measurements, we determine the difference in binding energy between these core levels and Sr 3d for each sample and use this as our main quantity of interest. An inelastic electron background has been subtracted from the data, and they are normalized to have equal area over each of the binding energy regions shown.
III Experimental results and discussion
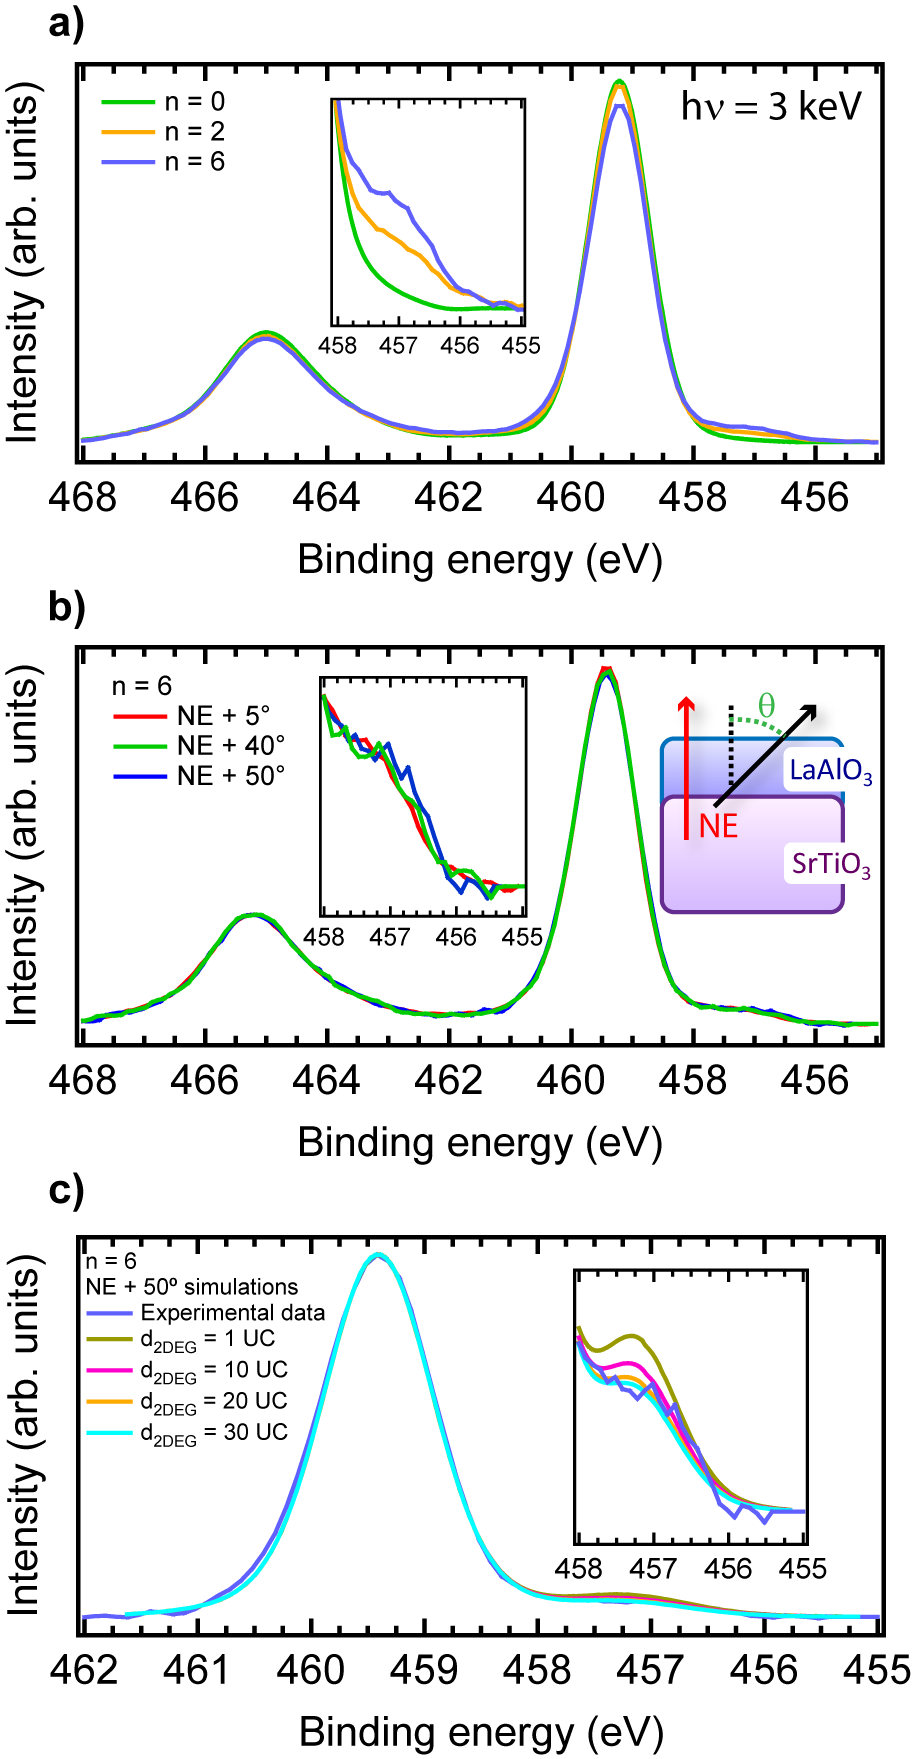
In Fig. 1a the Ti 2p spectra are shown for a bare STO substrate and the and samples. As in Ref. Sing et al., 2009 all STO/LAO samples show a shoulder at the low binding energy side of the Ti 2p3/2 peak (in our data at 2.3 eV lower binding energy), which is commonly accepted to be a signature of partial occupation of Ti 3d states i.e. the presence of Ti3+ ions. 222The intra-atomic Coulomb interaction between the 2p core hole created as part of the photoemission process and the Ti 3d shell is larger than the band-width of the Ti 3d related states, thus core level photoemission in a system such as this results in two main final states both with a 2p core hole, but one without and one with an electron in the Ti 3d levels.Morikawa et al. (1996); Fuggle et al. (1980) The integer 3d electron counts in these two final states are reflected in the constant binding energy difference between the positions of the Ti 2p main lines and shoulder-features, and this underlies the labeling of the shoulders as signaling the presence of ‘Ti3+’ ions. Thus, these features in HAXPES do reflect the Ti 3d populations with some fidelity, but do not provide information on the itinerant/localized nature of the electrons in the STO states. In order to facilitate comparison of the shoulders in the figure, the and spectra have been shifted to lower binding energy by 160, and 220 meV respectively to coincide with the STO spectrum. The observed absolute Ti 2p3/2 binding energy differences for the different LAO thicknesses were similar to those observed in Ref. Yoshimatsu et al., 2008. The values of the binding energies of the peak maxima of the Ti 2p3/2 and the Sr 3d5/2 core levels along with their observed full-width at half-maximum (FWHM) values are given as a function of in Table 1. We also include the binding energies and FWHM of the relevant LAO core levels. Without going into a blow-by-blow account of all levels for all values of , we do mention that the Ti (Sr) core levels show a significant shift of 160 (240) meV to higher binding energy on addition of LAO on top of the STO substrate. The subsequent increase in the binding energy of these levels as increases is limited to 70(-20) meV for the Ti 2p (Sr 3d) levels.
| STO core levels | ||||
|---|---|---|---|---|
| Ti 2p3/2 BE | Ti 2p3/2 FWHM | Sr 3d5/2 BE | Sr 3d5/2 FWHM | |
| (eV) | (eV) | (eV) | (eV) | |
| 0 | 459.22 | 1.06 | 133.64 | 1.02 |
| 2 | 459.38 | 1.11 | 133.88 | 1.12 |
| 3 | 459.43 | 1.13 | 133.90 | 1.11 |
| 4 | 459.43 | 1.14 | 133.90 | 1.13 |
| 5 | 459.43 | 1.13 | 133.86 | 1.15 |
| 6 | 459.45 | 1.14 | 133.86 | 1.16 |
| 20 | 459.49 | 1.11 | 133.83 | 1.18 |
| LAO core levels | ||||
| La 4d5/2 BE | La 4d5/2 FWHM | Al 2s BE | Al 2s FWHM | |
| (eV) | (eV) | (eV) | (eV) | |
| 2 | 103.20 | 1.84 | 119.55 | 2.00 |
| 3 | 103.18 | 1.86 | 119.53 | 1.98 |
| 4 | 103.17 | 1.83 | 119.52 | 1.99 |
| 5 | 103.04 | 1.89 | 119.39 | 2.08 |
| 6 | 102.86 | 1.88 | 119.24 | 2.06 |
| 20 | 103.10 | 1.81 | 119.48 | 1.97 |
In Fig. 1b, we show that for an film there is no significant dependence of the strength of the Ti3+ shoulder on the electron emission angle for angles between 5∘ and 50∘ away from normal emission (NE). Similar measurements on samples with other LAO thicknesses yielded the same result.
We simulate the expected Ti3+ shoulder using the model adopted in Ref. Sing et al., 2009:
| (1) |
Here is the emission angle of the excited photoelectrons, is the fraction of Ti3+ ions in the q-2DEG per unit cell, is the thickness of the q-2DEG and is the inelastic mean free path length of 4 nm for the 3 keV photons used. In Fig. 1c we show a simulation of the Ti3+ shoulder for an sample for four different thicknesses of the q-2DEG, and . Comparison of the simulation with the experimental data (see inset) shows that the the confinement of the 3d1 Ti ions (Ti3+) is certainly to a region greater than 10 UC, and more likely to 20 UC (8 nm) or more from the interface. This value is a factor of two larger than the upper limit reported in Ref. Sing et al., 2009 for confinement lengths in the samples studied there. Thus, the main message at this stage is that the Ti3+ ions picked up in our core level photoemission experiments are certainly not tightly confined in a 2D layer, for example right at the STO/LAO interface.
The second clear message our Ti 2p data convey is that the Ti 3d states are partially occupied already at (see Fig. 1a), even though conductivity in transport for the same samples only sets in at . The origin of these electrons before the critical LAO thickness for conduction is reached is still unexplained.Sing et al. (2009) Defects, such as oxygen vacancies or adsorbates Takizawa et al. (2011) could be the source of these electrons, and the occupation of Ti 3d states for seen here and in Refs. [Takizawa et al., 2011 and Sing et al., 2009] point to a transition from localized to delocalized behavior for at least partially pre-existing Ti 3d electrons at , rather than a transition from zero to finite Ti 3d occupation at the critical LAO thickness. Seeing as an x-ray beam is an integral part of all core level photoemission experiments, photo-induced electrons are another possibility that need consideration,Sing et al. (2009) and we will return to these issues in Section IV. Naturally, the presence of Ti3+ ions in these systems for is in accordance with the electron transfer model, a model which also predicts large core level shifts in the LAO layers. Thus, in order to investigate the presence of these shifts we now move on to a discussion of the La 4d and Al 2s core levels for all samples, using the Sr 3d level of the STO substrate of the same sample as an internal energy reference.
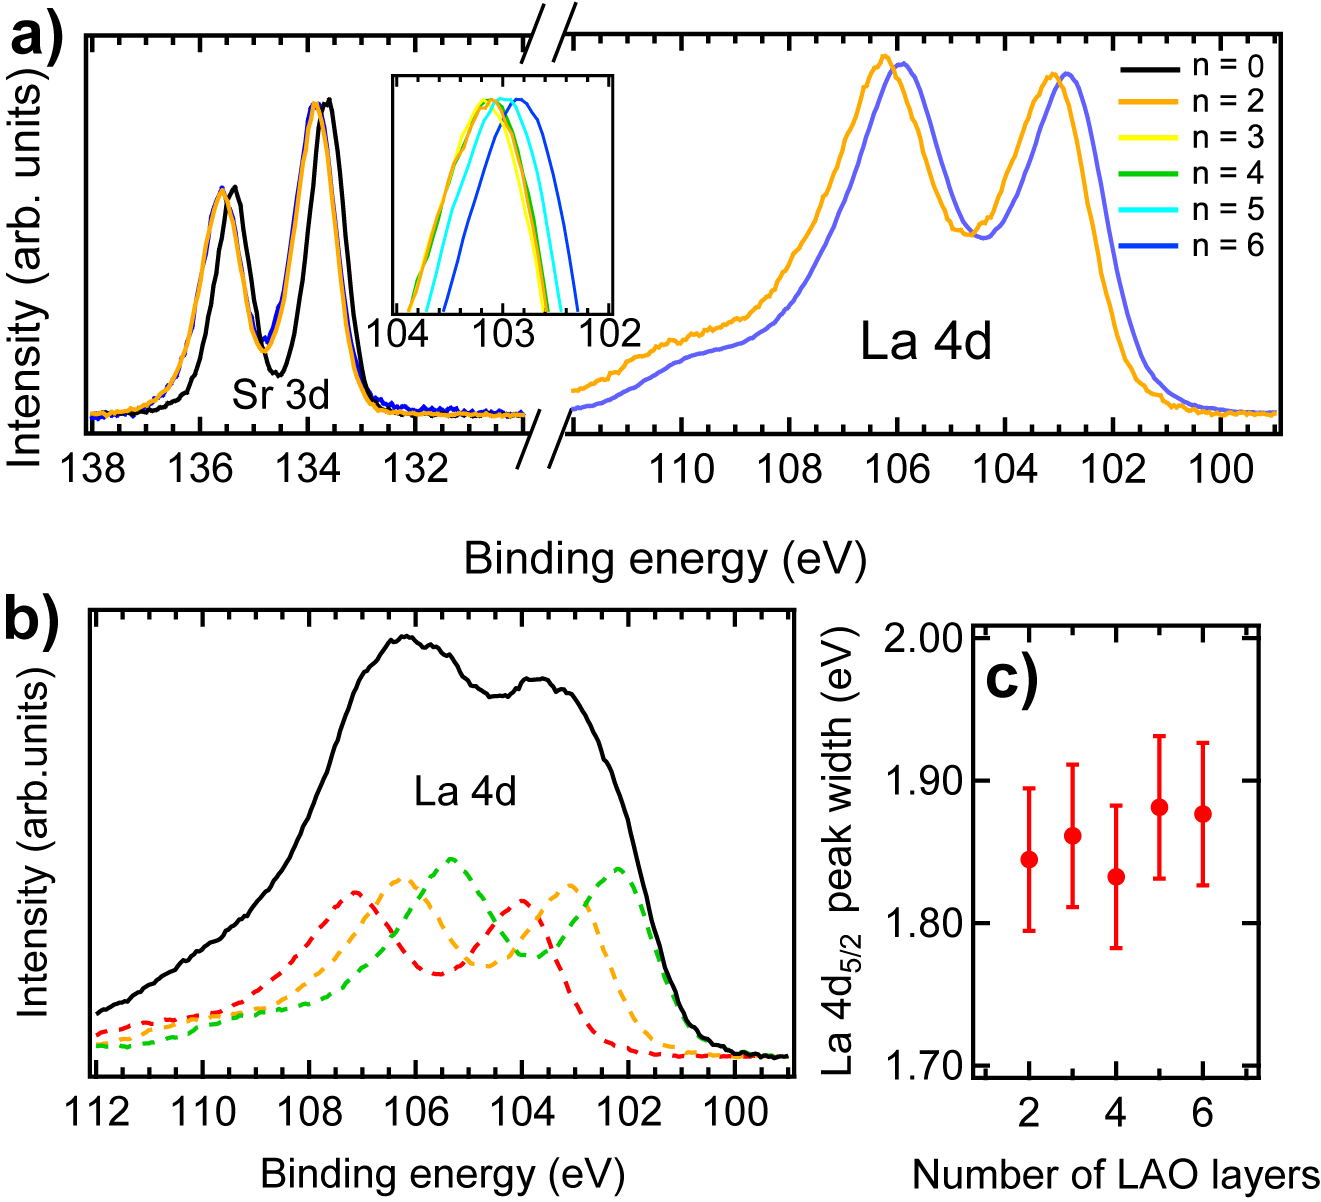
Fig. 2a shows typical La 4d and Sr 3d spectra for and . The Sr 3d spectrum for STO () is shown for comparison. As expected, the energy splitting resulting from spin-orbit interaction (Sr 3d5/2-3d3/2, La 4d5/2-4d3/2) is unchanged as the LAO overlayer thickness increases. In contrast to the STO core levels for , however, there is a clear shift for the La 4d peak with increasing LAO thickness. In the inset to Fig. 2a, the La 4d5/2 peak maximum is shown for all samples (), showing the core level shift to lower binding energy in all cases, whereby for this shift is the most striking. The total shift between and amounts to meV.
Thus, what Fig. 2a shows is a clear thickness-dependent shift of the LAO core levels to lower binding energy between and , that on a qualitative level agrees with the electronic reconstruction model. Having said that, it is also immediately evident that the La 4d core level binding energy changes by much less than the simple expectation of 0.9 eV per LAO unit cell. In Fig. 2b we show the La 4d spectrum simulated for , assuming validity of the simple electronic reconstruction model. We use the La 4d HAXPES spectrum from La2-2xSr1+2xMn2O7 with as a model lineshape, as we know there is no internal potential build-up in this systemde Jong et al. (2009). For , the levels in each of the LAO unit cell layers are expected to be shifted by 0.9 eV with respect to the LAO unit cell layer below.Pentcheva et al. (2010) Consequently, we sum up shifted contributions representing emission from each LAO unit cell layer, and then take an average weighted by , where is the depth of the layer and the electron inelastic mean free path of 4 nm in this case, as this weighted average better represents what could be expected to be measured in experiment.
It is clear that the simulation in Fig. 2b is too broad - visible for example in the almost complete filling in of the minimum between the two main La 4d peaks at 105 eV . The experimentally observed width is essentially unchanged for , as is shown in Fig. 2c and Table 1 333The expected core level broadening due to the binding energy shifts we observe (Fig. 3) is within the error bars shown in Fig. 2c., and there is no indication that the core level peaks consist of a sum of more than one atomic core level spectrum. The data of Fig. 2 show that although there is an energy shift of equal sign to that expected from the electron transfer picture, it differs from the expectations of the simple model in two important respects:
-
•
we observe a rigid shift rather than a layer-by-layer potential build-up
-
•
the shift’s magnitude is a (small) fraction of the expected value of times 0.9 eV/layer from the electronic reconstruction model.
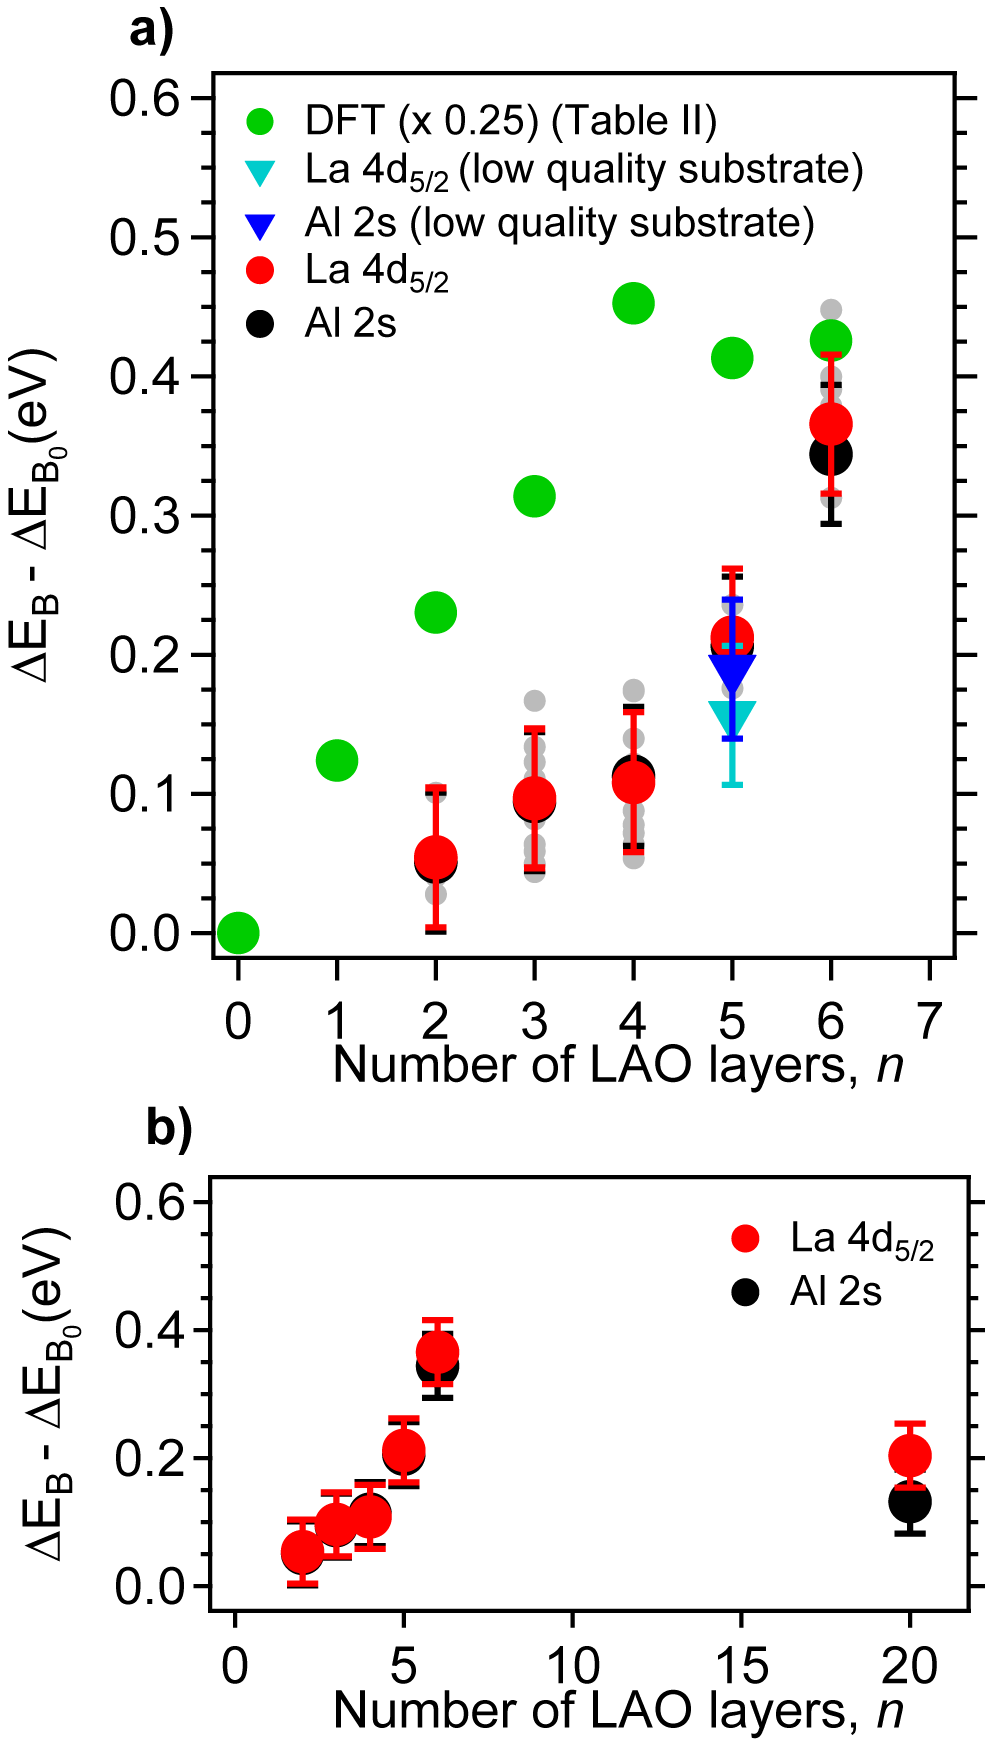
Fig. 3 shows the observed core level shifts for all samples discussed here, presented in terms of the binding energy difference between the La or Al core level concerned and the Sr core level from the substrate of the same sample: = - with La 4d or Al 2s. In order to be able to plot both the La 4d and Al 2s core level shifts (relative to those of the substrate) on the same scale, the extrapolated value of to , which we denote has been subtracted from . The total shift between and amounts to meV. Also shown in Fig. 3a is an -weighted average of the core level shifts from our DFT calculations for a vacancy free STO/LAO interface, the results of which are shown in Table 2. The details of these calculations are given in Section VI. In order to be able to compare to the results of earlier theoretical predictions,Pentcheva et al. (2010) we scaled the theoretical core level shifts by a factor of with being the experimental band gap of STO and the DFT value of the STO band gap. Subsequently the data were divided by a factor of four, to fit on the plot shown in Fig. 3a. We note here that a simple ‘0.9 eV energy shift per unit cell’ approximation gives a similar result to the data shown here. The comparison between theory and experiment illustrate two things: (i) that the -dependence of the core level shifts observed in experiment is different to the DFT prediction, where in the latter stronger shifts are expected for and essentially no shifts for ; (ii) the experimental energy-shift data lie well below one fourth of the values predicted by the charge transfer picture. Thus, real-life samples lack both large core level shifts and, as seen in Fig. 2, the connected core level broadening. This forces us to consider that the simple layer-by-layer potential build-up picture is not capturing the main physics at work in real systems. Taken at face value, the severe reduction of the potential build-up manifested by the reduced core-level shifts indicates that other effects, such as defects or reconstructions, should be taken into account.
In Ref. Segal et al., 2009, XPS data from MBE grown samples recorded using MgKα radiation eV were reported. There, a total shift 180 meV was observed between samples with and unit cells of LAO. Not only are these shifts 60% of those we observe, the sign of the shift is opposite to that clearly visible in our raw data. The MBE samples used in Ref. Segal et al., 2009 were grown in an oxygen partial pressure of Torr, so it is certainly conceivable that they contain significantly more oxygen vacancies compared to the ‘high pressure’ samples studied here ( mbar). We will return to this point later on.
The energy offset we observe between and of meV (see Fig. 3) is of the same sign and comparable magnitude to that inferred from recent tunneling transport data on low O2 partial pressure PLD-grown and post-annealed films Singh-Bhalla et al. (2011). These were observed to enter a Zener tunneling regime at nominally 18.5 unit cells of LAO, which would mean meV per unit cellSingh-Bhalla et al. (2011). Taken at face value, our core level shift data for could be argued to be consistent with a picture in which the critical thickness at which the bottom of the STO conduction band is crossed by the top of the LAO valence band would be much greater than . A naive extrapolation of our data gives a critical thickness as high as 35 UC. In order to clarify this we measured an sample, whose core level shift data are shown in Fig. 3b. Just as for the data, there is no sign of significant broadening of the La and Sr core level lines for , ruling out a unit-cell-by-unit-cell energy shift. Furthermore, the binding energy shift for is in fact comparable to that of the sample, illustrating that the LAO energetics probed via the core levels do not simply saturate at some value, but that the behaviour is more complex. In any case, as our experimental data for are inconsistent with the existence of a second critical thickness at high and with the presence of a step-wise unit-cell by unit-cell potential build-up in the LaAlO3, it would seem unlikely that the picture of an electronic reconstruction at very high is relevant in these samples.
IV Photon doping
At this point it is clear that our data do not display the results of a major unit-cell by unit-cell energy shift. The question arises whether the nature of the experiment itself influences the electrostatics of the sample. The incident hard x-rays used in the experiment create electron-hole pairs that could redistribute in the LAO so as to cancel the potential build-up and therefore flatten the bands. Indeed, it has been observed that any light with an energy greater than the STO band gap dramatically reduces the resistivity of these systems in transport experiments.Huijben et al. (2006); Tebano et al. (2012); Rastogi et al. (2012)
In the case that x-ray-induced carriers do play a role, they should not only reduce the potential build-up in the LAO overlayer, but should also neutralize the band bending or confining potential for the carriers in the STO substrate. Therefore, if a sufficient number of electron-hole pairs were to be doped into the system in this way, both the potential build-up in the LAO and the band bending in the STO should disappear entirely. In such a scenario - without the confining potential - the Ti 3d electrons present in the LAO/STO system are then free to diffuse through the millimeters thick substrate. Thus, if the system is fully dominated by x-ray-induced electron-hole pair creation, one would expect both no potential build-up in the LAO and no spatial confinement of the Ti3+ ions.
In a perfect (unreconstructed), defect-free LaAlO3/SrTiO3 sample where no photon-doping is present at all, the electronic reconstruction scenario would lead to the expected strong potential build-up in the LAO and to confinement of the Ti3+ signal to a thin layer of order a few unit cells around the interface. Naturally, between this one extreme and the other, in which photodoping has flattened all potentials and band bending, there is a grey area in which both potential build-up in the LAO and Ti3+ confinement both decrease with increasing photon-induced electron-hole pair concentration. One remark is that the band bending confining the Ti 3d electrons is suggested to be of the order of several hundred millivolts,Yoshimatsu et al. (2008) whereas the expected potential build-up in the LAO is an order of magnitude greater. Because of this one could expect the Ti3+ confinement to be eliminated first as the possible photon-induced electron-hole pair concentration were to be increased. Upon a further increase of hypothetical photo-doping the LAO bands would then flatten further, ultimately resulting in the scenario outlined above.
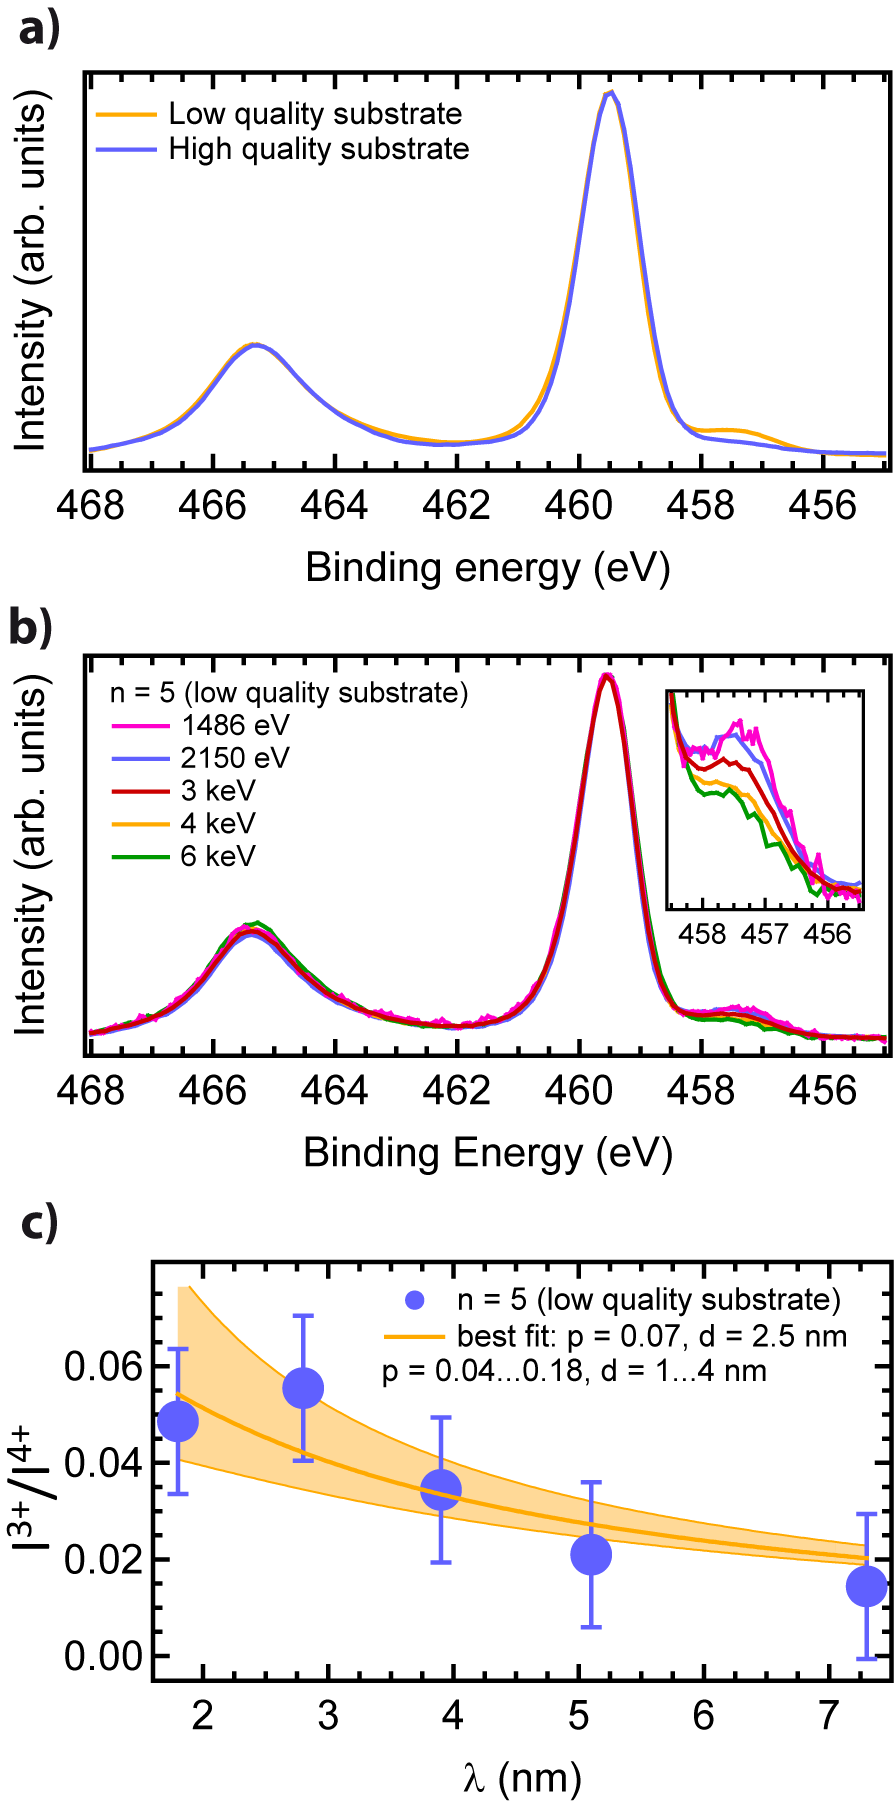
As discussed above, in the regular samples we see little or no angular dependence of the Ti3+ shoulder (see Figs. 1b and c), which - taken at face value - would indicate a thickness of the quasi-2DEG of nm. However, a second sample was grown under the same conditions as the high quality series, but on a lower quality substrate, which exhibited point defects in an AFM inspection (taken after the usual surface termination procedure, but prior to the LAO deposition). As Fig. 4a shows, the lower quality substrate gives an LAO/STO sample with a large Ti3+ contribution: the shoulder to the Ti 2p main line being at least a factor two higher than the one in the regular sample. By varying the kinetic energy of the photoelectrons via changing the photon energy step-wise from 1486 eV to 6 keV a depth profile of the Ti3+/Ti4+ concentration ratio of the lower quality substrate sample was made. The Ti3+/Ti4+ intensity ratio extracted from panel (b) of Fig. 4 is plotted as a function of in panel (c). For the special case of normal emission (), we can fit Eq. 1 to the data and extract a thickness for the q-2DEG of nm, with the fit parameters for the best fit and the range of parameters that give reasonable fits indicated in the figure legend and as an orange band in Fig. 4c. Both the fit parameters and their error bars are in the same ball park as the ones reported in Ref. Sing et al., 2009.
If catastrophic photon-induced potential flattening in the LAO were operative under the conditions used for these HAXPES experiments, then the same would presumably hold for the confining potential in the STO, and thus no confinement of the Ti3+ to a depth within ca. 2.5 nm of the interface would be observed. Thus, the fact that clear confinement is observed in this particular sample argues against dominance of photon-induced potential flattening in these experiments. Furthermore, it is germane to note that the La 4d and Al 2s core level binding energies of the lower quality substrate sample are very similar to those of the sample from the regular, high quality series (see Fig. 3a). The fact that these two samples, which were measured in the same photon beam, have such similar La 4d and Al 2s core level binding energies, yet such different Ti3+ confinement suggests - but does not prove - that photon doping is not the cause of the lack of band bending in the high quality sample. Which in turn suggests that the level of photon-induced band flattening in the high quality sample series is not overly large.
In an experiment in which we held an sample in the dark for 40 hours and then measured the Sr 3d, Al 2s and La 4d core levels using Al:Kα radiation at 10% of the regular photon flux we observed no change in both the core level binding energies and the core level widths as the measurement progressed over the timescale from 30 minutes to several hours in the beam. Also no change was observed after 24 hours, which would be twice the amount of time required to accumulate 0.5 electrons per UC at the STO/LAO interface at this intensity, as we will discuss in the following, in which we make ‘back of the envelope’ estimations of an upper bound for the number of electron-hole pairs the Al:Kα x-ray source used in the lab experiments could generate in the sample. A simple derivation shows this upper bound to be equal to Eq. 2. Assuming that the primary photoelectron current itself corresponds to a negligible amount of the energy deposited in the sample in the form of 1486 eV photons, we reason that each photon represents enough energy to excite across the STO energy gap times or 265 times across the LAO energy gap. Given the total photon flux of the Al:Kα source of photons/s 444Private communication: Dr. Mingqi Wang, VG Scienta, impinging on a sample area of mm2, and taking the x-ray attenuation length in LAO to be 0.32 m and similarly m 555Data from: http://henke.lbl.gov/optical_constants/ we arrive at an area density of electron-hole pairs in an LAO layer of thickness UC of cm-2s-1. Naturally, including processes which certainly take place such as energy-loss to phonons would reduce the estimate of the number of possible gap excitations from this upper limit. The number of electron-hole pairs required to cancel the potential build-up is cm-2 (0.5 electron per UC). Thus, if only electron hole pairs in the LAO contribute to cancellation of the potential build-up, the system would reach this level after some 75 minutes in the Al:Kα x-ray beam. Reducing the photon flux by a factor of ten (as we did in the lab experiments) would then increase this time to a little over twelve hours.
| (2) |
Now we consider a scenario in which electron hole pairs created in the top 16 nm (twice the value we found for confinement of the q-2DEG in Fig. 1c) of the STO also contribute to the band flattening in the LAO layer. The additional number of electron-hole pairs created is given by Eq. 3, with the thickness of the STO layer that donates electron-hole pairs. This number amounts to cm-2s-1, which means one could reach 0.5 electrons per UC already after 3 minutes at full intensity and 30 minutes at 10% intensity. Given the low photoionisation cross-sections and resulting modest signal to noise ratio in these experiments, it is not possible to determine whether there are any changes in core level binding energies or widths on this time scale. Thus, without dependable information regarding to what extent electron-hole pairs in the STO substrate play a role in possible flattening of the bands, and how much of an overestimate our upper bound represents, these estimations indicate that via this route alone we cannot make a clear call as to the effect of photon doping in these experiments.
| (3) |
Before concluding this section dealing with aspects of the experiments themselves that could affect the observed energetics, we briefly discuss sample contacting.Son et al. (2010) As related in the experimental section, the surface of the films is additionally contacted by means of colloidal graphite, leaving a strip of 2 mm free on which the x-ray beam impinges. We found this to be an effective manner to prevent charging. A recent paper Arras et al. (2012) uses DFT techniques to study the effect of adding metallic contacts (Ti, Al, Pt) on top of LAO on STO. The conclusions are that such metallic contacts provide a significant charge transfer to the Ti states of the STO, turning them metallic and neutralizing the electric field in the LAO. For Ti and Al these effects are predicted to be largest, as strong covalent bonds between the outermost AlO2 layer of the LAO and the metal result. For Pt, the bonding is weaker and the calculations predict a residual, but reduced electric field in the LAO.Arras et al. (2012)
In our case, a mm away from the region of the films measured using HAXPES there is an overlayer of colloidal graphite. This carbon film can be simply removed by wiping with a tissue impregnated with isopropanol, thus everyday lab practice confirms one’s chemical intuition, expecting no covalent bonding and charge transfer between the graphite colloids and the LAO surface. Consequently, one would not expect this adjacent graphite contact layer to affect the energetics observed from the exposed LAO surface from which the data presented here are reported. Indeed: when contacting a sample using a minimal amount of silver conductive paint only on the bottom (substrate side) of the sample we observe no change in any core level binding energies (except due to electrical charging) or peak shape when compared to truly contacting the STO/LAO interface of the sample using the colloidal graphite.
Before wrapping up as regards the thickness dependent energy shifts observed in LAO on STO from our HAXPES data, it is only fair to mention that a black or white proof either way on the issue of the possible effect of photo-doping or surface photo-voltage effects (and a proof that the sample contacting method plays no role whatsoever) is not possible at this stage, but our considered opinion is that the core-level shifts we report in Figs. 2 and 3 and their deviation from the simple 0.9 eV unit-cell by unit-cell potential build-up scenario are to be taken seriously.
V Experimental data summary
Summarizing the experimental results:
-
•
We have detected a clear low binding energy shoulder as part of the Ti 2p3/2 core level photoemission feature, consistent with Ti 3d states being populated with electrons for samples with LaAlO3 thicknesses .
-
•
The relative core level binding energies of the LAO layers decrease as a function of LAO thickness in a manner consistent with an increase in the LAO potential. This apparent potential build-up increases at a higher rate for , but decreases again for .
-
•
Although the sign of the binding energy shifts in LAO agree with the simple electrostatic model for potential build-up, their magnitude - some 300 meV between and - is much smaller than the predicted 0.9 eV per unit cell.
-
•
In addition, the data do not support the existence of a unit-cell by unit-cell alteration of the electrostatic environment in the LAO overlayer, as the LAO core level lines show no measurable increase in width as the overlayer thickness increases.
VI DFT calculations
As touched upon earlier, oxygen vacancies could form part of the explanation of both the Ti 3d occupation for , and the reduced potential build-up compared to the simple electron-transfer model. Therefore, we turn to an investigation of the effect of oxygen vacancies on core level shifts by means of DFT calculations. In the computer, we have introduced vacancies on 25% of the oxygen sites in the outermost AlO2 layers of the LAO. As this is the energetically most favorable position for oxygen vacancies in the LAO overlayer Zhong et al. (2010) we will only consider this location for oxygen vacancies. For discussion of oxygen vacancies created in other layers of the system as well as in the outermost AlO2 layer, we refer the reader to Ref. Li et al., 2011. A 25% oxygen vacancy concentration would nominally provide enough carriers (half an electron per unit cell) to completely compensate the potential build-up caused by the polar catastrophe, eliminating the need for electronic reconstruction. In this sense, the calculations presented are only a limiting case scenario, but are instructive nonetheless.
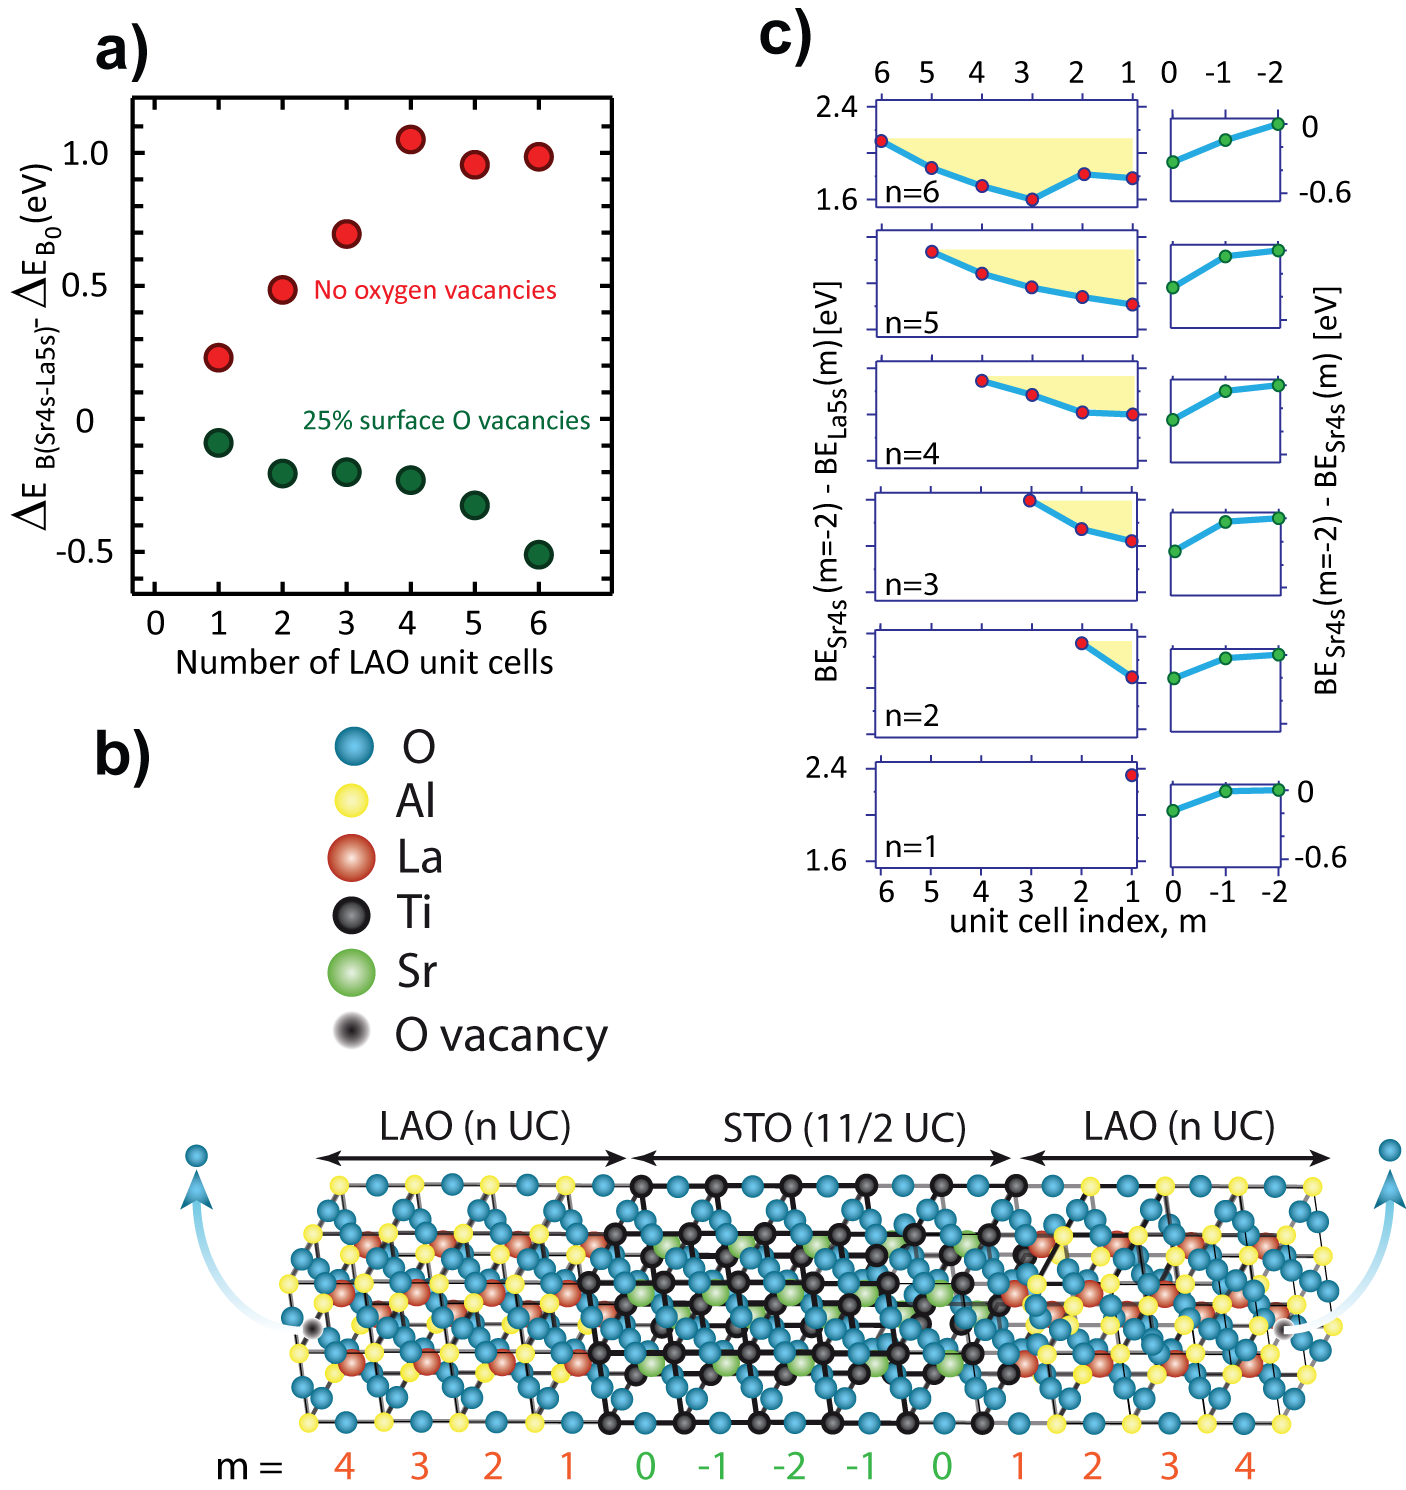
For the DFT slab calculations we focus on symmetric (,11/2,) LAO/STO/LAO slabs in which unit cells of LAO ( atomic layers) on either side of 11/2 unit cells of STO - resulting in two -type interfaces - are repeated periodically, separated by a vacuum region of approximately 15 Å, see Fig. 5b. Because the samples are grown on STO substrates, we fix the in-plane lattice constant at the calculated equilibrium value of STO. We introduce oxygen vacancies on both LAO surfaces in such a way that inversion symmetry in the central layer is maintained. Oxygen vacancies at the surface of the LAO are modelled in a 22 lateral supercell and all atoms are allowed to relax internally. The initial atomic structure is undistorted, without considering TiO6 and AlO6 octahedron tilting and rotation. Due to symmetry breaking induced by the oxygen vacancies at the surface AlO2 layer, atomic relaxation will lead to an out-of-plane tilting of AlO6 octahedra. Li et al. (2011) Even so, it still cannot describe a possible in-plane rotation of GdFeO3-like distortions at the interface,Zhong and Kelly (2008) the investigation of which goes beyond the scope of this article. The computational details have been given elsewhere.Zhong and Kelly (2008); Zhong et al. (2010) The effect of strong correlations, which have been shown to be important in STO/RO (R = La, Pr, Nd, Sm) interfaces,Jang et al. (2011) are not treated explicitly here. Although their inclusion in terms of LDA+U may modify the electrostatic potential profile slightly, it would not change our main theoretical conclusions, which are dominated by the polarity of the system.Zhong et al. (2010) The La 4d and Sr 3d core levels convenient for experiment are too deep in binding energy for the calculations, so instead we use the shallower La 5s and Sr 4s core states to track the potential changes at the La and Sr sites. In Figs. 5b and 5c we introduce a unit cell index, , which is for STO at the LAO interface, negative going deeper into the substrate and in the LAO. We calculated the density of states (DOS) for samples with LAO layer thicknesses , projected onto the last few layers of the STO substrate and each of the LAO layers on top. From these data the La 5s and Sr 4s core level binding energies could be extracted, and these are shown in Table 2 for the 25% oxygen vacancies case and for the vacancy free case. The internal energy reference used for both core level energies is the Sr 4s core level in the central SrO layer of the STO substrate furthest from the interface with LAO ().
| 25% oxygen vacancies | ||||||
|---|---|---|---|---|---|---|
| 1 UC | 2 UC | 3 UC | 4 UC | 5 UC | 6UC | |
| 1 | 2.29 | 2.04 | 2.04 | 2.00 | 1.82 | 1.79 |
| 2 | - | 2.30 | 2.13 | 2.01 | 1.90 | 1.83 |
| 3 | - | - | 2.33 | 2.17 | 1.98 | 1.62 |
| 4 | - | - | - | 2.34 | 2.09 | 1.74 |
| 5 | - | - | - | - | 2.33 | 1.90 |
| 6 | - | - | - | - | - | 2.17 |
| Vacancy free | ||||||
| 1 UC | 2 UC | 3 UC | 4 UC | 5 UC | 6 UC | |
| 1 | 2.57 | 2.48 | 2.23 | 2.37 | 2.34 | 2.23 |
| 2 | - | 3.16 | 2.99 | 2.99 | 2.63 | 2.55 |
| 3 | - | - | 3.77 | 3.54 | 3.02 | 2.96 |
| 4 | - | - | - | 4.36 | 3.54 | 3.30 |
| 5 | - | - | - | - | 4.45 | 3.78 |
| 6 | - | - | - | - | - | 4.36 |
The upper (red) curve in Fig. 5a shows the theory data for the mean-free-path weighted average of the change in the binding energy of the La 5s core level (with respect to an extrapolated value for ) as a function of the LAO layer thickness (also shown in Fig. 3a, but without the bandgap correction). The curve shows a weighted energy shift equivalent to 0.3 eV per up to and is then roughly constant thereafter. The per-layer shifts shown in Table 2 for the vacancy free case correspond, for instance for the sample, to an average potential build-up of about 0.5 eV per layer and are in agreement with the results of Ref. Pentcheva and Pickett, 2009. DFT calculations underestimate the magnitude of the STO band gap, putting it at 2.0 eV, whereas the experimental value is 3.2 eV. Pentcheva and Pickett (2009) This is why - within the electronic reconstruction model - the core levels are in reality expected to shift by 0.9 eV per unit cell, rather than the 0.5 eV per unit cell the DFT data indicate.Pentcheva et al. (2010)
Before discussing the lower (green) curve in Fig. 5a, we turn to the layer-resolved core level data from the calculations in Fig. 5c. Such layer-resolved data are inaccessible in a HAXPES experiment, but nonetheless the discussion of this theory data can give some insight into the more detailed processes underlying the type of global, -dependent energy shifts detectable in experiment.
The right hand panels of Fig. 5c indicate that the (near)-interfacial Sr 4s core level binding energy is greater than that in the ‘bulk’ of the STO substrate () by about 200 meV. This shift is a consequence of the existence of an LaO+ layer immediately atop the TiO2-terminated STO, and the theory data show it to be practically independent of LAO thickness . This, in fact, agrees with the experimental situation for the Sr 3d and Ti 2p core levels, as described at the outset of Section III and shown in Table I.
The left hand panels of Fig. 5c illustrate the development of the La 5s binding energies (referenced to the Sr 4s of the substrate []) for the system with 25% O vacancies. Looking first at the interface (), one sees that the binding energy of the La 5s states increases steadily as the LAO thickness increases, leading to a reduction of BESr4s-BELa5s. On the other hand, the STO-referenced La 5s binding energy at the LAO surface (i.e. for ) remains relatively unchanged as increases.
The -weighted sum of the unit-cell by unit-cell changes shown in Fig. 5c gives an overall trend shown in the lower (green) data-points in Fig. 5a. Here, in analogy to the data plotted in Fig. 3 we consider the -dependent change in La shallow core level binding energy compared to the hypothetical value for , the latter derived from an extrapolation of the values through to (a quantity referred to as in the ordinate label). Fig. 5a shows that, for the case of 25% O vacancies, the La 5s core levels (referenced to a ‘bulk’ Sr 4s level in the center of our slab) shift towards more negative values, indicating a relative increase in the La 5s core level binding energy as increases for the case of 25% O vacancies 666Seeing as in the 25% oxygen deficient case the DFT data predict the system to be metallic right from the outset, the change from a minor downward shift to a clear movement to higher La 5s binding energy at in Fig. 5a is not linked to the onset of metallicity at observed in transport experiments. The fact that the yellow shaded areas in Fig. 5c shift to the left as increases, illustrates more La 5s levels with a higher BE than is the case for the calculation for , and it is also evident that this proportion increases rapidly for . We speculate that one possible cause of this could be an interaction or coupling between holes in the outermost, oxygen deficient surface and electrons at the STO/LAO interface. This interaction could be such that beyond a certain LAO thickness (here ) the energetics within the LAO nearer the STO substrate changes, resulting in the acceleration in the downward trend seen in the green points of Fig. 5a for .. This shift is opposite to the vacancy free case (no oxygen vacancies, red symbols in Fig. 5a), and illustrates how the core level shift to lower binding energies expected from the electronic reconstruction scenario can be negated and even turned around by the presence of oxygen vacancies in the LaAlO3. Because of the non-trivial layer-by-layer changes shown in Fig. 5c, LAO core level binding energies for oxygen vacancy concentrations between zero and 25% cannot simply be arrived at by appropriate interpolation between the red and green points in Fig. 3a. Nevertheless, the ‘limiting-case’ presented of 25% O vacancies does illustrate effectively that such defects - and their electronic consequences - will have a strong effect on the energetics in the LAO layers, and are able to neutralize or even reverse the potential build up in the LaAlO3 layer.
This effect could possibly explain the results of Ref. Segal et al., 2009 as regards the opposite -dependence of the LAO core level binding energies compared to the data presented here, as the samples in Ref. Segal et al., 2009 were grown in a low O2 partial pressure. The experimental data would be consistent with our moderately high O2 partial pressure PLD-grown films being in between the two extremes of the defect-free, pure charge transfer picture and a high oxygen defect scenario. Interpolating between the results from the defect free and 25% oxygen vacancy calculations may suggest that the observed energy shifts are compatible with an oxygen defect concentration in the top AlO2 layer of our samples of 12-16%. However, we emphasize that the experimental data show no sign of a unit-cell-by-unit-cell energy offset, whereas - for less than 25% O defects at the LAO surface - the DFT calculations would predict such a step-wise shift. Because oxygen vacancy formation is driven by the incipient polar catastrophe, this driving force will be diminished upon the formation of vacancies, and the 25% concentration considered here will be a limiting case. In reality, it is therefore not unreasonable to find a lower oxygen defect concentration and -in addition- other kinds of (charged) defects or non-stoichiometries that also play a role in the flattening out of the built-in potential shifts in real samples.
VII Conclusion
In conclusion, we have studied STO/LAO heterointerfaces, grown under moderately high oxygen partial pressure PLD using hard x-ray photoelectron spectroscopy. The aim is the investigation of possible built-in fields in the LaAlO3 by tracking the binding energy differences between the STO and LAO core levels as a function of LAO thicknesses from to unit cells.
Our data show a positive core level shift with increasing LAO thickness (i.e. binding energies of the LAO core levels decrease): the sign of this shift meets the expectations from simple built-in potential considerations. The magnitude of the binding energy shift, however, is very low: only meV, the majority of which occurs between and , and is not of the unit cell by unit cell type. The observed shifts are much lower than the 900 meV per unit cell expected in the simplest ionic polarization models, and remain so even for the large value of 20.
Our DFT calculations show that oxygen defects in the AlO2 surface layer of the LAO offer one possible explanation for this reduction of the internal potential, as 25% oxygen defects (sufficient, in principle, to deliver 0.5 electrons per Ti ion at the interfacial layer) are sufficient to even reverse the direction of the energy shift of the La levels in there LAO.
The facts that we experimentally observe occupation of the Ti 3d states as a shoulder to the Ti 2p signal already for and , and that there are only very modest energy shifts observed per additional LAO unit cell strongly suggest that the critical LAO thickness of seen in transport studies is not directly related to a built-in potential-induced shift of the LAO valence band to meet the STO conduction band states. Consequently, it is apparent that in real materials, the electronic reconstruction scenario is pre-empted by other effects, of which we show oxygen vacancies to be one plausible possibility. Influence from photo-induced charge carriers cannot be excluded in our photoionization-based experiments, but we consider it unlikely that these effects dominate the physics we observe.
Finally, the spectroscopic data do not single out as being special, in contrast to transport data from numerous different groups. This suggests that although the unit-cell by unit-cell potential shift does not - in the end - appear to be the scenario met in real materials, there still must be a mechanism providing ‘action at a distance’, for example from the outermost electrostatic termination layer of the STO/LAO film stack, feeding back to the localized or itinerant character of the states at or near to the STO interface, in this way generating the observed critical thickness seen in transport.
Acknowledgments
This work is part of the research program of the ‘Stichting voor Fundamenteel Onderzoek der Materie (FOM)’, which is financially supported by the ‘Nederlandse Organisatie voor Wetenschappelijk Onderzoek (NWO)’. We also acknowledge funding from the EU (via I3 contract RII3-CT-2004-506008 at Helmholtz Zentrum Berlin). This work was supported by “NanoNed”, a nanotechnology programme of the Dutch Ministry of Economic Affairs and by EC Contract No. IST-033749 ”DynaMax”. and the Veni program (NWO). The use of supercomputer facilities was sponsored by the “Stichting Nationale Computer Faciliteiten” (NCF) which is financially supported by NWO. ES acknowledges S.A. Chambers for useful discussions.
References
- Ohtomo and Hwang (2004) A. Ohtomo and H. Y. Hwang, Nature 427, 423 (2004).
- Huijben et al. (2009) M. Huijben, A. Brinkman, G. Koster, G. Rijnders, H. Hilgenkamp, and D. H. A. Blank, Adv. Mater. 21, 1665 (2009).
- Reyren et al. (2007) N. Reyren, S. Thiel, A. D. Caviglia, L. F. Kourkoutis, G. Hammerl, C. Richter, C. W. Schneider, T. Kopp, A.-S. R etschi, D. Jaccard, M. Gabay, D. A. Muller, J.-M. Triscone, and J. Mannhart, Science 317, 1196 (2007).
- Zubko et al. (2011) P. Zubko, S. Gariglio, M. Gabay, P. Ghosez, and J.-M. Triscone, Annu. Rev. Cond. Mat. Phys. 2, 141 (2011).
- Thiel et al. (2006) S. Thiel, G. Hammerl, A. Schmehl, C. W. Schneider, and J. Mannhart, Science 313, 1942 (2006).
- Okamoto and Millis (2004) S. Okamoto and A. J. Millis, Nature 428, 630 (2004).
- Pentcheva et al. (2010) R. Pentcheva, M. Huijben, K. Otte, W. E. Pickett, J. E. Kleibeuker, J. Huijben, H. Boschker, D. Kockmann, W. Siemons, G. Koster, H. J. W. Zandvliet, G. Rijnders, D. H. A. Blank, H. Hilgenkamp, and A. Brinkman, Phys. Rev. Lett. 104, 166804 (2010).
- Segal et al. (2009) Y. Segal, J. H. Ngai, J. W. Reiner, F. J. Walker, and C. H. Ahn, Phys. Rev. B 80, 241107 (2009).
- Takizawa et al. (2011) M. Takizawa, S. Tsuda, T. Susaki, H. Y. Hwang, and A. Fujimori, Phys. Rev. B 84, 245124 (2011).
- Bristowe et al. (2011a) N. C. Bristowe, P. B. Littlewood, and E. Artacho, Phys. Rev. B 83, 205405 (2011a).
- Li et al. (2011) Y. Li, S. N. Phattalung, S. Limpijumnong, J. Kim, and J. Yu, Phys. Rev. B 84, 245307 (2011).
- Zhong et al. (2010) Z. Zhong, P. X. Xu, and P. J. Kelly, Phys. Rev. B 82, 165127 (2010).
- Schneider et al. (2010) C. W. Schneider, M. Esposito, I. Marozau, K. Conder, M. Doebeli, Y. Hu, M. Mallepell, A. Wokaun, and T. Lippert, Appl. Phys. Lett 97, 192107 (2010).
- Herranz et al. (2007) G. Herranz, M. Basletić, M. Bibes, C. Carrétéro, E. Tafra, E. Jacquet, K. Bouzehouane, C. Deranlot, A. Hamzić, J.-M. Broto, A. Barthélémy, and A. Fert, Phys. Rev. Lett. 98, 216803 (2007).
- Siemons et al. (2007) W. Siemons, G. Koster, H. Yamamoto, W. A. Harrison, G. Lucovsky, T. H. Geballe, D. H. A. Blank, and M. R. Beasley, Phys. Rev. Lett. 98, 196802 (2007).
- Kalabukhov et al. (2007) A. Kalabukhov, R. Gunnarsson, J. Börjesson, E. Olsson, T. Claeson, and D. Winkler, Phys. Rev. B 75, 121404 (2007).
- Willmott et al. (2007) P. R. Willmott, S. A. Pauli, R. Herger, C. M. Schlepütz, D. Martoccia, B. D. Patterson, B. Delley, R. Clarke, D. Kumah, C. Cionca, and Y. Yacoby, Phys. Rev. Lett. 99, 155502 (2007).
- Qiao et al. (2010) L. Qiao, T. C. Droubay, V. Shutthanandan, Z. Zhu, P. V. Sushko, and S. A. Chambers, J. Phys.: Condens. Matter 22, 312201 (2010).
- Pauli et al. (2011) S. A. Pauli, S. J. Leake, B. Delley, M. Björck, C. W. Schneider, C. M. Schlepütz, D. Martoccia, S. Paetel, J. Mannhart, and P. R. Willmott, Phys. Rev. Lett. 106, 036101 (2011).
- Chambers et al. (2010) S. Chambers, M. Engelhard, V. Shutthanandan, Z. Zhu, T. Droubay, L. Qiao, P. Sushko, T. Feng, H. Lee, T. Gustafsson, E. Garfunkel, A. Shah, J.-M. Zuo, and Q. Ramasse, Surf. Sci. Rep. 65, 317 (2010).
- Vonk et al. (2012) V. Vonk, J. Huijben, D. Kukuruznyak, A. Stierle, H. Hilgenkamp, A. Brinkman, and S. Harkema, Phys. Rev. B 85, 045401 (2012).
- Bristowe et al. (2011b) N. C. Bristowe, P. B. Littlewood, and E. Artacho, J. Phys.: Condens. Matter. 23, 081001 (2011b).
- Fadley (2005) C. S. Fadley, Nucl. Instrum. Methods Phys. Res. Sect. A 547, 24 (2005).
- Brinkman et al. (2007) A. Brinkman, M. Huijben, M. Van Zalk, J. Huijben, U. Zeitler, J. Maan, W. Van der Wiel, G. Rijnders, D. Blank, and H. Hilgenkamp, Nat. Mater. 6, 483 (2007).
- Schaefers et al. (2007) F. Schaefers, M. Mertin, and M. Gorgoi, Rev. Sci. Instrum. 78, 123102 (2007).
- Gorgoi et al. (2009) M. Gorgoi, S. Svensson, F. Schaefers, G. Oehrwall, M. Mertin, P. Bressler, O. Karis, H. Siegbahn, A. Sandell, H. Rensmo, W. Doherty, C. Jung, W. Braun, and W. Eberhardt, Nucl. Instrum. Methods Phys. Res. Sect. A 601, 48 (2009).
- Note (1) This enables us to detect core level shifts of the order of meV.
- Tanuma et al. (2003) S. Tanuma, C. J. Powell, and D. R. Penn, Surf. Interface Anal. 35, 268 (2003).
- Sing et al. (2009) M. Sing, G. Berner, K. Goss, A. Muller, A. Ruff, A. Wetscherek, S. Thiel, J. Mannhart, S. A. Pauli, C. W. Schneider, P. R. Willmott, M. Gorgoi, F. Schafers, and R. Claessen, Phys. Rev. Lett. 102, 176805 (2009).
- Note (2) The intra-atomic Coulomb interaction between the 2p core hole created as part of the photoemission process and the Ti 3d shell is larger than the band-width of the Ti 3d related states, thus core level photoemission in a system such as this results in two main final states both with a 2p core hole, but one without and one with an electron in the Ti 3d levels.Morikawa et al. (1996); Fuggle et al. (1980) The integer 3d electron counts in these two final states are reflected in the constant binding energy difference between the positions of the Ti 2p main lines and shoulder-features, and this underlies the labeling of the shoulders as signaling the presence of ‘Ti3+’ ions. Thus, these features in HAXPES do reflect the Ti 3d populations with some fidelity, but do not provide information on the itinerant/localized nature of the electrons in the STO states.
- Yoshimatsu et al. (2008) K. Yoshimatsu, R. Yasuhara, H. Kumigashira, and M. Oshima, Phys. Rev. Lett. 101, 026802 (2008).
- de Jong et al. (2009) S. de Jong, F. Massee, Y. Huang, M. Gorgoi, F. Schaefers, J. Fink, A. T. Boothroyd, D. Prabhakaran, J. B. Goedkoop, and M. S. Golden, Phys. Rev. B 80, 205108 (2009).
- Note (3) The expected core level broadening due to the binding energy shifts we observe (Fig. 3) is within the error bars shown in Fig. 2c.
- Singh-Bhalla et al. (2011) G. Singh-Bhalla, C. Bell, J. Ravichandran, W. Siemons, Y. Hikita, S. Salahuddin, A. F. Hebard, H. Y. Hwang, and R. Ramesh, Nat Phys 7, 80 (2011).
- Huijben et al. (2006) M. Huijben, G. Rijnders, D. H. A. Blank, S. Bals, S. V. Aert, J. Verbeeck, G. V. Tendeloo, A. Brinkman, and H. Hilgenkamp, Nat. Mater. 5, 556 (2006).
- Tebano et al. (2012) A. Tebano, E. Fabbri, D. Pergolesi, G. Balestrino, and E. Traversa, ACS Nano 6, 1278 (2012).
- Rastogi et al. (2012) A. Rastogi, J. J. Pulikkotil, S. Auluck, Z. Hossain, and R. C. Budhani, Phys. Rev. B 86, 075127 (2012).
- Note (4) Private communication: Dr. Mingqi Wang, VG Scienta.
- Note (5) Data from: http://henke.lbl.gov/optical_constants/.
- Son et al. (2010) W.-J. Son, E. Cho, J. Lee, and S. Han, J. Phys.: Condens. Matter. 22, 315501 (2010).
- Arras et al. (2012) R. Arras, V. G. Ruiz, W. E. Pickett, and R. Pentcheva, Phys. Rev. B 85, 125404 (2012).
- Zhong and Kelly (2008) Z. Zhong and P. J. Kelly, Europhys. Lett. 84, 27001 (2008).
- Jang et al. (2011) H. W. Jang, D. A. Felker, C. W. Bark, Y. Wang, M. K. Niranjan, C. T. Nelson, Y. Zhang, D. Su, C. M. Folkman, S. H. Baek, S. Lee, K. Janicka, Y. Zhu, X. Q. Pan, D. D. Fong, E. Y. Tsymbal, M. S. Rzchowski, and C. B. Eom, Science 331, 886 (2011).
- Pentcheva and Pickett (2009) R. Pentcheva and W. E. Pickett, Phys. Rev. Lett. 102, 107602 (2009).
- Note (6) Seeing as in the 25% oxygen deficient case the DFT data predict the system to be metallic right from the outset, the change from a minor downward shift to a clear movement to higher La 5s binding energy at in Fig. 5a is not linked to the onset of metallicity at observed in transport experiments. The fact that the yellow shaded areas in Fig. 5c shift to the left as increases, illustrates more La 5s levels with a higher BE than is the case for the calculation for , and it is also evident that this proportion increases rapidly for . We speculate that one possible cause of this could be an interaction or coupling between holes in the outermost, oxygen deficient surface and electrons at the STO/LAO interface. This interaction could be such that beyond a certain LAO thickness (here ) the energetics within the LAO nearer the STO substrate changes, resulting in the acceleration in the downward trend seen in the green points of Fig. 5a for .
- Morikawa et al. (1996) K. Morikawa, T. Mizokawa, A. Fujimori, Y. Taguchi, and Y. Tokura, Phys. Rev. B 54, 8446 (1996).
- Fuggle et al. (1980) J. C. Fuggle, M. Campagna, Z. Zolnierek, R. Lässer, and A. Platau, Phys. Rev. Lett. 45, 1597 (1980).