Molecular Dynamics Simulations of Evaporation-Induced Nanoparticle Assembly
Abstract
While evaporating solvent is a widely used technique to assemble nano-sized objects into desired superstructures, there has been limited work on how the assembled structures are affected by the physical aspects of the process. We present large scale molecular dynamics simulations of the evaporation-induced assembly of nanoparticles suspended in a liquid that evaporates in a controlled fashion. The quality of the nanoparticle crystal formed just below the liquid/vapor interface is found to be better at relatively slower evaporation rates, as less defects and grain boundaries appear. This trend is understood as the result of the competition between the accumulation and diffusion times of nanoparticles at the liquid/vapor interface. When the former is smaller, nanoparticles are deposited so fast at the interface that they do not have sufficient time to arrange through diffusion, which leads to the prevalence of defects and grain boundaries. Our results have important implications in understanding assembly of nanoparticles and colloids in non-equilibrium liquid environments.
I. INTRODUCTION
Large, defect-free crystalline arrays of nanoparticles (NPs) are critical for many technologically important ultra thin film materials including filters, sensors, optical devices, and magnetic storage media.Zhang et al. (2010); He et al. (2011) One common method for dispersing nanoparticles is to suspend them in solution, spread the suspension on a surface, and then evaporate the solvent.Brinker et al. (1999); Bresme and Oettel (2007); Zhang et al. (2010); pic This technique has been used to assemble NPs into desired structures such as nanoclusters, rings, wires, stripes, films, and superlattices. Lin et al. (2001); Wyrwa et al. (2002); Liu et al. (2002); Hoogenboom et al. (2004); Bigioni et al. (2006); Xu et al. (2007); Derkachov et al. (2008); Chen et al. (2009); Xiao et al. (2009); Jeong et al. (2010); He et al. (2011); Kanjanaboos et al. (2011); Dong et al. (2011); Fan et al. (2012) The factors that influence the assembled structure include the evaporation kinetics of the solvent, the flow properties and concentration of NPs in the solution, the NP-NP interactions, the interactions between NPs and the liquid/vapor interface, and the wetting/dewetting behavior of the suspension on the solid surface.Jeong et al. (2010) One ubiquitous example is the ”coffee-ring” stain left behind after a particle-laden drop has evaporated. A simple and beautiful physical picture of this class of phenomena was first clarified by Deegan et al.Deegan et al. (1997) When the drop dries, a flow of liquid from the interior of the drop to its edge emerges to replenish the liquid that has evaporated from the region around the pinned contact line. This flow convects particles to the drop’s edge, where they form ring-like depositions. The model was tested recently by Chen et al. on the molecular scale with molecular dynamics (MD) simulations.kop
Recently, Marin et al. demonstrated an order-to-disorder transition of the particle organization in coffee-ring stains.Álvaro G. Marín et al. (2011a, b) In the early stage of evaporation, the deposition speed of particles at the contact line is low and they have time to arrange into an ordered superlattice by Brownian diffusion. However, at the end of evaporation, because of the increase of the flux velocity toward the contact line, particles are deposited at a high speed and jammed into a quenched disordered phase as the result of “rush-hour” traffic. The experiment clearly showed the importance of deposition/accumulation and diffusive time scales on controlling the particle ordering during solvent evaporation.
Bigioni et al. showed earlier that particle accumulation and diffusion times determine the assembly behavior and growth kinetics of monolayers of gold NPs with diameters nm at a liquid/vapor interface.Bigioni et al. (2006); Narayanan et al. (2004); Lin et al. (2001) They found that in order to induce NP assembly at the interface, the evaporation rate of the solvent has to be rapid and an attractive interaction between the NPs and interface is required. The latter was induced by the excess of dodecanethiol in a toluene solution where gold NPs were suspended. After the assembly is initiated, the growth kinetics of each crystalline domain can be exponential, sub-exponential, or linear in time, depending on the ratio of a diffusive length scale to the domain size. By tuning the concentration of dodecanethiol, Bigioni et al. were able to make long-range ordered arrays of gold NPs over macroscopic areas.Bigioni et al. (2006)
The work of of Bigioni et al. showed that evaporation generally needs to be fast so that the accumulation of NPs at the interface passes certain critical density, leading to the nucleation and growth of 2-dimensional (2D) crystals. However, if evaporation is too fast, the crystalline quality may diminish because NPs do not have sufficient time to arrange via diffusion, but instead quenched disordered structures will emerge, similar to the “rush-hour” effect observed in the coffee-ring stains. This trend was actually observed earlier in an experiment of Im and Park using larger polystyrene colloids with diameters nm,Im and Park (2002) where the evaporation rate was tuned by varying the temperature. They found that there exists an optimum evaporation temperature that yields particle arrays of the highest quality at the water/air interface. When the evaporation temperature is higher than the optimum one, the accumulation rate of colloids at the interface is too large, leading to defects in the array. It is thus interesting to determine if the effect of evaporation rate on particle assembly persists to smaller NPs in the fast-evaporation regime, which nicely fits the accessible length and time scales of MD simulations. This was the motivation of our work reported here. To anticipate the final results, we will show that there exits an optimum rate, determined by the diffusive times of NPs along the interface, at which the 2D crystal of NPs formed near the interface has the highest quality even without the “annealing” step.
The remainder of this paper is organized as follows. The simulation methods are briefly introduced in Sec. II. Then Sec. III is devoted to results and discussion. Conclusions are included in Sec. IV.
II. SIMULATION METHODS
We modeled the liquid solvent and its vapor with atoms interacting through a standard Lennard-Jones (LJ) potential, , where is the distance between two atoms, the unit of energy, and the diameter of atoms. The potential was truncated and shifted to 0 at . The mass of each LJ atom is and a time unit can be defined as . The NPs of diameter were assumed to consist of a uniform distribution of atoms interacting with a LJ potential. For spherical particles, their mutual interaction can be determined analytically by integrating over all the interacting LJ atom pairs between the two particles.Everaers and Ejtehadi (2003) The resulting potential depends on , the inter-NP distance, and a Hamaker constant that characterizes the interaction strength. We used a standard value and a cut-off . This led to a purely repulsive NP-NP interaction, which physically corresponds to adding a short surfactant coating on NPs to avoid flocculation.in’t Veld et al. (2009); Grest et al. (2011) The interaction between LJ atoms and NPs was determined similarly by integrating the interaction between a single LJ atom and those within a NP. We set the corresponding Hamaker constant , which with a cut-off of resulted in NPs that were fully solvated and dispersed in the LJ solvent.Cheng and Grest (2012)
The simulation cell was a rectangular box of dimensions . The liquid/vapor interface was parallel to the - plane, in which periodic boundary conditions were employed. In the direction, the LJ atoms and NPs were confined by two flat walls at and , respectively. The depth of the liquid was at least and the vapor was at least thick before evaporation. The resulting liquid and vapor densities are and , respectively. Note that LJ monomers have a vapor density higher than most real fluids (Fig. 1(a)). This implies that the vaporization rate of LJ liquids is quite large and they can evaporate very fast.Cheng et al. (2011) To provide a rough mapping of the evaporation rates (number fluxes of solvent atoms) in our simulations to experimental values, we take nm and ps, the slowest evaporation rate we can simulate with MD is at the order of , corresponding to . This is about an order of magnitude higher than the maximum rate at which water evaporates, which is not surprising since water has an unusually high boiling temperature and surface tension compared with the LJ liquids studied here.
All simulations were performed using LAMMPS.Plimpton (1995); lam The equations of motion were integrated using a velocity-Verlet algorithm with a time step . During the equilibration, the temperature was held at by a Langevin thermostat weakly coupled to all LJ atoms with a damping constant . Once the liquid/vapor interface was equilibrated, the Langevin thermostat was removed except for those liquid atoms within of the lower wall at . We confirmed that the evaporation occurring at the interface was not affected by the thermostat.Cheng et al. (2011)
III. RESULTS AND DISCUSSION
A. Effect of Evaporation Rate
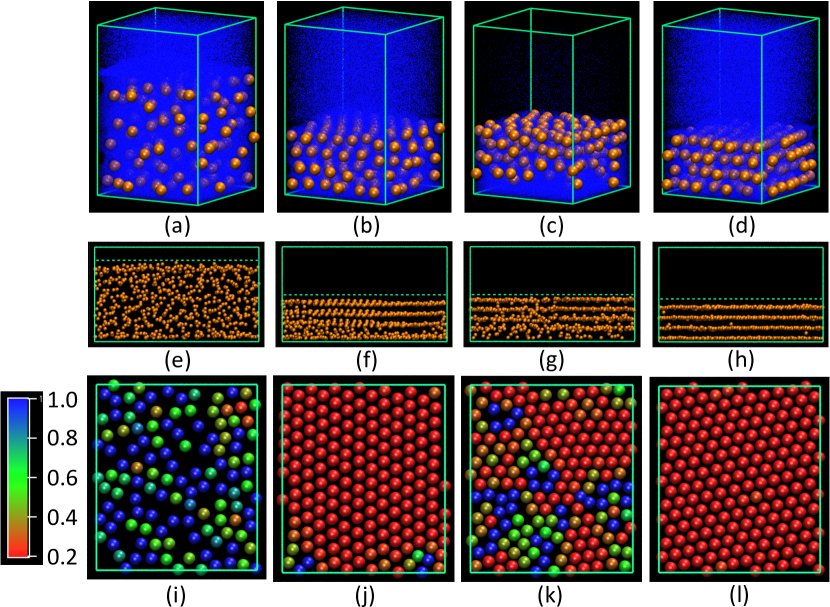
Most of our simulations started with 668 NPs dispersed in a liquid that contained about 7.1 million LJ atoms,not (a) as shown in Fig. 1(a). The volume fraction of NPs was 0.205, which was based on the diameter of bare NPs. If we took into account the effect of a layer of solvent of thickness that was effectively attached to NPs,Grest et al. (2011) the effective volume fraction of NPs would be even higher, roughly by a factor of 1.16. We have studied systems of which the liquid/vapor interface has various aspect ratios. Since the NPs were spherical and with a short-range isotropic interaction, their ordering at the interface was expected to be hexagonal. Thus to reduce the finite size effects, we focused on a system with a cross-section that was commensurate with hexagonal packing, i.e., (Figs. 1 and 2). and were chosen so that the lattice spacing in a perfectly ordered hexagonal array would be the same as that found after some of the solvent was evaporated in a system that had a square cross-section with . However, this latter system has a larger interfacial area than the previous one. To reduce the potential influence of areal size, we studied another system of which was increased to while was kept at , so that not only the interfacial area was close to that of the square interface, but also the aspect ratio of the interface favored a hexagonal packing with a lattice spacing found in the previous two systems. Our results indicated that the size and aspect ratio of the interface had negligible effects on the particle packing. Below we mainly discuss the results for the first system and include the results of other two systems in Supplementary Material.not (b)
The side view of the NP distribution in the equilibrium solution is shown in Fig. 1(e), where the dashed line indicates the location of the liquid/vapor interface. NPs are almost uniformly distributed in the solvent. Note that during all our simulations, including the evaporation runs described below, all NPs were fully solvated in the liquid solvent. NPs within of the interface were grouped together and referred as the top layer. At equilibrium their areal coverage is about 45%, which is below the critical coverage 70% at the 2D hexatic phase transition.Binder et al. (2002) As shown in Fig. 1(i), the layer is clearly disordered.
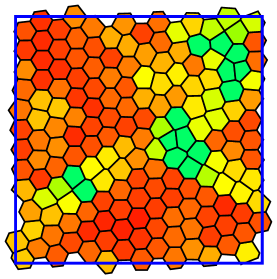
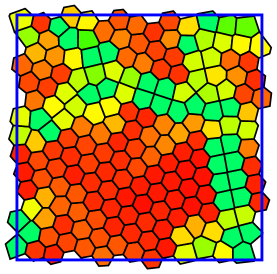
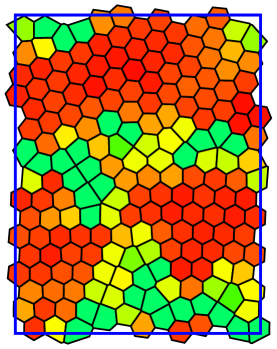
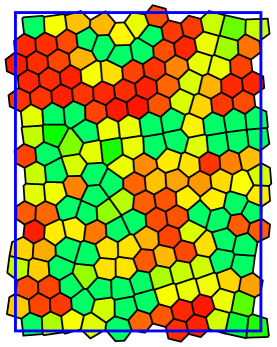
To quantitatively characterize the in-plane packing geometry, we have defined an order parameter for each NP. A Voronoi construction was performed and those NPs with 6 neighbors were identified since in a close 2D packing each particle was expected to have 6 nearest neighbors forming a hexagon. The angle corresponding to the -th side of the hexagon was found and was computed as . We found that was typically in the range of to . So we normalized by and the normalized was thus in the range of to . indicates a perfect hexagonal packing, while indicates situations far from a hexagonal lattice. The Voronoi construction also showed that all other NPs had either 5 or 7 neighbors and they were assigned to indicate that their packing configuration was not hexagonal. In Fig. 1(i)-(l), NPs are colored according to their values of (NPs with are colored red and with are colored blue). As shown in Fig. 1(i), in an equilibrated solution NPs near the interface are randomly distributed without any ordering, which is also clear from the Voronoi construction shown in Fig. 2(a).
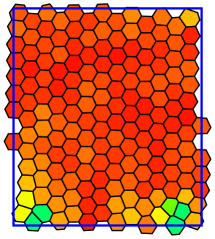
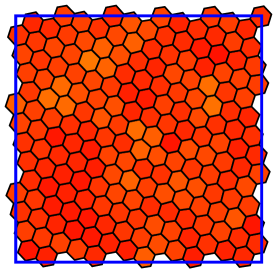
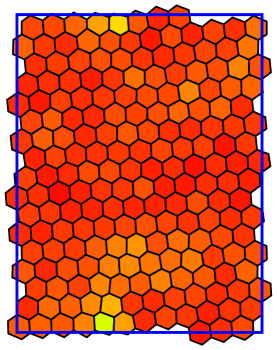
Evaporation of the solvent was modeled by introducing a deletion zone from to . All or a certain number of vapor atoms in the deletion zone were removed every . The former mimicked evaporation into a vacuum which proceeded at the maximum rate, while the latter simulated evaporation at a fixed rate , namely the rate of removal of solvent atoms out of the simulation box. Results in Figs. 1(b), (f), and (j) are for a system of which the solvent had evaporated at since . During evaporation, the liquid film where NPs were dispersed shrunk, and NPs started to accumulate below the liquid/vapor interface that impinged from above. In this case the vapor density was only slightly reduced compared with its equilibrium value (Fig. 1(b)) throughout the whole simulation and the interface always remained close to equilibrium. As a result, the rate was roughly the same as the actual outward flux of solvent atoms near the liquid/vapor interface or in the vapor. The side view of the NP distribution in Fig. 1(f) shows that NPs formed layers where their concentration had peaks. At , 52% of the solvent ( million atoms) had evaporated, and the volume fraction of NPs increased to 0.35. At least 3 layers of NPs were formed as shown in Fig. 1(f), with 171 NPs in the top layer. Figure 1(j) shows the in-layer structure of these NPs, from which a hexagonal packing is clearly visible. This is also evident from the corresponding Voronoi construction (Fig. 2(b)).
Note that the number of layers induced by evaporation depends on the volume fraction of NPs and the interfacial area. In many experiments, NP solutions are quite dilute and only one layer of NPs forms, but more layers were also experimentally observed,Lin et al. (2001) as in our simulations. The structures in the NP layers below the top one were essentially similar but with a diminishing crystalline quality as the distance from the interface increased. Two consecutive layers were roughly in-registry as in fcc or hcp crystals, but we had too few layers to distinguish the two crystal structures. For clarity, we focus on the in-plane structure in the top NP layer below.
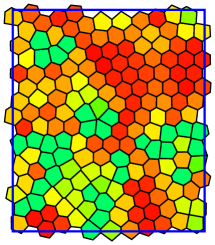
The results in Figs. 1(c), (g), and (k) are for a system with the same starting state, but with the solvent evaporating into a vacuum since . Here the vapor was quickly depleted (Fig. 1(c)) and the evaporation at the liquid/vapor interface proceeded at the maximum rate, which decreased with time and eventually reached a plateau value around (see Fig.3). The actual flux of solvent atoms at the interface was lower than for the first during which the vapor depletion occurred, and then the two were almost identical. It only took to evaporate roughly the same amount (52%) of solvent as in the previous case with a fixed rate. The layering of NPs was obvious from the side view (Fig. 1(g)). However, each layer was composed of several 2D grains separated by grain boundaries, where the packing deviated significantly from a hexagonal lattice as indicated by colors based on the values of (Fig. 1(k)) and the corresponding Voronoi construction (Fig. 2(c)) for NPs in the top layer.
Comparing Figs. 1(j) and (k) (or Figs. 2(b) and (c)) shows that the slower evaporation led to a NP packing with a better crystalline order. The same trend was also found for the other two systems evaporating at various rates (see Figs. S1(a) and (b), and Figs. S2(a) and (b) in Supplementary Material).not (b) This effect of evaporation rate on the assembly quality can be understood on the basis of two time scales: one describes how fast NPs accumulate at the interface, and another is determined by the diffusivity of NPs along the interface. In the steady state, the liquid/vapor interface recedes almost uniformly, with a receding velocity that is related to through , where is the liquid density. Using a model discussed by Bigioni et. al.,Bigioni et al. (2006) a time scale can be defined to describe the speed of NP accumulation at the interface, where is the NP concentration in the solution. After NPs reach the top layer, they primarily diffuse along the interface. We denote the diffusive time scale as , which can be estimated as with as the diffusion coefficient. For and ,Cheng and Grest (2012) the diffusive time is .
NPs accumulate faster than they diffuse in the limit , where the growth of 2D crystals is induced primarily by NP addition. As it is unlikely that crystalline grains in different spatial regions have orientations that match, this leads to the occurrence of grain boundaries when grains meet. However, in the opposite limit , NPs are added to the top layer slowly and small crystal regions can act as seeds which then grow larger through NP diffusion. In this case defects and grain boundaries are less likely to appear. The NP layer also has more time to relax into a uniform hexagonal lattice even if imperfections in the packing occur. For the system shown in Figs. 1(k) and 2(c), the solvent evaporated fast and the interface velocity was about , which leads to . The value of has a range since the NP concentration increased as the solvent evaporated. For Figs. 1(j) and 2(b) where was fixed at , was about , which gives . As expected, in the fast evaporation (into a vacuum), while in the slow evaporation (at a small fixed rate).
Since and are related through , by equating to one can estimate a critical rate . When , an almost defect-free hexagonal NP array is expected; while for , grain boundaries and point defects will appear in the 2D crystal induced by evaporation. For our simulations, . When the solvent evaporated into a vacuum, the evaporation rate was always larger than , leading to NP layers with defects and grain boundaries. However, when was reduced and fixed at a value below , the assembly quality in NP layers was greatly improved. Furthermore, from experiments it is already known that if the evaporation is too slow, then the density of NPs at the interface never reaches the critical nucleation density since NPs have abundant time to diffuse back into the bulk of the solution, and assembly is not initiated in the first place.Lin et al. (2001); Bigioni et al. (2006) Combined with this observation, our simulations indicate that there exits an optimum evaporation rate at which the NP arrays formed near the liquid/vapor interface are of the highest quality. Though it is very difficult to precisely calculate from simulations, our results indicate that should be about an oder of magnitude smaller than since only a few defects and grain boundaries were observed at (Fig. 2(b) and Fig. S1(a) in Supplementary Material),not (b) while more were seen at (Fig. S2(a) in Supplementary Material).not (b) Therefore, a reasonable estimate is .
B. Effect of Annealing
Since the volume fraction of NPs was only 0.35 in Fig. 1(c) and still below the critical fraction of hard-sphere crystallization (),Hoover and Ree (1968) we expected that the layering structure in Fig. 1(g) would be destroyed when the evaporation was stopped and the system was allowed to relax. However, this was not the case on MD time scales, and the layering became even more dramatic after the evaporation ceased at and the system had re-requilibrated, as shown in Fig. 1(d) and (h) at . The robustness of layering was partly due to the fact that some solvent evaporated to fill the vapor-depleted region above the liquid and to re-establish the liquid/vapor equilibrium. This increased the volume fraction of NPs in the solution to 0.38. Furthermore, melting requires the diffusion of NPs in the direction perpendicular to the layers, which was hindered by the ordered structure in each layer and the commensurability between layers. Our results thus indicate that the system was dominated by non-equilibrium dynamics with long relaxation and equilibration times, much larger than those achievable with MD simulations.
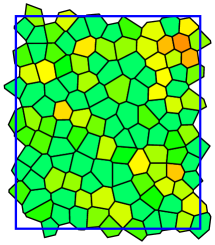
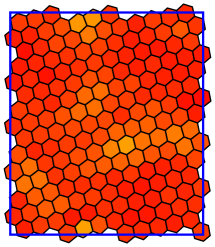
The organization of NPs in the top layer was greatly improved after relaxation. The grain boundaries in this layer completely disappeared after approximately and NPs formed an almost perfect hexagonal lattice, as shown in Fig. 1(l) and Fig. 2(d) (also see Figs. S1(c) and S2(c) in Supplementary Material).not (b) This finding is consistent with an experimental observation that alternative evaporation and relaxation produce 2D crystals of NPs with less defects.ray It reveals the importance of relaxation that allows imperfections in the NP packing to heal via structural re-arrangement, which only gradually proceeds through the diffusion of NPs. The improvement of the crystalline quality was also observed for the other layers below the top one after annealing, though over the time scale of simulations they were still not completely ordered. For NPs with diameters at the nanometer scale and without mutual attractions as studied here, their diffusion is relatively fast and thus the time scale of structural re-arrangement is accessible with MD. However, it can be imagined that for larger NPs or colloidal particles in the micrometer range and with attractive inter-particle interactions, diffusion becomes much slower and it will take much longer time to remove defects and grain boundaries. This is one of the reasons that they are frequently observed in assembly experiments.Lin et al. (2001); Bigioni et al. (2006)
C. Effect on Evaporation Rate of Assembled Nanoparticle Layers
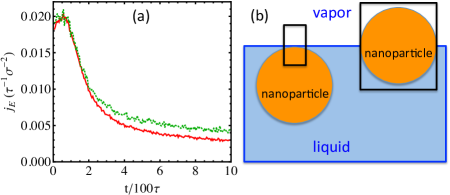
When NPs crystallize below the liquid/vapor interface, they slow down the evaporation, since liquid atoms need to circumvent NPs to reach the interface and then evaporate. This blockage effect on evaporation is shown in Fig. 3(a), where the rate is plotted against time for a neat solvent and the NP solution that both evaporated into a vacuum. At earlier times, NPs were dilute near the interface and liquid atoms essentially did not feel their presence. Therefore was roughly the same for the two systems. At later times, since NPs started to form a dense layer below the interface, for the NP solution became smaller than that for the pure solvent. The factor of reduction was 25% when reached the plateau values in the two systems at . However, the reduction in is not as dramatic as what a naive estimate of the areal reduction of the liquid/vapor interface would indicate. The reason is that NPs still sit below the interface in our simulations and their top sides only barely touched the liquid/vapor transition zone. As illustrated in Fig. 3(b), only liquid atoms attached to the surface around the north pole of NPs were affected in terms of evaporation. At several away from this region (outside the box enclosing the north pole of the immersed NP in Fig. 3(b)), the distance from the interface to NP surface quickly increases beyond a few diameters of LJ atoms, and the evaporation of the liquid there was not influenced by the presence of NPs. However, if the NP layer straddled the liquid/vapor interface (see the straddling NP in Fig. 3(b)), we would expect to decrease by an order of magnitude compared with the case of a neat solvent. In this case, the interfacial area is indeed reduced by NPs. The evaporation cannot occur in the area covered by NPs and will slow down significantly.
IV. CONCLUSIONS
To summarize, we have studied the assembly of NPs in a solution induced by solvent evaporation with MD simulations. Our results showed that NPs formed layers which started from below the liquid/vapor interface. The structure in each layer found in simulations is similar to that observed in many experiments,Lin et al. (2001); Narayanan et al. (2004); Bigioni et al. (2006) i.e., a close-packed hexagonal 2D crystal. Interestingly, we found that the assembly quality was better when the evaporation rate was relatively slower. This trend was understood with a simple physical picture based on two time scales. The time scale associated with NP accumulation in the top layer, which is controlled by the evaporation rate, needs to be larger than the diffusion time of NPs along the interface in order to form a defect-free 2D crystal. Otherwise, growth of crystals at different locations leads to grains with different orientations, and grain boundaries and point defects appear when grains meet. Since it is known that evaporation needs to fast enough to initiate interfacial NP assembly in the first place, our simulations indicate that there exits an optimum evaporation rate at which the packing quality of NP arrays at the liquid/vapor interface is the best. If evaporation proceeds at a higher rate, a relaxation process, which can have a large time scale depending on the particle size and interaction, is needed to “anneal” the crystal and remove the imperfections in the packing. Our simulations also showed the blockage effect on evaporation because of the presence of the dense NP layer near the interface. The effective area of the interface was reduced and evaporation slowed down compared with a neat solvent. However, in our simulations NPs were still immersed in the solvent and only the solvent atoms in the region around the top of NPs were actually affected in terms of evaporation and therefore only a minor reduction in the evaporation rate was observed.
Acknowledgments
This research used resources of the National Energy Research Scientific Computing Center (NERSC), which is supported by the Office of Science of the United States Department of Energy under Contract No. DE-AC02-05CH11231, and the Oak Ridge Leadership Computing Facility located in the National Center for Computational Sciences at Oak Ridge National Laboratory, which is supported by the Office of Science of the United States Department of Energy under Contract No. DE-AC05-00OR22725. These resources were obtained through the Advanced Scientific Computing Research (ASCR) Leadership Computing Challenge (ALCC). This work is supported by the Laboratory Directed Research and Development program at Sandia National Laboratories. Sandia National Laboratories is a multi-program laboratory managed and operated by Sandia Corporation, a wholly owned subsidiary of Lockheed Martin Corporation, for the U.S. Department of Energy’s National Nuclear Security Administration under contract DE-AC04-94AL85000.
References
- Zhang et al. (2010) J. Zhang, Y. Li, X. Zhang, and B. Yang, Adv. Mater. 22, 4249 (2010).
- He et al. (2011) J. He, X.-M. Lin, H. Chan, L. Vuković, Král, and H. M. Jaeger, Nano Lett. 11, 2430 (2011).
- Brinker et al. (1999) C. J. Brinker, Y. Lu, A. Sellinger, and H. Fan, Adv. Mater. 11, 579 (1999).
- Bresme and Oettel (2007) F. Bresme and M. Oettel, J. Phys.: Condens. Matter 19, 413101 (2007).
- (5) Pichumani M., Bagheri P., Poduska K. M., Viñas W. G., Yethiraj A., arXiv:1210.6662 [cond-mat.soft].
- Lin et al. (2001) X.-M. Lin, H. M. Jaeger, C. M. Sorensen, and K. J. Klabund, J. Phys. Chem. B 105, 3353 (2001).
- Wyrwa et al. (2002) D. Wyrwa, N. Beyer, and G. Schmid, Nano lett. 2, 419 (2002).
- Liu et al. (2002) S. Liu, T. Zhu, R. Hu, and Z. Liu, Phys. Chem. Chem. Phys. 4, 6059 (2002).
- Hoogenboom et al. (2004) J. P. Hoogenboom, C. Rétif, E. de Bres, M. van de Boer, A. K. van Langen-Suurling, J. Romijn, and A. van Blaaderen, Nano lett. 4, 205 (2004).
- Bigioni et al. (2006) T. P. Bigioni, X.-M. Lin, T. T. Nguyen, E. I. Corwin, T. A. Witten, and H. M. Jaeger, Nature Mater. 5, 265 (2006).
- Xu et al. (2007) J. Xu, J. Xia, and Z. Lin, Angew. Chem. Int. Ed. 46, 1860 (2007).
- Derkachov et al. (2008) G. Derkachov, K. Kolwas, D. Jakubczyk, M. Zientara, and M. Kolwas, J. Phys. Chem. C 112, 16919 (2008).
- Chen et al. (2009) J. Chen, W.-S. Liao, X. Chen, T. Yang, S. E. Wark, D. H. Son, J. D. Batteas, and P. S. Cremer, ACS Nano 3, 173 (2009).
- Xiao et al. (2009) L. Xiao, R. Zhou, Y. He, Y. Li, and E. S. Yeung, J. Phys. Chem. C 113, 1209 (2009).
- Jeong et al. (2010) S. Jeong, L. Hu, H. R. Lee, E. Garnett, J. W. Choi, and Y. Cui, Nano lett. 10, 2989 (2010).
- Kanjanaboos et al. (2011) P. Kanjanaboos, A. Joshi-Imre, X.-M. Lin, and H. M. Jaeger, Nano Lett. 11, 2567 (2011).
- Dong et al. (2011) A. Dong, X. Ye, J. Chen, and C. B. Murray, Nano lett. 11, 1804 (2011).
- Fan et al. (2012) J. A. Fan, K. Bao, L. Sun, J. Bao, V. N. Manoharan, P. Nordlander, and F. Capasso, Nano lett. 12, 5318 (2012).
- Deegan et al. (1997) R. D. Deegan, O. Bakajin, T. F. Dupont, G. Huber, S. R. Nagel, and T. A. Witten, Nature 389, 827 (1997).
- (20) Chen W., Koplik J., Kretzschmar I., arXiv:1203.1910 [cond-mat.soft].
- Álvaro G. Marín et al. (2011a) Álvaro G. Marín, H. Gelderblom, D. Lohse, and J. H. Snoeiger, Phys. Rev. Lett. 107, 085502 (2011a).
- Álvaro G. Marín et al. (2011b) Álvaro G. Marín, H. Gelderblom, D. Lohse, and J. H. Snoeiger, Phys. Fluids 23, 091111 (2011b).
- Narayanan et al. (2004) S. Narayanan, J. Wang, and X.-M. Lin, Phys. Rev. Lett. 93, 135503 (2004).
- Im and Park (2002) S. H. Im and O. O. Park, Langmuir 18, 9642 (2002).
- Everaers and Ejtehadi (2003) R. Everaers and M. R. Ejtehadi, Phys. Rev. E 67, 041710 (2003).
- in’t Veld et al. (2009) P. J. in’t Veld, M. K. Petersen, and G. S. Grest, Phys. Rev. E 79, 021401 (2009).
- Grest et al. (2011) G. S. Grest, Q. Wang, P. J. in’t Veld, and D. J. Keffer, J. Chem. Phys. 134, 144902 (2011).
- Cheng and Grest (2012) S. Cheng and G. S. Grest, J. Chem. Phys. 136, 214702 (2012).
- Cheng et al. (2011) S. Cheng, J. B. Lechman, S. J. Plimpton, and G. S. Grest, J. Chem. Phys. 134, 224704 (2011).
- Plimpton (1995) S. J. Plimpton, J. Comp. Phys. 117, 1 (1995).
- (31) http://lammps.sandia.gov/.
- not (a) We also simulated a larger system starting with 720 NPs dispersed in a solvent containing about 17 million LJ atoms at a volume fraction 0.1. Results are qualitatively similar to those reported here, which indicates that our results are robust and insensitive to both the starting volume fraction of NPs and the finite size of the liquid/vapor interface.
- not (b) See Supplementary Material Document No.XXXXX for Voronoi constructions of the other two systems with , and and , respectively. For information on Supplementary Material, see http://www.aip.org/pubservs/epaps.html.
- Binder et al. (2002) K. Binder, S. Sengupta, and P. Nielaba, J. Phys.: Condens. Matter 14, 2323 (2002).
- Hoover and Ree (1968) W. G. Hoover and F. H. Ree, J. Chem. Phys. 49, 3609 (1968).
- (36) W. J. Ray, private communication.
Supplementary Material
In this Supplementary Material, we include Voronoi constructions of NPs in the top layer for the other 2 systems that we have studied. They underwent various evaporation schemes, as is detailed in the captions of each figure. Figure S1 is for a system with a square cross section (). Figure S2 is for another system that had a similar area, but the sizes of the liquid/vapor interface were adjusted to accommodate an integer number of NPs in both and directions ( and ), respectively.