The Coldest Brown Dwarf (Or Free Floating Planet)?: The Y Dwarf WISE 1828+2650
Abstract
We have monitored the position of the cool Y dwarf WISEPA J182831.08+265037.8 using a combination of ground- and space-based telescopes and have determined its distance to be 11.2 pc. Its absolute H magnitude, M mag, suggests a mass in the range 0.5-20 MJup for ages of 0.1-10 Gyr with an effective temperature in the range 250-400 K. The broad range in mass is due primarily to the unknown age of the object. Since the high tangential velocity of the object, 51 km s-1, is characteristic of an old disk population, a plausible age range of 2-4 Gyr leads to a mass range of 3-6 MJup based on fits to the (highly uncertain) COND evolutionary models. The range in temperature is due to the fact that no single model adequately represents the 1-5 m spectral energy distribution (SED) of the source, failing by factors of up to 5 at either the short or long wavelength portions of the spectral energy distribution. The appearance of this very cold object may be affected by non-equilibrium chemistry or low temperature condensates forming clouds, two atmospheric processes that are known to be important in brown dwarf atmospheres but have proven difficult to model. Finally, we argue that there would have to be a very steep upturn in the number density of late type Y-dwarfs to account for the putative population of objects suggested by by recent microlensing observations. Whether WISE 1828+2650 sits at the low mass end of the brown dwarf population or is the first example of a large number of “free-floating” planets is not yet known.
1 Introduction
A long term goal of infrared sky surveys has been the detection and characterization of sub-stellar objects of progressively lower temperature and mass (Kirkpatrick, Beichman & Skrutskie, 1997). The Two Micron All sky survey (2MASS), DEep Near Infrared Southern Sky Survey (DENIS) and Sloan Digital Sky Survey (Skrutskie et al., 2006; Epchtein et al., 1997; York et al., 2000) identified the first bona fide field brown dwarfs while coronagraphic studies found the first bona fide brown dwarf companion, Gliese 229B (Nakajima et al., 1995; Oppenheimer et al., 1998). These studies led to the acceptance of the first new spectral classes to be named in over 50 years, the L and T dwarfs (Kirkpatrick et al., 1999) characterized by effective temperatures, , as low as 600 K. Studies of these objects suggested the potential for yet a third class of even colder objects, the Y dwarfs, with temperatures between 300-600 K. Many examples of L and T dwarfs have now been discovered and their spectral classification is now a fine art (Kirkpatrick, 2005). But members of the Y spectral class were elusive until the launch of the Wide-field Infrared Survey Explorer (WISE; Wright et al 2010) which identified over 100 brown dwarfs with low effective temperature, including the first Y dwarfs. (Kirkpatrick et al., 2011; Cushing et al., 2011).
In parallel with the WISE survey, targeted imaging of stars has led to the discoveries of planetary mass objects orbiting nearby stars, yielding both young planets, e.g. HR8799 bcde (Marois et al., 2008), Pic b (Lagrange et al., 2009) and 2M1207-3932b (Chauvin et al., 2005), as well as a companion to a nearby white dwarf, WD 0806-661 b (Luhman et al., 2011, 2012). Thermal emission has also been detected from Jovian mass planets transiting their parent stars (Deming et al., 2006; Charbonneau et al., 2005). Finally, microlensing studies may have identified a population of Jovian-mass objects with no obvious association to any star and which thus must either be located tens of AU from their hosts or be free floating planets (Sumi et al., 2011).
Essential to understanding the nature, physical properties and evolutionary status of these objects is the determination of such properties such as mass, age, composition, and bolometric luminosity. This article describes the first results of a program to use direct imaging to determine distances to these ultra-cool brown dwarfs using parallax measurements. With secure distance measurements it will be possible to estimate the local space density of Y dwarfs and to understand better their physical properties.
We have taken a sample of twenty objects from the entire all-sky WISE survey that are confirmed to have spectral types (or types estimated from WISE photometry) of T8 and later and have initiated a program of follow-up photometry from ground- and space-based telescopes. From a comparison of apparent and inferred absolute magnitudes for objects of low Teff, e.g. Baraffe et al. (2003); Burrows et al. (2003), we estimate that these objects are within 20 pc of the Sun and so shoud have large astrometric signatures. We are using the Hubble Space Telescope (HST), the Spitzer Space Telescope, and the Keck-II telescope to obtain images with the goal of determining parallactic distances. This paper focuses on the first result of this program, the determination of the distance to WISEPA J182831.08+265037.8, hereafter, WISE 1828+2650 which was identified as a potential late-type brown dwarf on the basis of its extreme color, W1-W2 ([3.5µm]-[4.6µm]) 4 mag (Kirkpatrick et al., 2011). Subsequent near-infrared observations from HST led to its classification as the prototype Y dwarf (Cushing et al., 2011), and finally, on the basis of a broader sample of Y dwarf discoveries have revised the classification to Y2 (Kirkpatrick et al., 2012).
2 Observations
The determination of high accuracy positions for cool, low luminosity brown dwarfs is extremely challenging since they are faint for 8-10 m ground-based telescopes and HST in the near-infrared and bright in the mid-IR where they can only be observed with space telescopes of small aperture (0.4-0.85 m). As a result we have had to piece together positional information with a variety of telescopes over a range of wavelengths using individual measurements (Table 1) with uncertainties in the range of 10-50 mas due to either low signal to noise ratio or large beam sizes. A parallax determination will be possible only if these objects prove to quite close-by. Fortunately, this appears to be the case for at least WISE 1828+2650 where we are able to determine a parallax of 100 mas. With such a large astrometric signature, relatively coarse positions suffice and many of the instrumental effects that must be taken into account for more distant objects can be ignored. Table 1 lists the observations from WISE and other observatories. Photometric data are presented in Table 3. For WISE we report an average of the 4.6 µm magnitudes from the two epochs and upper limits in the other bands. For comparison with models we have converted the magnitudes to flux densities using the zero points from Wright et al. (2010), but because of the unknown and extremely non-blackbody-like nature of brown dwarf spectral energy distributions (SED), we have not color-corrected these flux densities.
2.1 HST Observations
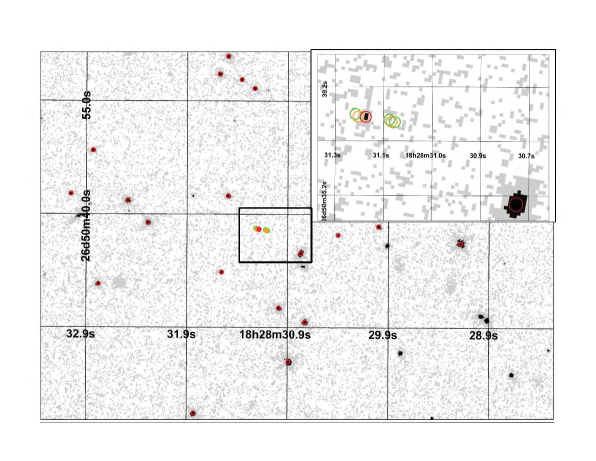
WISE 1828+2650 was observed with HST in the WFC3-IR F140W filter in conjunction with a grism spectrum which was the basis of this object’s identification as a Y1 dwarf by Cushing et al. (2011) (Figure 1). The data consist of two pairs of individual 78 sec exposures taken at positions offset by (0.82″ and 5.67″ to reduce the effects of cosmic rays and the undersampling of the individual frames. The pipeline corrects for the geometric distortion of the WFC3-IR camera to a level estimated to be 5 mas (Kozhurina-Platais et al., 2009) which is of the same order or less than the extraction uncertainties of the faint target. Over 200 sources were extracted from the Space Telescope Science Institute’s (STScI) “MultiDrizzle” mosaic using the Gaussian-fitting IDL FIND routine to determine centroid positions and the APER routine111All the photometric measurements reported herein were made using this routine from the IDL ASTRO library, http://idlastro.gsfc.nasa.gov/contents.html. A number of other IDL routines are taken from this library as well. with a 3 pixel radius for photometric measurements. The Full Width at Half Maximum (FWHM) for these undersampled data is 0.26″ consistent with STScI analyses (Kozhurina-Platais et al., 2009). The data were calibrated using the zero-point for Vega magnitudes, ZP(Vega)=25.1845 mag222http://www.stsci.edu/hst/wfc3/phot_zp_lbn, from the WFC3 Handbook (Rajan, 2010). A strong source denoted Source A appears to be slightly extended and is located roughly 5″ W and 3″ S of WISE 1828+2650. This object is seen in the Keck, HST, and Spitzer images and will be used as a local astrometric reference in subsequent analysis. As discussed below, the extracted position of Source A is consistent between the Keck and HST measurements to within 10 mas which is small compared to the other uncertainties.
2.2 Keck NIRC2 Observations
WISE 1828+2650 was observed in the H-band using the Keck-2 telescope (July 2010) using NIRC2 with the laser guide star Adaptive Optics (AO) system (Wizinowich et al., 2006; van Dam et al., 2006) and a tip-tilt star located 50″ away. The wide-field camera (40 mas/pixel scale; 40″ field of view) was used to ensure an adequate number of reference stars for astrometry. A sequence of images with a total integration time of 1080 sec was obtained at airmass of 1.0-1.1 with 2″–10″ offsets in right ascension and declination (Kirkpatrick et al., 2011). The individual images were sky-subtracted with a sky frame created by the median of the science frames and flat-fielded with a dome flat using standard and custom IDL routines. Individual images were “de-warped” to account for optical distortion in the NIRC2 camera as described below. The reduced images were shifted to align stars on a common, larger grid and the median average of overlapping pixels was computed to make the final mosaic. The target was detected at a relatively low SNR of 5. As reported in Kirkpatrick et al. (2012), the source was also weakly detected in the J band with NIRC2 at this epoch (Table 3).
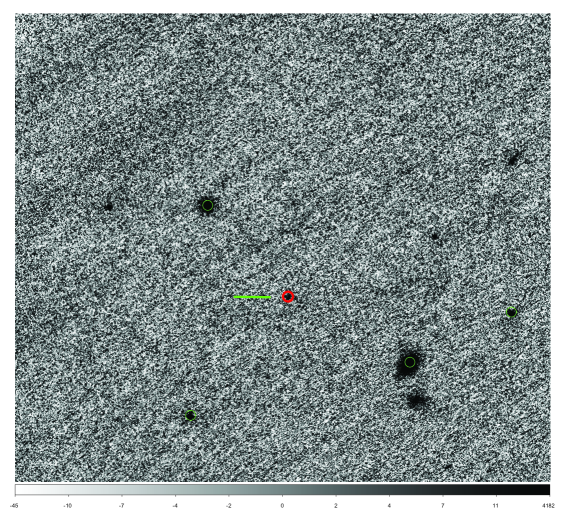
The source was re-observed in 2011 (Figure 2) and twice in 2012 following the same procedure but for a longer total integration times (3960, 2880 and 2880 sec, respectively), yielding SNR and with smaller offsets (2-4″) to reduce the effects of optical distortion on the final image. The airmass for the Oct 2011 observations ranged from 1.1 to 1.4 with a mean value of 1.25. In 2012 July the airmass values ranged between 1.04 to 1.15 with a mean value of 1.09. In 2012 October, the seeing and photometric conditions were relatively poor with an average airmass of 1.2. The typical Point Spread Function (PSF) in the final mosaicked images from the first three epochs varies slightly across the field, but at the center of the field close to WISE 1828+2650, the Full Width Half Maximum (FWHM) of the AO-corrected core is 3-4 pixels, or 120-160 mas. In October 2012, the image quality was about a factor of two worse as is reflected in the poorer astrometric solution described below. Sources were extracted using the IDL APER routine with an aperture radius of 5 pixels. To calibrate these data photometrically we used observations of the WISE 1828+2650 field obtained with the Wide Field Infrared Camera (WIRC) (Wilson et al., 2003) at the Palomar 5-m telescope with a MKO-NIR H filter (Tokunaga et al., 2002). The 8.7′ field of this camera was sufficient to detect 350 2MASS stars surrounding WISE 1828+2650 as well as 6 stars seen in the Keck field. While the Palomar image was not deep enough to detect WISE1828+2650 itself, we were able to calibrate the Keck field using the calibrated WIRC magnitudes of the 6 stars in common. Combined with the 2MASS calibration uncertainties (Carpenter, 2001), the overall calibration uncertainty is 5% which is small compared to the uncertainty in the average magnitude for the WISE target itself (%). There is no evidence for variability between the different epochs. No photometry was attempted for 2012 October.
The source positions obtained from the Keck images were corrected for the effects of differential refraction relative to the center of the field using meteorological conditions available at the CFHT telescope weather archive333http://mkwc.ifa.hawaii.edu/archive/wx/cfht/ to determine the index of refraction corrected for wavelength, local temperature, atmospheric pressure and relative humidity (Lang, 1983) and standard formulae (Stone, 1996). As discussed in Appendix I, for the small field of view of the NIRC2 images and the relatively low airmasses under consideration here (1.5), the first order differential corrections we do apply to the source positions are small, 10 mas across the 20″ field and proportionately less at smaller separations.
The effects of optical distortion in the wide-field NIRC2 camera were corrected using a distortion map derived by comparing Keck data of the globular cluster M15 taken immediately after the WISE 1828+2650 observations in 2011 and July 2012 to HST/WFC3 observations of M15 (Anderson et al., 2008; Yelda et al., 2010). Details of this distortion mapping are described in Appendix I but the correction amounts to pixel (40 mas) across most of the array and up to 2 pixels at the edges of the array. At the array center where the WISE 1828+2650 observations were made, the maximum uncorrected distortion for separations up to 5″ is 20 mas. After our correction procedure the residual distortion errors are less than 10 mas over the entire field. As a test of our ability to co-register data from individual Keck images, we examined the positional dispersions of 15 sources in each apparition with respect to their average positions. For the first three Keck epochs the average dispersion in right ascension and declination is 6 mas. The last epoch was not considered in this analysis due to poor observing conditions. The ability to register these images to an external reference, i.e. the sources in the HST image, is discussed below (3).
2.3 Spitzer Observations
The Spitzer Space Telescope observed WISE 1828+2650 using Director’s Discretionary Time and at three subsequent General Observer epochs. The IRAC camera (Fazio et al., 2004) was used in its full array mode to make observations at 3.5 (Channel-1) and 4.5 m (Channel-2) in the first epoch and only at 4.5 m in the subsequent epochs. We analyzed post-BCD mosaics from the Spitzer Science Center (SSC) to make photometric and astrometric measurements, extracting sources using a 3 pixel radius aperture and normalized using SSC-recommended aperture corrections444http://irsa.ipac.caltech.edu/data/SPITZER/docs/irac. WISE 1828+2650 was detected at both 3.5 µm (SNR) and at 4.5 µm (SNR40; Table 3). Source A is seen as a weak but definite detection with about one-sixth the brightness of WISE 1828+2650 (SNR=9). We fitted the pixel data for these two objects simultaneously using Gaussian profiles to determine accurately the source centroids. The fitting uncertainties for the two objects in the 4 Spitzer observations are 10-20 mas for WISE 1828+2650 and 120-130 mas for Source A (Table 6). There was no evidence for variability in the brightness of WISE 1820+2650 between the four epochs at the 6% level. Since Source A appears extended at shorter wavelengths, there is a concern that position of Source A might shift with wavelength. There is no evidence for this effect in our data. The Spitzer position for Source A is self-consistent within 15 mas over 4 epochs and consistent with the Keck and HST positions to within (, )=(60,10) mas which is small relative to the fitting uncertainties for Source A of 120 mas.
The IRAC camera has significant optical distortions over its entire field that are corrected in the SSC pipeline to an average residual value of 100 mas over the whole field555http://irsa.ipac.caltech.edu/data/SPITZER/docs/irac/iracinstrumenthandbook/26/. We have used 20 HST stars observed within 90″ of WISE 1828+2650 as probes of the residual distortion as described above for the Keck observations. As a test of our ability to co-register data from individual Spitzer images, we examined the positional dispersions of 22 sources in each apparition with respect to their average positions. The average dispersion in the four Spitzer epochs is 60 mas in right ascension and declination. The ability to register these images to an external reference, i.e. the sources in the HST image, is discussed below (3). These values are less than the quoted 100 mas uncertainty from the SSC, in part because we are confining our observations to the central part of the IRAC array. The total uncertainties in Table 5 reflect the systematic uncertainties combined with a brightness-dependent term for WISE1828. In the case where we consider only offsets from WISE 1828+2650 to Source A, the distortion effects will be considerably smaller given the 10 pixel distance between the two objects. From examination of the polynomial expression to the distortion correction given by the SSC, we estimate the distortion component of the uncertainty in the separation between the two sources to be 10 mas, negligible compared to the uncertainties due to the source fitting (Table 6).
3 Astrometric Data Reduction
Following source extraction, we put observations from all telescopes onto a common astrometric frame. This was accomplished in a two-step process. First, to ensure consistency with the WISE positions which are based on the 2MASS astrometric frame (Wright et al., 2010), the HST positions were refined using 11 2MASS sources to solve for the RA and DEC zero points and image rotation. We adopted the nominal STScI pipeline plate scale of 0.12826 arcsec/pixel which is known to an accuracy % (Kozhurina-Platais et al., 2009). This value agrees with the plate scale derived from the 2MASS sources to within 0.02%, but we adopted the better established pipeline value. Saturation effects on the astrometric centroid for the faint 2MASS sources (H15 mag) are small ( the 0.128″ HST pixel) compared to the overall 80 mas uncertainty in the absolute 2MASS reference frame (Skrutskie et al., 2006). Additional evidence that the saturation effects are relatively small comes from the fact that our HST F140W photometry recovers the 2MASS brightness of these 11 objects to within an average 0.2 mag where we compared the HST data with the simple average of the 2MASS J and H magnitudes. The fit to the HST/2MASS sources yielded a ()(initial HST-2MASS)=(-0.50,0.15)″ shift relative to the initial pipeline solution where we adopted the positional uncertainties from the 2MASS catalog to weight the individual sources (70-350 mas with an average value of 180 mas) in the fitting procedure. We believe the 2MASS positional zero points to be correct given the agreement between 9 sources within 2′ of WISE1828+2650 appearing in both the 2MASS and the UCAC3 catalogs (Zacharias et al., 2010). The average positional differences between these two catalogs is (UCAC3-2MASS)=(0.12,0.03)″.
Sources seen in the HST image and seen in either the Keck, Spitzer, or 2MASS data are presented in Table 2. The positional errors associated with the HST data come from a combination of a brightness-dependent term, (Monet et al., 2010) where SNR is the signal-to-noise ratio of a particular measurement, and two terms term depending on distance of the source, , from the center of the HST field, and . The latter two terms account for uncertainty in the rotation angle and plate scale. The rotational uncertainty is rad (Table 4). For sources at the edge of the field the positional uncertainty can be as large as 90 mas, but within 20″ of the center of the Keck field, for example, the typical uncertainty of an HST source is 5 mas.
Parameters of the 2MASS/HST fit are given in Table 4. As shown in the first entry in Table 4, the standard error () in this local frame is approximately 4 mas in each axis. To this local registration uncertainty must be added the overall astrometric accuracy of the 2MASS survey of 80 mas (Skrutskie et al., 2006). However for the differential measurements of interest for the parallax determination, this uncertainty is not important. The new solution was applied to all the HST sources, of which 13-22 appear in various of the Keck and Spitzer images (Table 2). These refined HST positions were subsequently used to set the astrometric reference frame for all other images.
We registered the four epochs of Keck imaging to the 2MASS/HST astrometric grid using between 13-21 stars, solving simultaneously for field center coordinates, rotation, and pixel scale. The solutions yielded offsets relative to the HST frame of 2.5 mas, with a single-axis standard error 3 mas, and fitting errors of and 0.02% in field rotation and plate scale, respectively. These results are summarized in Table 4. We averaged the Keck positions of the HST sources for the first three epochs and compared these to the input HST positions, giving (Keck-HST)=(-9, 5 mas) with a dispersion of 24 mas predominantly independent of source brightness. We take this dispersion to be representative of the residual uncertainties in the Adaptive Optics PSF across the field, uncertainties in the rotation and plate csale of the HST data (Table 2), residual optical distortion in both the Keck and HST data, and residual refraction in the Keck data. To establish the uncertainty for a particular object we combine this observed dispersion in a root-mean-square sense with the brightness-dependent term, . This latter term is typically small, 10 mas. As noted above, the 2012 October Keck data were obtained under poor conditions resulting in a dispersion of 50 mas with respect to the HST sources.
For Spitzer astrometry we used the 4.6 µm (Band 2) Post-BCD mosaics because the source is brighter at this wavelength compared to 3.5 µm and also because of the more symmetric and better sampled PSF at the longer wavelength. We matched HST positions of 20 stars (depending on the intersection of the two fields of view), solving for RA and DEC zero points, rotation angle, and pixel scale. As expected, the Spitzer scale proved to be highly stable over the four epochs of observation and to differ from the SSC value by 0.05%. We adopted the nominal plate scale for our analysis. We determined the rotation angle to and the positional zero point to 20 mas relative to the HST frame. We averaged the Spitzer positions of the HST sources for the 4 epochs and compared these to the input HST positions, giving (Spitzer-HST)=(7,-5) mas with a dispersion of 50 mas predominantly independent of source brightness. We take this value to be representative of the residual uncertainties in PSF and distortion in both the Spitzer and HST data that must be applied to all sources. We adopt the slightly larger repeatability measure of 60 mas obtained in the previous section as the astrometric uncertainty in the Spitzer data; the SNR-related term is negligible by comparison.
4 Results
4.1 Determination of Parallax and Proper Motion
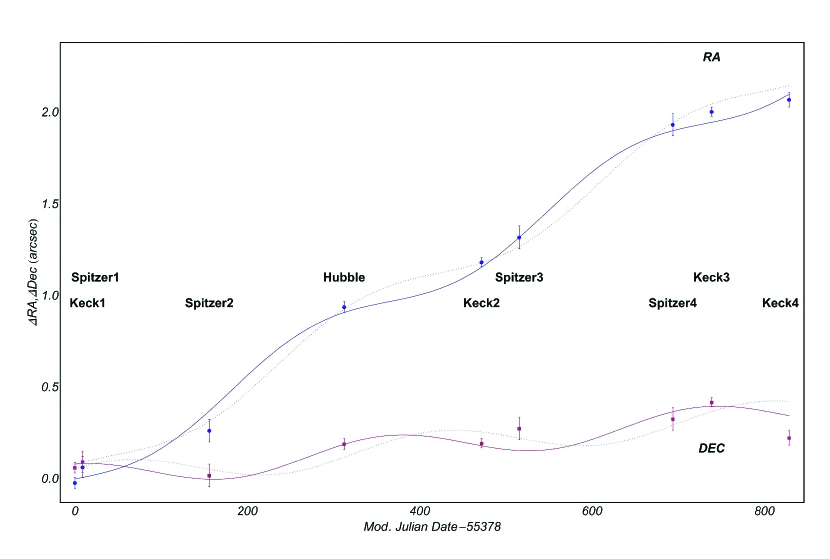
Table 5 lists the positions of WISE 1828+2650 on the HST/2MASS astrometric grid while Table 6 lists the offsets of WISE 1828+2650 relative to source A. Both sets of right ascension and declination data were fitted to a model incorporating proper motion and parallax (Smart, 1977; Green, 1985):
| (1) | ||||
| (2) |
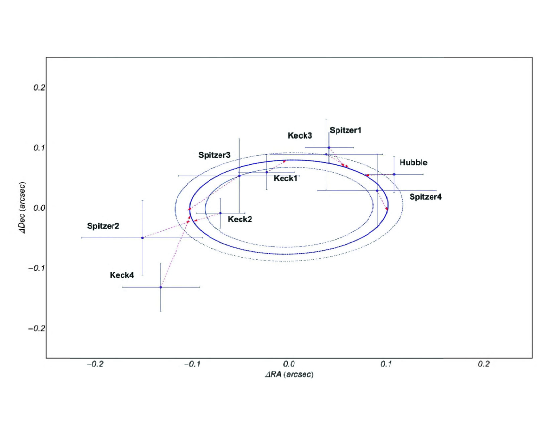
where are the source position for equinox and epoch J2000.0, are proper motion in the two coordinates in ″/yr, and is the annual parallax. The coefficients , and are the rectangular coordinates of a terrestrial or earth orbiting telescope (WISE, Keck, HST) or Spitzer in its Earth-trailing orbit as seen from the Sun. Values of for the terrestrial or Earth-orbiting observatories are taken from the IDL ASTRO routine XYZ. Spitzer values of are obtained from the image headers provided by the SSC. Equations (1) and (2) are solved simultaneously using the Mathematica routine NonLinearModelFit incorporating appropriate uncertainties for each datapoint. Figure 3 shows the fit of the data to this model. Figure 4 shows the fit to parallactic ellipse with the effects of proper motion removed.
We developed two solutions, one using best estimates of the time-varying positions of WISE 1828+2650 in the HST/2MASS astrometric frame (Method-1; Table 5) and the other using offsets between the source and the nearby object denoted Source A (Method-2; Table 6). The Method-2 position offsets use only the rotation angle and plate scale derived from the full astrometric solution, and should thus be relatively immune to residual distortion and refraction effects that apply across the larger field. On the other hand, the only Method-2 observable is the offset which is compromised by Source-A being both slightly extended in all the images and blended with WISE 1828+2650 in the Spitzer images.
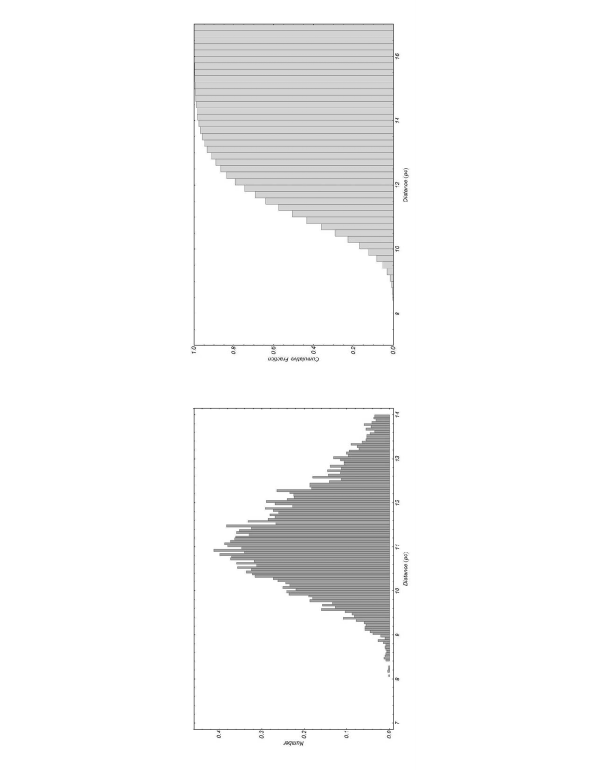
The two solutions give consistent results (Table 7), yielding parallaxes of 10316 mas and 7912 mas and corresponding to distances of 9.7 pc (Method-1) and 12.6 pc (Method-2). To generate our final kinematic estimates we combined and fitted simultaneously the Method-1 and Method-2 datasets, Method-(1+2). While the input imaging data are the same in both cases, the sources of uncertainty are different and furthermore, the blending in the Method-2 offsets lowers the significance of the Spitzer results and thereby halves the number of epochs with precise measurements. Figure 5 shows histograms for the parallax and distance solutions from Method-(1+2) resulting from a 10,000-iteration Monte Carlo calculation wherein the source positions were varied according to their Gaussian uncertainties and solutions recorded at each step. While the parallax distribution is consistent with the nominal average value and its associated uncertainties, the distance distribution shows a tail to greater distances expected due to its inverse relationship to the parallax. We derived the asymmetric distance uncertainties from the Cumulative Distribution Function of the errors (Figure 5b). Our best estimate of the distance to WISE1828+2650 is 11.2 pc with a =36.3 with 31 degrees of freedom. A model of proper motion plus a non-zero parallax provides a much better fit to the data than a proper motion-only model which yields 135 with 32 degrees of freedom for the Method-(1+2) dataset. On the other hand, there is no evidence that a more complex model, e.g. one including the presence of a perturbing second body in the system, is required.
Finally, we note that the parallax determination here is a relative one with respect to nearby references stars (not galaxies, except for Source A). Thus the motions of the reference frame can introduce a bias into the parallax determination. Since this bias is at the level of 0.5-2 mas (Dupuy & Liu, 2012), we can neglect this correction relative to the 100 mas signal of WISE 1828+2650.
4.2 Spectral Energy Distribution
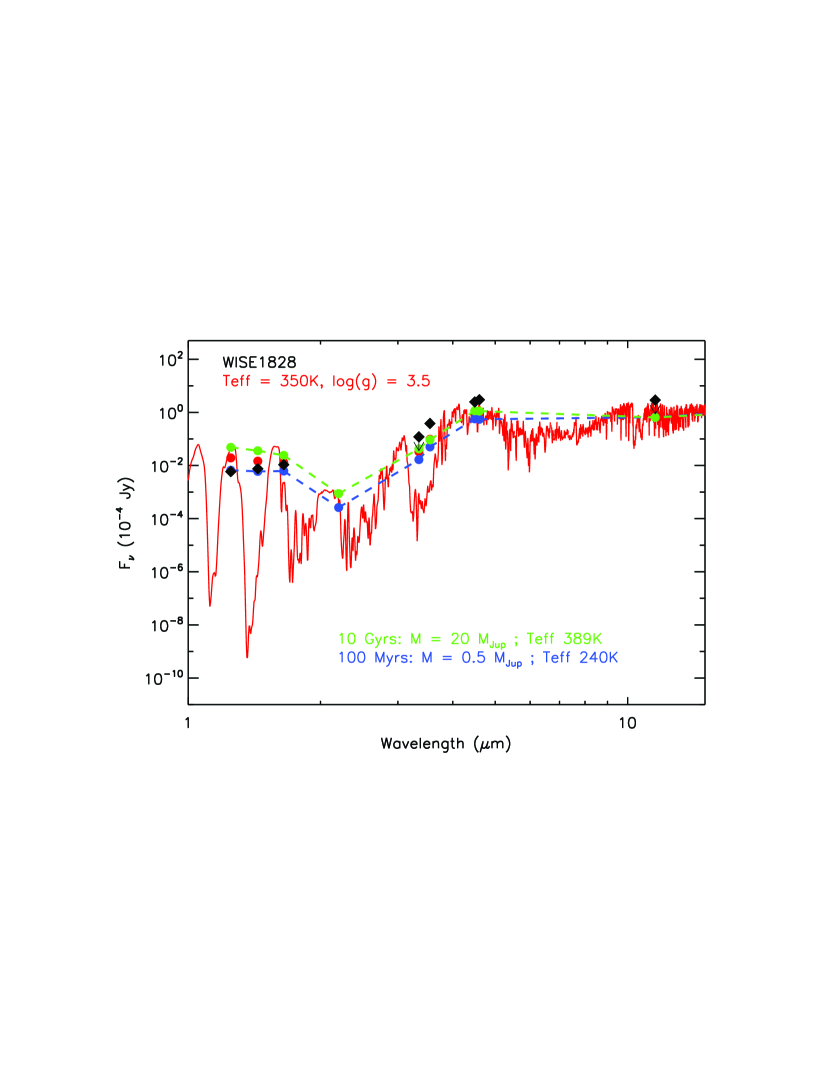
WISE 1828+2650 is one of the coolest (latest) Y dwarfs yet identified. Available photometry of WISE 1828+2650 covers the 1-5 m range and can compared against the predictions of brown dwarf atmospheric and evolutionary models (Baraffe et al., 2003). Figure 6 shows a number of models fitted to the observations as described below. Unfortunately, none of these models provide a good fit to the full range of the data. The COND models pass through either the two short wavelength points or the 3-5 µm points, but not both. The over- or under-estimates are significant, up to factors of 5, which suggests that the models have omitted one or more important physical processes in the atmosphere, e.g. non-equilibrium chemistry or new absorbers, that dramatically affect the SED. Marley et al. (2010) highlight the importance of clouds in the L/T dwarf transition which greatly change the near-IR (J, H and K band) appearance of these warmer objects. The onset of still lower temperature condensates, e.g. Na2S producing sulfide clouds (Morley et al., 2012), may play a role in the appearance of the Y dwarfs (see however Burrows et al. (2003)).
While acknowledging the failings of the models in this uncharted range of effective temperature, we will use them to make preliminary estimates of the properties of WISE 1828+2650. We take advantage of our knowledge of the distance to the source and use absolute magnitudes rather than relative fluxes to constrain further the evolutionary status of the object.
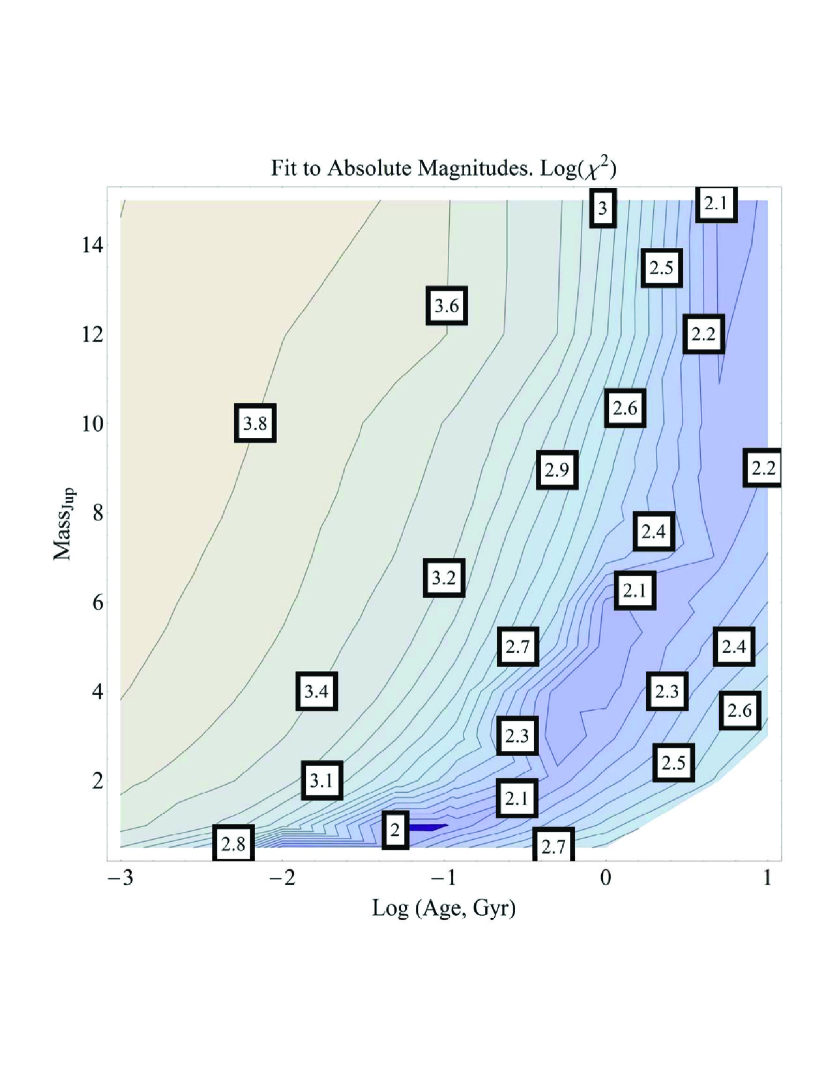
Magnitudes corresponding to the dust-free COND models (Baraffe et al., 2003) were calculated using bandpasses matched to HST, WISE, Spitzer, and ground-based filters. Models were first selected to match either the absolute H magnitude M mag or M[4.5]=14.42 mag where the uncertainty in the absolute magnitude is dominated by the distance uncertainty. Selecting models matching either absolute magnitude led to two classes of object. Matching the H band absolute magnitude leads to atmospheres with a narrow range of effective temperatures (TK) but with a broad variation of ages and masses from (0.5 MJup, 0.05 Gyr) to (8 MJup, 10 Gyr). Matching the [4.5m] absolute magnitude leads to hotter, more massive objects (TK) with a range of ages and masses from (2 MJup, 0.1 Gyr) to (30 MJup, 10 Gyr). Matching the absolute magnitudes in F140W, H, and the two Spitzer bands simultaneously, each with an uncertainty of 0.25 mag, yields a best fitting model with (0.1 MJup, 0.1 Gyr), TK, and a =95 for 2 degrees of freedom (4 data points and two parameters). The variation of the quality of fit as a function of mass and age (Figure 7) shows a minimum for a young, low mass object, but a broad valley tending to older, more massive objects. We emphasize the poor quality of the model fits by pointing out that the contour values in Figure 7 show the logarithm of the value.
Finally, we examined the possibility that the SED could be the result of a combination of two coeval bodies in a binary system (Leggett et al., 2012). Fitting the 4 absolute magnitudes yields a pair of equal mass objects with (0.5 MJup, 0.05 Gyr), TK, and = 55. However, since none of these models provides a particularly good fit to the data across the entire 1-5 µm range, the estimated physical parameters should be taken with a grain of salt. What all the solutions have in common is a low TK and a mass range of a 0.5-20 MJup depending on the unknown age of the system (5.2).
Other models lead to a similar range of predicted properties for WISE 1828+2650 depending on the wavelength used for the comparison and the assumed mass and/or age. The Marley et al. (2010) and Burrows et al. (2004) models also suggest an effective temperature 300-400 K which can be associated with a broad range of masses and ages with no single model providing a good simultaneous fit to all of the 1-5 m observations. Spiegel & Burrows (2012) calculate models for both “hot start” and “cold start” formation scenarios (Marley et al., 2007) for ages less than 0.1 Gyr. Matching our data to the predicted absolute band models for either the “cold start” or “hot start” cases yields 1 MJup objects with ages of 0.02-0.03 Gyr. Matching the predicted band models (only an approximation to our Spitzer filter) yields objects in the range (1-5 MJup, 0.007-0.1 Gyr). Differences between the COND models and the Spiegel & Burrows models are relatively minor in the area of age overlap.
5 Discussion
5.1 Physical Properties of WISE 1828+2650
The nature of WISE 1828+2650 is ambiguous for two reasons. First, the failure of the models to reproduce successfully the SED and absolute magnitudes makes it hard to draw any quantitative conclusions. Second, even with improved models, e.g. ones including clouds or new low-temperature absorbers, there would remain a family of models with roughly similar Teff that are degenerate in mass and age.
WISE 1828+2650 is similar in appearance to the brown dwarf companion to the Gyr old white dwarf WD 0806-661 (Luhman et al., 2012) located 19.2 pc away. The twofold greater distance to this system has so far prevented a detection of WD 0806-661 B in the 1-2 m region. As a result, we do not yet have a comparable SED, but the near- to mid-IR colors are comparably red with J-[4.5]=9.250.35 (Kirkpatrick et al., 2012) for the WISE object and J-[4.5]7 for WD 0806-661 B. The 3-5 m colors are also similar, [3.6]-[4.5]= 2.77 mag for WD 0806-661 B and [3.6]-[4.5]= 2.81 mag for WISE 1828+2650, although neither of these objects are as red as other Y dwarfs. With an age estimate for the white dwarf it is possible to narrow the mass range for its companion based on its colors. Luhman et al. (2012) suggest a mass of 6-9 MJup which is consistent with our estimates for WISE 1828+2650 in that age range.
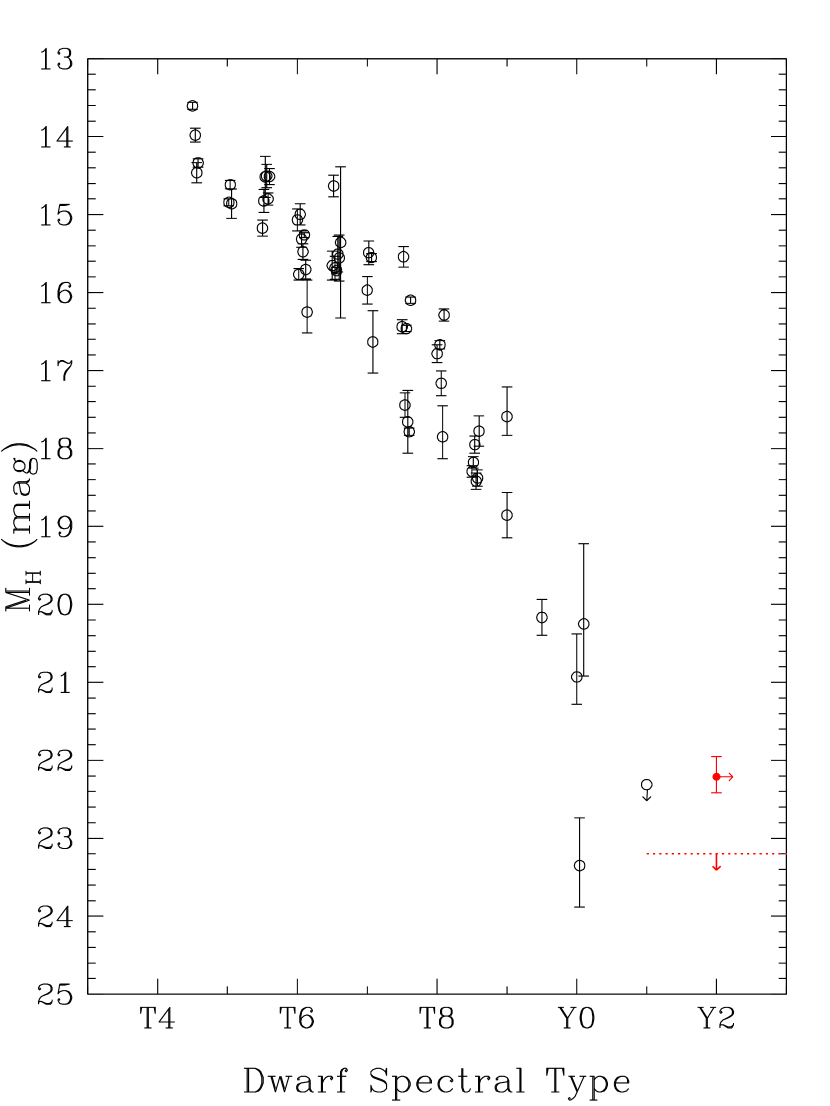
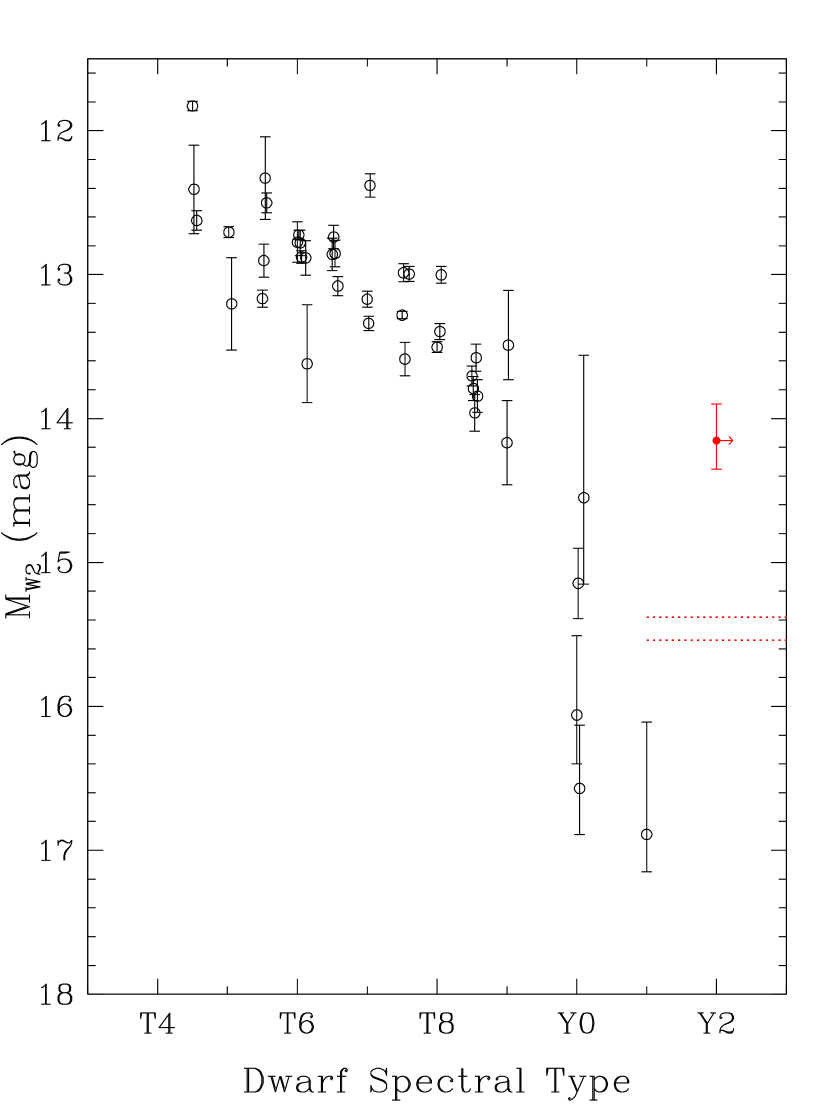
An important peculiarity of WISE 1828+2650 is its bright absolute magnitude, MW2 = 14.15 mag for its presumed Y2 spectral type. Compared with WD 0806-661 B with an absolute magnitude of M[4.5]=15.5 mag, WISE 1828+2650 is 1 mag more luminous. More troubling, however, is the fact that compared with other Y dwarfs with reasonably secure parallaxes, WISE 1828+2650 is 2 mag brighter than other Y dwarfs in MW2 and, to a lesser extent, brighter than some of the earlier Y dwarfs in MH. Figure 8, which illustrates this problem, is an updated version of the absolute magnitude vs. spectral type figures appearing in Kirkpatrick et al. (2012). This new figure uses recently published Y dwarf parallaxes by Marsh et al. (2012) and Tinney et al. (2012). The locations of WISE 1828+2650 and WD 0806-661 B are also shown. The spectral type of WD 0806-661 B has been estimated from its effective temperature since no spectrum is available and only an upper limit is available for the H-band magnitude. However, in both cases it is apparent that the two objects are similarly deviant from the trend set by earlier Y objects.
A simple explanation of at least part of the 1.5 mag difference in absolute M[4.5] between WISE 1828+2650 and WD 0806-661 B is that WISE 1828+2650 is an unresolved, equal mass binary which would increase the total system brightness by 0.7 mag, close to the difference with WD 0806-661B. Any such companion to WISE 1828+2650 would have to have an orbit 0.5 AU (0.05″) to be consistent with the HST and Keck data and if present would eventually manifest itself in either the astrometric data or future spectroscopic data. No such evidence for binarity yet exists. In any event, such an explanation does not account for the significant deviation from the trends established for earlier spectral types. Some other explanation must be sought for the differences in absolute magnitude at 3-4 µm.
5.2 Age of WISE 1828+2650
We cannot eliminate solutions corresponding to young, low mass objects for WISE 1828+2650. Of the approximately 250 low mass objects (M, L and T spectral types) within 10 of the Sun there are at least three M stars younger than 100 Myr: AU Mic (9.9 pc; Kalas et al. (2004)), GJ 896 B (6.3 pc; Riedel et al. (2011)), and most recently AP Col (4.6 pc) (Henry et al., 2006; Riedel et al., 2011). A number of brown dwarfs have been claimed to be young based on near-IR spectra which indicate low surface gravity. Examples include the L dwarf 2MASS J01415823-4633574 (Kirkpatrick et al. 2010; Patience et al. 2012) and the nearby, 7.5 pc, L5 brown dwarf 2MASS J035523+113337 (Faherty et al., 2012). If these 2MASS objects are indeed that young, then their masses might be as low as 10 MJup. As noted above, if WISE 1828+2650 were as young as 0.1 Gyr, its mass would be only 1-2 MJup. A young, brown dwarf of this age is certainly a possibility, albeit one with a low probability (1%) based on the statistics of nearby low mass objects, i.e. 3 young M stars plus 1 young L dwarf out of 250 low mass objects.
The simplest metric for assessing the age of WISE 1829+2650 is the directly measured tangential velocity which comes from the proper motion and distance: km s-1 where is the total proper motion and the parallax (Smart, 1977). This value falls in the middle of the distribution of tangential velocities measured for nearby ( 20 pc) L and T brown dwarfs (see Figure 7, Faherty et al. (2009)). These velocities are consistent with models of disk population with ages of 3-8 Gyr. This range narrows to 2-4 Gyr if the highest velocity objects ( km s-1 are excluded. Within the age range and using fits to the COND models described above, we estimate that the mass of WISE 1828+2650 is 3-6 MJup.
A number of authors have used kinematic properties to associate brown dwarfs with nearby young clusters, but the results to date are only suggestive (Faherty et al., 2012). For example, might WISE 1828+2650 be a young object could be associated with one of the nearby young moving groups, e.g. AB Dor, Pic or Tucana/Horlorgium (Zuckerman & Song, 2004; Torres et al, 2008) or the Argus/IC 2391 group as in the case of AP Col? These groups are located at distances of 20-100 pc with ages ranging from 8 to 50 MYr. We evaluated possible galactic velocity vectors for WISE 1828+2650, , and their associated uncertainties , from its position, parallax, and proper motion vector determined here for a range of the unknown from -100 to 100 km s-1. We calculated the difference between cluster values and possible values for WISE 1828 as a function of :
| (3) |
For Vrad between -100 to 100 km s-1 there is no good match in space for any of the six moving groups with ages from 8 to 50 Myr (Table 8; Zuckerman et al. (2004); Riedel et al. (2011)). The smallest separation is km s-1. While it is impossible to rule out the possibility that WISE 1828+2650 is a young straggler ejected from one of these groups, it is more likely that WISE 1828+2650 is an older, higher mass object.
5.3 Brown Dwarf or Free Floating Planet?
The suggestion that a population of free floating planets may be responsible for short duration microlensing events, day day for M=0.1-10 MJup (Sumi et al., 2011) immediately leads to the conjecture that objects like WISE 1828+2650 might be members of such a population. Sumi et al. (2011) calculate that fitting the distribution of short duration microlensing events requires a population of 1-2 MJup objects roughly 1.3-1.9 as numerous as all main sequence stars (0.08-1 M⊙). Quanz et al. (2012) argue that imaging surveys may be starting to reveal a significant number of bound planets located at 10s of AU from low mass stars which would decrease the need for a large population of free-floating, planetary mass objects.
The RECONS database (Henry et al., 2006) lists 300 main sequence stars (M-G) within 10 pc, or 0.072 object pc-3. Estimates of the entire population of Y dwarfs down to the coolest objects are premature but we note that WISE 1828+2650’s distance implies a minimum local density of pc-3. For WISE 1828+2650 to represent the tip of the microlensing iceberg, the population of similar objects would have to rise very sharply below the few mass of this object. Between 0.1 and 10 MJup where the Sumi et al. (2011) data are sensitive (Figure 9 of Sumi et al. (2011)), the mass distribution function, , would have to have to be quite steep. Estimating the mass of WISE1828+2650 using a uniform distribution between 3-6 yields to produce enough extremely low mass dwarfs (0.1-10 MJup) equal in number to the main sequence stars within 10 pc. This is dramatically steeper than the flat Brown Dwarf index, (Figure 14 in Kirkpatrick et al. (2012)), and steeper than the mass distribution of planets determined by radial velocity studies, (Cumming et al., 2008; Howard et al., 2010).
To date, fourteen “free-floating” Y dwarfs have been identified (Cushing et al., 2011; Kirkpatrick et al., 2012; Tinney et al., 2012). Several other WISE-selected Y dwarf candidates, such as those presented in Griffith et al. (2012), remain but lack spectroscopic confirmation. All are on active parallax and spectroscopic classification campaigns, so it will soon be known if other WISE 1828+2650 and WD 806-661 B analogs exist. Even if, for example, the local density of objects as cool as WISE 1828+2650 eventually proves to be 5 times higher than estimated solely on the basis of this one object, then the power law index required to account for the microlensing results would still be 1.5. In the absence of convincing evidence for an upturn in the mass distribution, the most conservative interpretation is that WISE 1828+2650 sits at the low mass end of the brown dwarf distribution rather than at the start of a much larger population of free floating “planets”.
A less conservative interpretation of these results is also possible. As Luhman et al. (2011) themselves suggest WD 0806-661 B could have formed as a 6-9 MJup object in a protoplanetary disk around its 2 M⊙ primary, WD 0806-661 A. Only later, after the primary shed mass during its evolution off the main sequence, would WD 0806-661 B have migrated into a larger orbit, currently of radius 2500 AU. The formation mechanism between the WISE Y0 and Y1 discoveries, which presumably formed via cloud fragmentation as do normal stars, and WB 0806-661 B would thus be different. Compositional differences should be seen between the two types of objects, given that chemical differentiation is expected in a proto-planetary disk and not in a star formation cloud. Jupiter’s enhanced metallicity is an obvious example of this difference (Wong et al., 2004). Objects formed via core accretion may also have a pronounced core of heavy elements as inferred for transiting planets (Rogers & Seager, 2010) which might manifest itself in significant ways. Such differences between these two classes could possibly account for the discrepancies noted in the absolute magnitude versus spectral type diagrams of Figure 8.
Taking this one step further, the similarity between WD 0806-661 B and WISE 1828+2650 may be a direct reflection of the fact that both objects were birthed via the same process. In this case, WISE 1828+2650 would be a “free-floating” planet that, given our mass estimate of 3-6 MJup, would fall at the high-mass end of the rogue planet population proposed by Sumi et al. (2011). In this case, the poor agreement with theoretical spectra may be a consequence of a poor match between the true elemental abundances or interior structure of WISE 1828+2650 and those in the model assumptions. If the space density of truly “free-floating” planets measured by Sumi et al. (2011) is correct, then there should be colder examples (300K) at much smaller distances (10 pc) than WISE 1828+2650 itself. Some of these may yet be discoverable at lower signal-to-noise ratios in the WISE data.
6 Conclusions
We have used images from four telescopes to determine the parallax and distance to the Y2 dwarf WISE 1828+2650. At pc, the object is among the coolest, lowest luminosity objects yet discovered in the solar neighborhood. The high tangential motion of the object suggests an age of 2-4 Gyr with a mass of 3-6 MJup. However, the absolute magnitude of WISE 1828+2650 is brighter by several magnitudes (depending on wavelength) than extrapolated from other Y dwarfs making the true nature of this source somewhat of a mystery. WISE 1828+2650 is similar in color and absolute magnitude to the cool object orbiting the nearby white dwarf WD 0806-661 B. The exact nature and evolutionary state, including its mass and age, of WISE 1828+2650 will require further observation and theoretical investigation.
The proximity of WISE 1828+2650 and other Y dwarfs will allow more precise determinations of their motions in the coming years as well as a search for any astrometric companions that might fall below detectability via direct imaging. The launch of JWST will allow measurement of the spectrum of WISE 1828+2650 and other objects with similarly low Teff from the deep red through to the mid-infrared, resulting in a much more detailed physical characterization and a better assessment of their ages and masses. Y dwarfs like WISE 1828+2650 and the companion WD 0806-661 B will become touchstones for spectroscopic modeling with direct applicability to the atmospheres of bona-fide planets now being measured with transit spectroscopy and direct imaging, e.g. Barman et al. (2011). The differences expected between bound objects (“planets”) and free-floating objects (likely brown dwarfs, but possibly free floating “planets”) should produce distinct spectroscopic markers distinguishable in the high SNR, high spectral resolution measurements possible with JWST.
7 Appendix I. Differential Refraction and Distortion Mapping
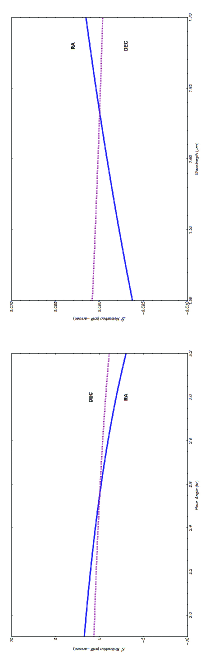
The positions of sources in the Keck images were corrected for the effects of differential refraction. The error introduced by coadding before source extraction is small compared to other sources of astrometric error. We applied to each extracted position a correction relative to the center of the field where and are the hour angle and declination at the center of the field with the HA specified at the middle of the roughly hour-long observational sequence. is the central wavelength of the H-band filter. Figure 9 shows 2nd order corrections to the differential refraction as a function of Hour Angle during the duration of one observation and for a change in effective wavelength across the H band. The curves show the changes in the differential refraction from the nominal 1st order correction at one corner of the Keck field of view (20″, center to corner). At the level of precision required for these measurements, these 2nd order differential effects can safely be ignored over the small Keck field.
To assess the effects of optical distortion on NIRC2 images in the wide field mode (40 mas pixels) we followed the procedure outlined in Yelda et al. (2010) using HST observations of the cluster M15. The HST data (Anderson et al., 2008) were corrected for the effects of non-orthogonal axes (coordinate skew). Keck observations of M15 were made in the H band using NIRC2 with a natural guide star Adaptive Optics at 2 epochs (Oct 2011 and July 2012). In July 2012 observations were made at 3 different orientations of the NIRC2 camera (0o,45o). At each rotation angle and epoch the telescope was stepped through a 9 position pattern across the cluster for a total of 36 separate observations of some portion of the cluster with each image containing between 50-250 matches between the Keck and HST source lists. The Keck data were extracted using IDL aper routine with a 5 pixel radius. After correction for the effects of differential refraction, lists of sources extracted from each image were rotated and shifted into registration with the HST stars. In total the HST stars probed 5631 unique positions in the NIRC2 focal plane (Figure 10). Nominal positions were obtained for the Keck sources using plate scale and rotational information derived from the image registration. Noise-weighted differences between the Keck and HST positions, , were fitted to a fourth order polynomial as a function of focal plane coordinates using the Mathematica routine LinearModelFit. The derived coefficients for transformation from native, distorted pixel coordinates into un-distorted, pixel coordinates are given in Eqns. 4-5 and Table 9. The coordinate system is centered at the center of the NIRC2 array and extends from 512.
| (4) | ||||
| (5) |
Standard equations then project the pixel coordinates onto the sky accounting for plate scale and rotation angle. Our H-band plate scale of 39.7650.004 mas/pixel is consistent with the 39.820.25 mas/pix from Metchev & Hillenbrand (2004) from comparison with a known binary system and somewhat smaller than the 39.900.08 and 39.860.02 Ksplate scales derived separately in x- and y- by Pravdo et al. (2006) from comparison with 17 HST stars.
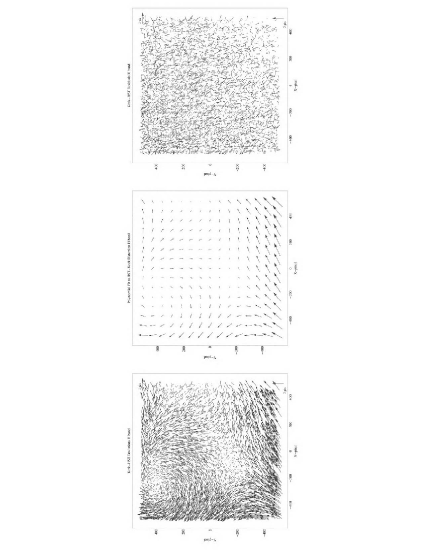
Examination of the residuals led to the rejection of 2% of the data, i.e. 100 points that deviated significantly in either amplitude or orientation from their neighbors. The first plot of the Figure 10 triptych shows Keck-HST positions differences as vectors. The central image shows a vector representation of the 4th order polynomial fitted to the distortion map. The third image shows the residuals in the Keck-HST differences after subtraction of the polynomial fit. The mean value of the Keck-HST residuals after the model subtraction in focal plane coordinates is mas. The distortion map was applied to the individual Keck images using an IDL script for “de-warping” developed by the Keck Observatory666http://www2.keck.hawaii.edu/inst/nirc2/forReDoc/post_observing/dewarp/.
References
- Alibert et al. (2005) Alibert, Y., Mousis, O., Mordasini, C., & Benz, W. 2005, ApJ, 626, L57 7-007.
- Anderson et al. (2008) Anderson, J., Sarajedini, A., Bedin, L. R., et al. 2008, AJ, 135, 2055
- Baraffe et al. (2003) Baraffe, I., Chabrier, G., Barman, T. S., Allard, F., & Hauschildt, P. H. 2003, A&A, 402, 701
- Barman et al. (2011) Barman, T. S., Macintosh, B., Konopacky, Q. M., & Marois, C. 2011, ApJ, 733, 65
- Burrows et al. (2003) Burrows, A., Sudarsky, D., & Lunine, J. I. 2003, ApJ, 596, 587
- Burrows et al. (2004) Burrows, A., Sudarsky, D., & Hubeny, I. 2004, ApJ, 609, 407
- Carpenter (2001) Carpenter, J. M. 2001, AJ, 121, 2851
- Charbonneau et al. (2005) Charbonneau, D., Allen, L. E., Megeath, S. T., et al. 2005, ApJ, 626, 523
- Chauvin et al. (2005) Chauvin, G. et al. 2005, A&A, 438, L29.
- Cutri et al. (2011) Cutri, R. M., Wright, E. L., Conrow, T., et al. 2011, Explanatory Supplement to the WISE Preliminary Data Release Products, 1
- Cumming et al. (2008) Cumming, A., Butler, R. P., Marcy, G. W., et al. 2008, PASP, 120, 531
- Cushing et al. (2011) Cushing, M. C., Kirkpatrick, J. D., Gelino, C. R., et al. 2011, ApJ, 743, 50
- Deming et al. (2006) Deming, D., Harrington, J., Seager, S., & Richardson, L. J. 2006, ApJ, 644, 560
- Dupuy & Liu (2012) Dupuy, T. J., & Liu, M. C. 2012, ApJS, 201, 19
- Epchtein et al. (1997) Epchtein, N., de Batz, B., Capoani, L., et al. 1997, The Messenger, 87, 27
- Faherty et al. (2009) Faherty, J. K., Burgasser, A. J., Cruz, K. L., et al. 2009, AJ, 137, 1
- Faherty et al. (2012) Faherty,J.K., Rice, E.L., Cruz,K.X, Mamajek,E.E, N u nez,A. 2012, arXiv:1206.5519v2
- Fazio et al. (2004) Fazio, G. G., Hora, J. L., Allen, L. E., et al. 2004, ApJS, 154, 10
- Green (1985) Green, R.M. 1985, Spherical Astronomy, Cambridge: Cambridge University Press, p.186.
- Griffith et al. (2012) Griffith, R. L., Kirkpatrick, J. D., Eisenhardt, P. R. M., et al. 2012, AJ, 144, 148
- Henry et al. (2006) Henry, T. J., Jao, W., Subasavage, J. P., Beaulieu, T. D., Ianna, P. A., Costa, E., & M endez,R. A. 2006, AJ, 132, 2360 (see also http://www.recons.org/census.posted.htm)
- Howard et al. (2010) Howard, A. W., Marcy, G. W., Johnson, J. A., et al. 2010, Science, 330, 653
- Kalas et al. (2004) Kalas, P., Liu, M. C., & Matthews, B. C. 2004, Science, 303, 1990
- Kirkpatrick, Beichman & Skrutskie (1997) Kirkpatrick, J. D., Beichman, C. A., & Skrutskie, M. F. 1997, ApJ, 476, 311
- Kirkpatrick et al. (1999) Kirkpatrick, J. D., Reid, I. N., Liebert, J., et al. 1999, ApJ, 519, 802
- Kirkpatrick (2005) Kirkpatrick, J. D. 2005, ARA&A, 43, 195
- Kirkpatrick et al. (2011) Kirkpatrick, J. D., Cushing, M. C., Gelino, C. R., et al. 2011, ApJS, 197, 19
- Kirkpatrick et al. (2012) Kirkpatrick, J. D., Gelino, C. R., Cushing, M. C., et al. 2012, ApJ, 753, 156
- Kozhurina-Platais et al. (2009) Kozhurina-Platais, V., Cox, C., McLean, B., et al. 2009, Space Telescope WFC Instrument Science Report, 34
- Lagrange et al. (2009) Lagrange, A. M. et al. 2009, A&A, 493, L21.
- Lang (1983) Lang, K.R. Astrophysical Formulae: A Compendium for the Physicist and Astrophysicist (Springer Study Edition), p. 262.
- Leggett et al. (2012) Leggett, S. K., Morley, C. V., Marley, M. S., et al. 2012, arXiv:1212.1210
- Luhman et al. (2011) Luhman, K. L., Burgasser, A. J., & Bochanski, J. J. 2011, ApJ, 730, L9
- Luhman et al. (2012) Luhman, K. L., Burgasser, A. J., Labbé, I., et al. 2012, ApJ, 744, 135
- Marley et al. (2007) Marley, M. S., Fortney, J. J., Hubickyj, O., Bodenheimer, P., & Lissauer, J. J. 2007, ApJ, 655, 541
- Marley et al. (2010) Marley, M. S., Saumon, D., & Goldblatt, C. 2010, ApJ, 723, L117
- Marley et al. (2012) Marley, M. S., Saumon, D., Cushing, M., et al. 2012, ApJ, 754, 135
- Marois et al. (2008) Marois, C., Macintosh, B., Barman, T., et al. 2008, Science, 322, 1348
- Marsh et al. (2012) Marsh, K. A., Wright, E. L., Kirkpatrick, J. D., et al. 2012, arXiv:1211.6977
- Metchev & Hillenbrand (2004) Metchev, S. A., & Hillenbrand, L. A. 2004, ApJ, 617, 1330
- Monet et al. (2010) Monet, D. G., Jenkins, J. M., Dunham, E. W., et al. 2010, arXiv:1001.0305
- Morley et al. (2012) Morley, C. V., Fortney, J. J., Marley, M. S., et al. 2012, arXiv:1206.4313
- Nakajima et al. (1995) Nakajima, T., Oppenheimer, B. R., Kulkarni, S. R., et al. 1995, Nature, 378, 463
- Oppenheimer et al. (1998) Oppenheimer, B. R., Kulkarni, S. R., Matthews, K., & van Kerkwijk, M. H. 1998, ApJ, 502, 932
- Quanz et al. (2012) Quanz, S.P. Lafreni‘ere, D. Meyer, M. R., Reggiani, M. M., and Buenzli, E., http://arxiv.org/pdf/1203.3647v1.pdf
- Pravdo et al. (2006) Pravdo, S. H., Shaklan, S. B., Wiktorowicz, S. J., et al. 2006, ApJ, 649, 389
- Rajan (2010) Rajan, A. et al. 2010, WFC3 Data Handbook , Version 2.1, (Baltimore: STScI).
- Riedel et al. (2011) Riedel, A. R., Murphy, S. J., Henry, T. J., et al. 2011, AJ, 142, 104
- Rogers & Seager (2010) Rogers, L. A., & Seager, S. 2010, ApJ, 712, 974
- Skrutskie et al. (2006) Skrutskie, M. F., Cutri, R. M., Stiening, R., et al. 2006, AJ, 131, 1163
- Smart (1977) Smart, W.M. Textbook on Spherical Astronomy, 6th Ed., Cambridge, UK:Cambridge Univ Press, p. 221.
- Spiegel & Burrows (2012) Spiegel, D. S., & Burrows, A. 2012, ApJ, 745, 174
- Stone (1996) Stone, R. C. 1996, PASP, 108, 1051
- Sumi et al. (2011) Sumi, T., Kamiya, K., Bennett, D. P., et al. 2011, Nature, 473, 349
- Tinney et al. (2012) Tinney, C. G., Faherty, J. K., Kirkpatrick, J. D., et al. 2012, ApJ, 759, 60
- Tokunaga et al. (2002) Tokunaga, A. T., Simons, D. A., & Vacca, W. D. 2002, PASP, 114, 180
- Torres et al (2008) Torres, C., Quast, G., Melo, C. & Sterzik, M. 2008, “Handbook of Star Forming Regions,Volume II: The Southern Sky” ASP Monograph Publ., Vol. 5., ed. Bo Reipurth, p.757
- van Dam et al. (2006) van Dam, M. A., et al. 2006, PASP, 118, 310
- Wizinowich et al. (2006) Wizinowich, P. L., et al. 2006, PASP, 118, 297
- Wilson et al. (2003) Wilson, J. C., Eikenberry, S. S., Henderson, C. P., et al. 2003, Proc. SPIE, 4841, 451
- Wong et al. (2004) Wong, M. H., Mahaffy, P. R., Atreya, S. K., Niemann, H. B., & Owen, T. C. 2004, Icarus, 171, 153
- Wright et al. (2010) Wright, E. L., Eisenhardt, P. R. M., Mainzer, A. K., et al. 2010, AJ, 140, 1868
- Yelda et al. (2010) Yelda, S., Lu, J. R., Ghez, A. M., et al. 2010, ApJ, 725, 331
- York et al. (2000) York, D. G., Adelman, J., Anderson, J. E., Jr., et al. 2000, AJ, 120, 1579
- Zacharias et al. (2010) Zacharias, N., Finch, C., Girard, T., et al. 2010, AJ, 139, 2184
- Zuckerman & Song (2004) Zuckerman, B., & Song, I. 2004, ARA&A, 42, 685
- Zuckerman et al. (2004) Zuckerman, B., et al., 2004, ApJ, 613,L65
| Telescope | Epoch | Modified Julian Date | Comment |
|---|---|---|---|
| WISE | 2010-03-30 | 55285.00 | |
| Keck/NIRC2-LGS | 2010-07-01 | 55378.44 | PI, Wright |
| Spitzer/IRAC | 2010-07-10 | 55387.34 | PI, Mainzer, PropID=9/551 |
| WISE | 2010-09-28 | 55467.00 | |
| Spitzer/IRAC | 2010-12-04 | 55534.27 | PI, Kirkpatrick, PropID=10/70062 |
| HST/WFC3-IR | 2011-05-09 | 55690.89 | PI, Kirkpatrick,PropID=12330 |
| Keck/NIRC2-LGS | 2011-10-16 | 55850.21 | PI, Beichman |
| Spitzer/IRAC | 2011-11-19 | 55894.04 | PI, Kirkpatrick,PropID=10/80109 |
| Spitzer/IRAC | 2012-05-25 | 56072.25 | PI, Kirkpatrick,PropID=10/80109 |
| Keck/NIRC2-LGS | 2012-07-09 | 56117.32 | PI, Beichman |
| Keck/NIRC2-LGS | 2012-10-07 | 56207.22 | PI, Beichman |
| RA | DEC | F140W | Center | Posn. | Dataset | |
|---|---|---|---|---|---|---|
| (J2000) | (J2000) | (mag) | (mag) | Dist.(″) | Err. (mas) | |
| 277.10529566 | 26.85705074 | 15.66 | 0.001 | 84.9 | 42.3 | Spitzer,2MASS |
| 277.10824423 | 26.85082312 | 19.56 | 0.020 | 65.7 | 32.8 | Spitzer |
| 277.11519519 | 26.83369321 | 17.27 | 0.002 | 52.5 | 26.2 | Spitzer |
| 277.11647015 | 26.84300085 | 16.57 | 0.002 | 34.2 | 17.0 | Spitzer,2MASS |
| 277.11790606 | 26.85103552 | 19.63 | 0.009 | 39.6 | 19.7 | Spitzer |
| 277.12026174 | 26.82339456 | 17.37 | 0.002 | 76.3 | 38.0 | Spitzer |
| 277.12155151 | 26.84341695 | 18.21 | 0.003 | 17.8 | 8.9 | Keck |
| 277.12463494 | 26.84734988 | 19.24 | 0.005 | 15.3 | 7.7 | Keck |
| 277.12479343 | 26.84571497 | 21.22 | 0.018 | 10.3 | 5.6 | Keck |
| 277.12494638 | 26.84401162 | 20.30 | 0.010 | 7.0 | 3.7 | Keck |
| 277.12662489 | 26.84369877 | 21.76 | 0.025 | 1.5 | 3.3 | Keck |
| 277.12761710 | 26.86279933 | 17.29 | 0.002 | 68.8 | 34.2 | Spitzer |
| 277.12799324 | 26.84048725 | 19.13 | 0.005 | 11.9 | 6.0 | Keck |
| 277.12816179 | 26.84302297 | 20.64 | 0.013 | 4.2 | 2.7 | Spitzer,Keck |
| 277.12865656 | 26.83903755 | 18.24 | 0.003 | 17.5 | 8.7 | Keck |
| 277.12877327 | 26.85757557 | 15.28 | 0.001 | 50.2 | 25.0 | Spitzer,2MASS |
| 277.12906930 | 26.84100634 | 19.52 | 0.006 | 11.6 | 5.8 | Keck |
| 277.12971270 | 26.85534671 | 17.50 | 0.002 | 42.7 | 21.3 | Spitzer |
| 277.13008161 | 26.84907455 | 20.55 | 0.011 | 21.6 | 10.8 | Spitzer,Keck |
| 277.13061562 | 26.84941597 | 20.97 | 0.016 | 23.5 | 11.9 | Spitzer,Keck |
| 277.13116667 | 26.84513525 | 20.09 | 0.008 | 14.1 | 7.1 | Keck |
| 277.13117765 | 26.85026363 | 19.96 | 0.008 | 27.0 | 13.5 | Spitzer,Keck |
| 277.13143360 | 26.84232633 | 22.04 | 0.034 | 14.8 | 8.6 | Keck |
| 277.13152398 | 26.84961178 | 20.11 | 0.008 | 25.6 | 12.8 | Spitzer,Keck |
| 277.13173964 | 26.85489175 | 17.43 | 0.002 | 42.9 | 21.4 | Spitzer |
| 277.13310074 | 26.86055572 | 16.21 | 0.001 | 63.7 | 31.7 | Spitzer,2MASS |
| 277.13366038 | 26.82526749 | 16.28 | 0.002 | 69.6 | 34.7 | Spitzer,2MASS |
| 277.13461287 | 26.83484333 | 18.35 | 0.004 | 40.0 | 19.9 | Spitzer |
| 277.13763243 | 26.83161343 | 19.20 | 0.007 | 55.1 | 27.5 | Spitzer |
| 277.14074059 | 26.83242086 | 16.24 | 0.001 | 59.8 | 29.8 | Spitzer,2MASS |
| 277.14122122 | 26.84312777 | 17.25 | 0.002 | 45.4 | 22.6 | Spitzer |
| 277.14136220 | 26.84167755 | 17.19 | 0.002 | 46.4 | 23.1 | Spitzer,2MASS |
| 277.14168068 | 26.83999147 | 15.44 | 0.001 | 48.7 | 24.3 | Spitzer,2MASS |
| 277.14393913 | 26.84815732 | 16.63 | 0.001 | 56.4 | 28.1 | Spitzer,2MASS |
| 277.14408060 | 26.83259772 | 14.24 | 0.001 | 67.6 | 33.7 | Spitzer,2MASS |
| 277.14510022 | 26.83998378 | 17.04 | 0.002 | 59.4 | 29.6 | Spitzer |
| 277.14677186 | 26.83408275 | 14.78 | 0.001 | 72.1 | 35.9 | Spitzer,2MASS |
| 277.14732238 | 26.83496895 | 17.38 | 0.002 | 72.2 | 35.9 | Spitzer |
| Telescope | Date,UT | Filter | m) | Mag. (mag) | SNR | FJy)1 |
|---|---|---|---|---|---|---|
| Keck/NIRC2 | 2010-07-01 | J3 | 1.25 | 23.570.35 | 3 | 0.59 0.21 |
| HST/WFC3 | 2011-05-09 | F140W | 1.39 | 23.150.09 | 11 | 0.75 0.07 |
| Keck/NIRC2 | Average | H | 1.65 | 22.450.082 | 17 | 1.07 0.09 |
| Keck/NIRC2 | 2010-07-01 | H | 1.65 | 22.520.23 | 5 | 1.34 0.25 |
| Keck/NIRC2 | 2011-10-16 | H | 1.65 | 22.420.14 | 11 | 1.24 0.13 |
| Keck/NIRC2 | 2012-07-09 | H3 | 1.65 | 22.460.12 | 11 | 1.40 0.12 |
| WISE | 2010-03-30 | W14 | 3.35 | 18.5 | 12 | |
| Spitzer/IRAC5 | 2010-07-10 | Ch1 | 3.55 | 17.170.03 | 55 | 38.1 1.1 |
| Spitzer/IRAC | Average | Ch2 | 4.49 | 14.660.03 | 75 | 247 9 |
| Spitzer/IRAC | 2010-07-10 | Ch2 | 4.49 | 14.610.05 | 60 | 256 13 |
| Spitzer/IRAC | 2010-12-04 | Ch2 | 4.49 | 14.600.05 | 40 | 261 13 |
| Spitzer/IRAC | 2011-11-29 | Ch2 | 4.49 | 14.700.05 | 40 | 238 12 |
| Spitzer/IRAC | 2012-05-25 | Ch2 | 4.49 | 14.720.05 | 50 | 232 12 |
| WISE | 2010-03-30 | W2 | 4.6 | 14.390.06 | 20 | 299 18 |
| WISE | 2010-03-30 | W34 | 11.56 | 12.5 | 290 | |
| WISE | 2010-03-30 | W44 | 22.08 | 8.8 | 2501 |
Note. — 1Flux densities have not been color-corrected.2Uncertainty weighted average, including 5% calibration uncertainty.3 Keck NIRC2/LGS result from Kirkpatrick et al. (2011). 4 Upper limits are 95% confidence. 5Includes 3% IRAC calibration uncertainty.
| Tel-1/Tel-2 | Date(UT) | Number of | Rot. Unc.3 | |||
|---|---|---|---|---|---|---|
| Stars | (mas) | (mas) | (mas) | (deg) | ||
| HST/2MASS4 | 2011-05-09 | 11 | 10 | -2 | 4 | 0.028 |
| Keck/HST | 2010-07-01 | 11 | 0.0 | 0.0 | 3 | 0.003 |
| Spitzer/HST | 2010-07-10 | 22 | 2 | -11 | 11 | 0.010 |
| Spitzer/HST | 2010-12-04 | 21 | 17 | 11 | 16 | 0.017 |
| Keck/HST | 2011-10-16 | 21 | 1.7 | 0.0 | 3 | 0.003 |
| Spitzer/HST | 2011-11-29 | 16 | -22 | 17 | 18 | 0.019 |
| Spitzer/HST | 2012-05-25 | 15 | 5 | -16 | 13 | 0.015 |
| Keck/HST | 2012-07-09 | 15 | -1.8 | 2.4 | 3 | 0.003 |
| Keck/HST | 2012-10-07 | 20 | -0.2 | -0.1 | 12 | 0.009 |
Note. — 1) Difference between two reference frames; 2) Standard deviation of the mean, (,in the offset in RA, DEC between stars observed with both telescopes; 3) Uncertainty in image rotation; 4) after removal of ()(initial HST-2MASS)=(-0.50,0.15)′′ offset.
| Telescope | Date(UT) | MJD1 | RA (sec)2 | DEC(″)2 | Uncertainty(″)3 |
|---|---|---|---|---|---|
| WISE4 | 2010-Mar-30 | 55284.50 | 31.07805 | 37.9040 | 0.210 |
| Keck1 | 2010-Jul-01 | 55378.44 | 31.10325 | 37.9443 | 0.029 |
| Spitzer1 | 2010-Jul-10 | 55387.34 | 31.10961 | 37.9780 | 0.058 |
| WISE4 | 2010-Sep-28 | 55467.00 | 31.09463 | 37.8860 | 0.210 |
| Spitzer2 | 2010-Dec-04 | 55534.27 | 31.12461 | 37.9020 | 0.062 |
| Hubble | 2011-May-09 | 55690.89 | 31.17538 | 38.0725 | 0.030 |
| Keck2 | 2011-Oct-16 | 55850.21 | 31.19329 | 38.0785 | 0.025 |
| Spitzer3 | 2011-Nov-29 | 55894.04 | 31.20339 | 38.1592 | 0.062 |
| Spitzer4 | 2012-May-25 | 56072.25 | 31.24935 | 38.2111 | 0.061 |
| Keck3 | 2012-Jul-08 | 56117.32 | 31.25462 | 38.3020 | 0.025 |
| Keck4 | 2012-Oct-07 | 56207.22 | 31.25951 | 38.1087 | 0.040 |
Note. — 1) MJD=Modified Julian Date; 2) Relative to and (J2000.0); 3)Excludes 80 mas uncertainty in absolute 2MASS reference frame. 4) Not included in fitting due to large uncertainties.
| Telescope | MJD1 | (BD-SrcA,″) | (BD-SrcA,″) | Uncertainty(″)2 |
|---|---|---|---|---|
| Keck1 | 55378.44 | 4.647 | 3.042 | 0.032 |
| Spitzer1 | 55387.34 | 4.609 | 3.179 | 0.121 |
| Spitzer2 | 55534.27 | 4.896 | 3.009 | 0.122 |
| HST | 55690.89 | 5.570 | 3.192 | 0.018 |
| Keck2 | 55850.21 | 5.853 | 3.175 | 0.015 |
| Spitzer3 | 55894.04 | 5.884 | 3.264 | 0.134 |
| Spitzer4 | 56072.25 | 6.535 | 3.301 | 0.134 |
| Keck3 | 56117.32 | 6.615 | 3.374 | 0.016 |
| Keck4 | 56207.22 | 6.695 | 3.303 | 0.042 |
Note. — 1) MJD=Modified Julian Date; 2) Includes uncertainties due to extraction uncertainties, field rotation, residual Keck distortion.
| Parameter | Method-11 | Method-22 | Method-(1+2)(2) |
|---|---|---|---|
| (″/yr) | 0.9690.017 | 0.9360.015 | 0.9540.011 |
| (″/yr) | 0.1570.019 | 0.1520.017 | 0.1530.0125 |
| Parallax, ,(″) | 0.1030.016 | 0.0790.012 | 0.0900.0095 |
| Distance (pc) | 9.7 | 12.6 | 11.2 |
| 0.077s | 0.012s | ||
| (with # deg. of freedom) | 18.6 (13) | 12.7 (13) | 36.3 (31) |
| Adopted Distance4 (pc) | 11.2 | ||
| Tangential Velocity4, (km s-1) | 45 | ||
Note. — 1) Based on “absolute coordinates”; 2) Based on offsets from Source A; 3) With respect to and . The random uncertainty does not include 80 mas uncertainty in absolute 2MASS reference frame. 4) From the combination of Method-1 and Method-2.
| Name1 | Age | U(2) | V | W | Min |
|---|---|---|---|---|---|
| (Myr) | (km s-1) | (km s-1) | (km s-1) | (km s-1) | |
| Argus/IC2391 | 40 | -22 | -14.4 | -5 | 46 |
| TW Hydrae | 8 | -11 | -18 | -5 | 50 |
| Tucana/Horologium | 30 | -11 | -21 | 0 | 55 |
| Pictoris | 12 | -11 | -16 | -9 | 48 |
| AB Doradus | 50 | -8 | -27 | -14 | 49 |
| Chamaeleontis | 8 | -12 | -19 | -10 | 46 |
| Columba | 30 | -13 | -22 | -6 | 50 |
| Parameter | X-Estimate | X-Uncertainty | Y-Estimate | Y-Uncertainty |
|---|---|---|---|---|
| const. | -0.306229 | 6.16 | -0.700962 | 6.16 |
| x | 0.00369728 | 2.44 | -0.00134633 | 2.44 |
| y | -0.0021500 | 2.39 | -0.00333556 | 2.39 |
| x2 | 7.931 | 1.17 | 6.116 | 1.17 |
| x y | -1.112 | 1.02 | 2.258 | 1.02 |
| y2 | 1.0698 | 1.15 | 5.081 | 1.15 |
| x3 | -5.857 | 1.47 | -1.957 | 1.47 |
| x2y | 1.015 | 1.39 | 2.677 | 1.39 |
| xy2 | -3.869 | 1.35 | 1.060 | 1.35 |
| y3 | 6.10 | 1.36 | 5.217 | 1.36 |
| x4 | -8.486 | 5.21 | 9.835 | 5.21 |
| x3y | 9.712 | 4.90 | -3.382 | 4.90 |
| x2y2 | -5.878 | 4.73 | 2.080 | 4.73 |
| xy3 | 2.695 | 4.78 | -4.396 | 4.78 |
| y4 | -2.244 | 4.88 | -2.219 | 4.88 |