S. Wedemeyer
The CO5BOLD Analysis Tool
Abstract
The interactive IDL-based CO5BOLD Analysis Tool (CAT) was developed to facilitate an easy and quick analysis of numerical simulation data produced with the 2D/3D radiation magnetohydrodynamics code CO5BOLD. The basic mode of operation is the display and analysis of cross-sections through a model either as 2D slices or 1D graphs. A wide range of physical quantities can be selected. Further features include the export of models into VAPOR format or the output of images and animations. A short overview including scientific analysis examples is given.
keywords:
Sun: photosphere; Radiative transfer1 Introduction
The growing computational resources allow for increasingly larger and more detailed numerical simulations of stellar atmospheres, resulting in a considerably large amount of data. The production of advanced comprehensive models must therefore be accompanied by the development of efficient analysis and visualization software that is capable of handling the produced large data sets. Here, the CO5BOLD Analysis Tool (abbreviated CAT, Fig. 1) is described. It is designed for an interactive analysis of 2D and 3D model atmospheres, which are produced with CO 5BOLD – a widely used state-of-the-art code for the simulation of stellar atmospheres (Freytag et al., 2012).


2 Program overview
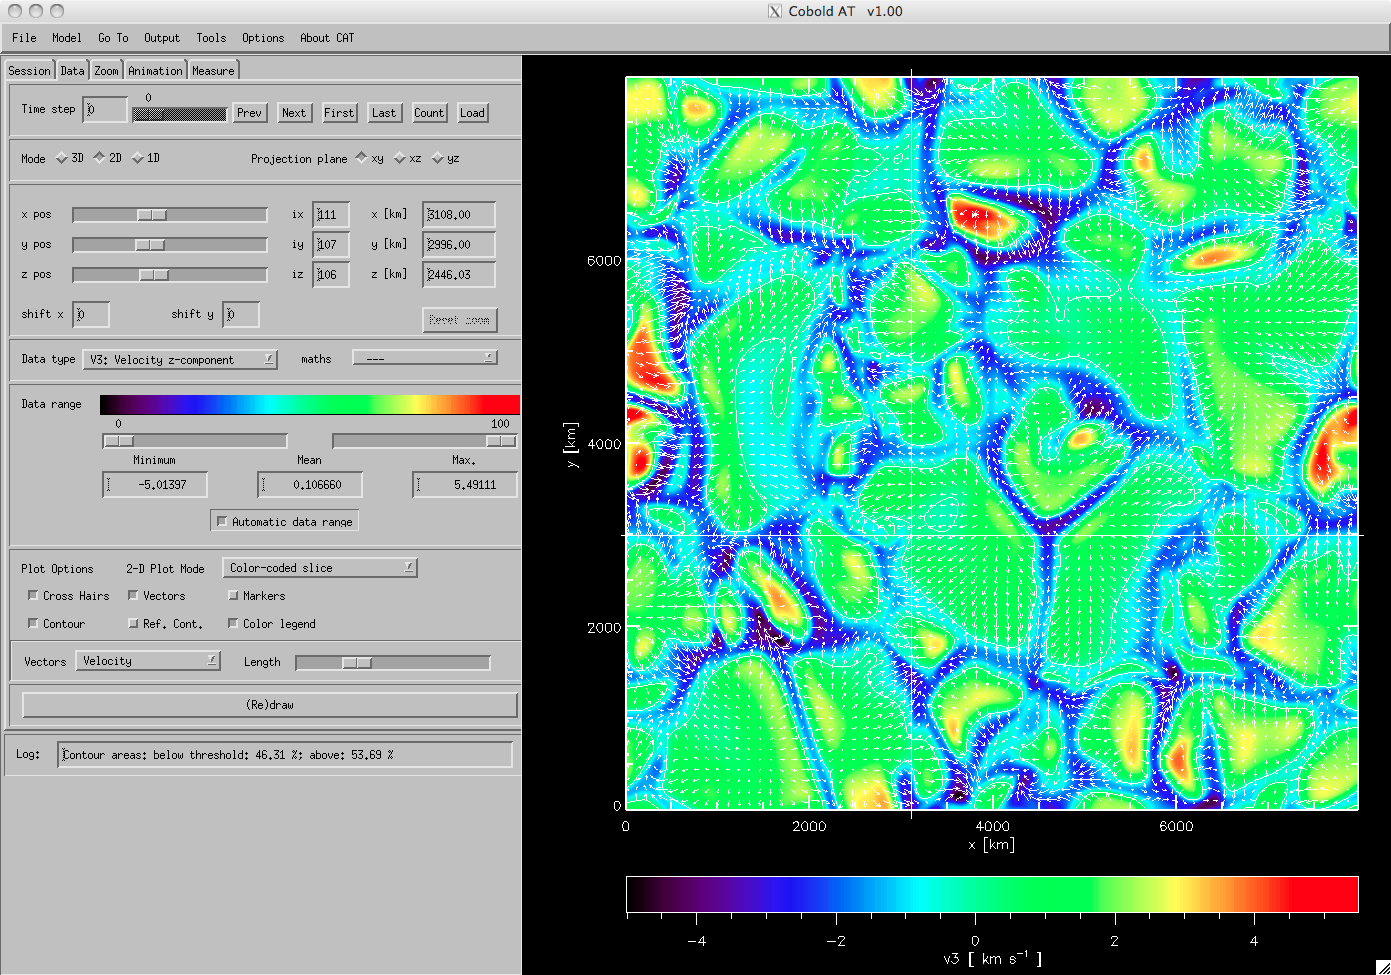
CAT has an interactive graphical user interface, which is is programmed in IDL (see Fig. 2). The primary mode of operation is the display and analysis of slices through 3D (or 2D) models. CAT can handle files with multiple snapshots (.full).
Settings and sessions.
After the installation, adjustments such as the default window size and paths can be made and saved. These standard settings will be restored every time CAT is started. Settings that are connected to a particular analysis session can be saved and restored as session files. It is possible to define a default session, which is automatically loaded when CAT starts.
Slice display
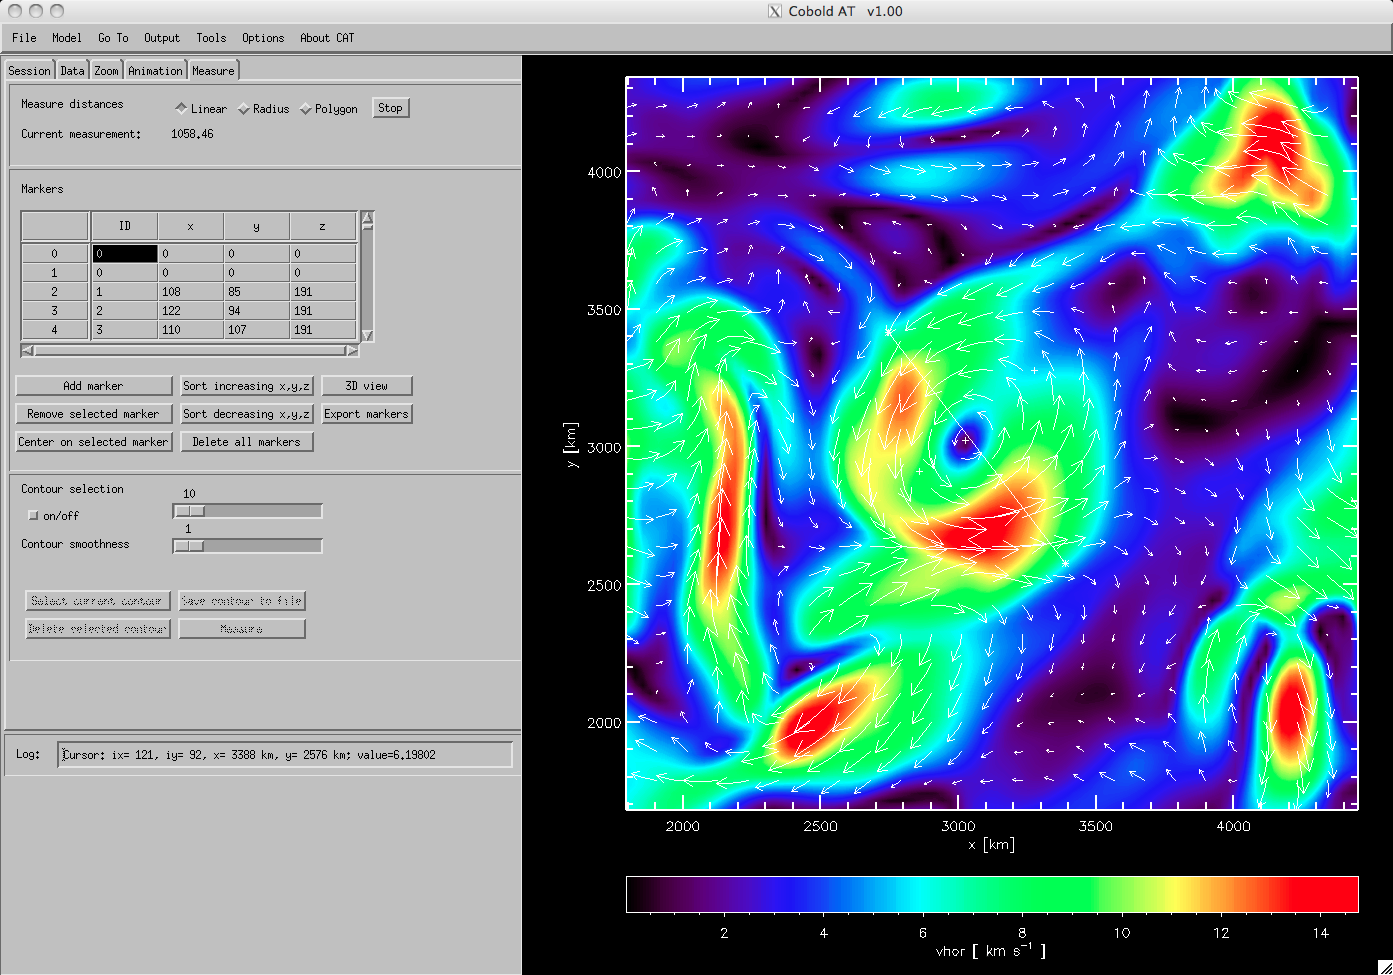
The projection plane can be chosen perpendicular to the axes, resulting in the three planes x-y, x-z, and y-z in a 3D model. The position within a plane can be changed either by clicking in the displayed image or through the widgets in the control panel. CAT now also provides a zoom function in a separate tab, in which the magnification and the currently displayed region can be selected (see Fig. 3 for a close-up region).
Different physical quantities can be chosen in the data tab (see Fig. 2), ranging from the basic quantities contained in the model file to more advanced quantities like, e.g., the spatial components of the electric current density (e.g., Schaffenberger et al., 2005). The chosen quantity can then be combined with a mathematical operation, e.g. the logarithm, which is useful for quantities that cover many orders of magnitude in the displayed slice (e.g., the mass density in the x-z plane). By default, a color-coded 2D slice is displayed. Alternatively, the data in the current projection plane can be shown as surface plot, contour plot or line plot. Color-coded slices can be overlaid with contours (incl. a reference contour at optical depth unity) and/or a vector field. For the latter the spatial components of the velocity or the magnetic field in the selected projection plane can be drawn as vectors or streamlines, while the perpendicular component is not considered. The length of the vectors can be chosen directly in the data tab with more options being available in the options menu.
Measurements.
The new measure tab provides different tools for (i) measuring distances between two points or along a polygon path, (ii) defining markers, and (iii) producing and exporting contour paths. The markers, which are sets of coordinates, and the contours can be interactively selected, modified and exported for further processing. These tools can be used for, e.g., defining 3D structures or for manually tracking features in space and time.
Images and animation.
The displayed images can be output in various image formats. The animation tool provides an interactive way to produce MPEG videos or image sequences. It can either be a time animation for a series of model snapshots contained in one or more multi-snapshot file(s) or a spatial scan through a selected model snapshot along one of the spatial axes.
Export.
CAT offers several options to export model data. The currently loaded simulation snapshot can be written out in UIO format, even when it is part of a multi-snapshot (.full) file. This feature is useful if a simulation terminated without producing an .end file or if this file is corrupted for some reason. In this case CAT can be used to extract the last time step from the corresponding .full file for using it as start model for the next simulation run. Model snapshots can also be saved as plane-parallel models. In a coming version, it will be possible to save only parts of the model and to extract data into IDL savefiles for further analysis.
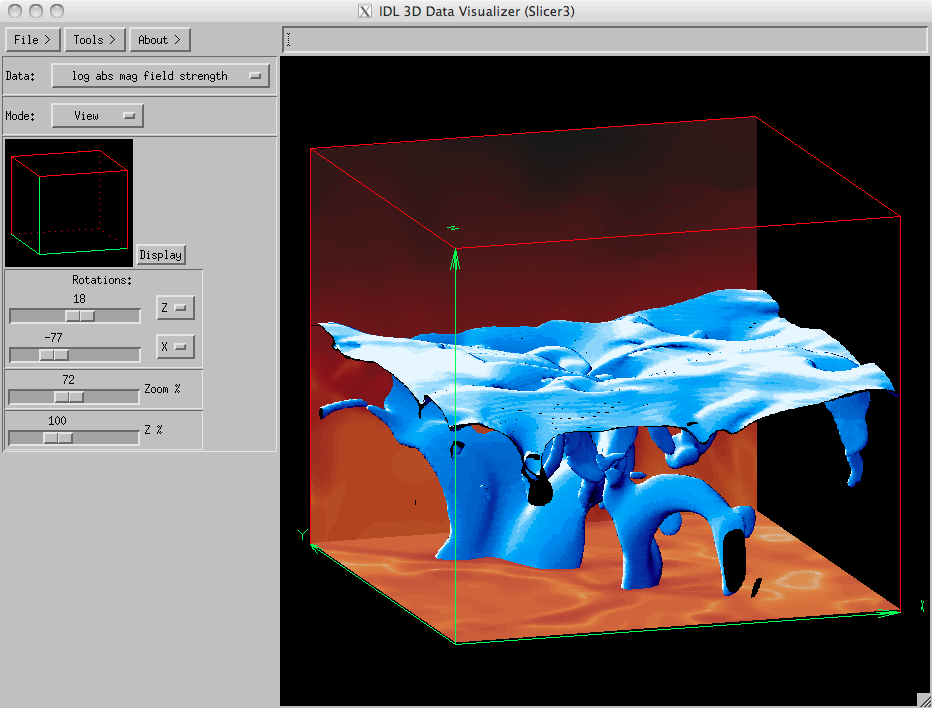
The 3D visualization tool, which is integrated in CAT, can give a first 3D impression but has limited functionality (see Fig. 4). The VAPOR tool (Clyne et al., 2007; Clyne & Rast, 2005) allows for a more comprehensive analysis of the 3D structure, in particular for vector fields like velocity and magnetic field. For that reason, CAT offers the possibility to export CO 5BOLD data into VAPOR format.

3 Data analysis examples
CAT has been repeatedly proved useful in the past. It provides an easy way of monitoring the evolution of an ongoing simulation. CAT can also help to quickly reveal what is wrong in cases where a simulation terminates due to problems at a specific grid cell. Next to these “care-taking” tasks, CAT as been essential for the detailed scientific analysis in many cases.
Swirls and tornadoes.
One example is the discovery of ring-like structures with increased horizontal velocity at chromospheric heights in 3D magnetohydrodynamic (MHD) models of the Sun. Similar rings were previously observed as so-called “chromospheric swirls” with the Swedish 1-m Solar Telescope (Wedemeyer-Böhm & Rouppe van der Voort, 2009). The rings of enhanced velocity, which appeared prominently in CAT (see Fig. 3), suggested that chromospheric swirls are the observational signature of rotating magnetic field structures. This finding finally led to a more comprehensive study of this phenomenon, then known as “magnetic tornadoes” (Wedemeyer-Böhm et al., 2012).
M-type dwarf stars.
CAT has been extensively used for the development of 3D MHD atmosphere models of M-type dwarf stars that extend from the upper convection zone into the chromosphere (Wedemeyer et al., 2012). The resulting set of models with different initial magnetic fields with different field strengths and different topologies (e.g., homogeneous vertical or mixed polarities) will be analysed in more detail in forthcoming publications.
4 Outlook
Since the first version in 2002, the development of CAT has been driven by the need for additional functionality for the analysis of increasingly complex models. Also in the future, CAT will be continuously extended. The feedback of users is therefore very welcome. Possible extensions in future releases could include the ability to read the data formats of other MHD codes and to display and analyse slices at arbitrary angles.
Acknowledgements.
The author likes to thank the organisers of the 2nd CO 5BOLD Workshop (CW2), which was held in Heidelberg, Germany, in 2012.References
- Clyne et al. (2007) Clyne, J., Mininni, P., Norton, A., & Rast, M. 2007, New J. Phys, 9, 1
- Clyne & Rast (2005) Clyne, J. & Rast, M. 2005, in Proceedings of Visualization and Data Analysis 2005, ed. J. C. G. M. T. B. K. Edited by Erbacher, Robert F.; Roberts, 284–294
- Freytag et al. (2012) Freytag, B., Steffen, M., Ludwig, H.-G., et al. 2012, Journal of Computational Physics, 231, 919
- Schaffenberger et al. (2005) Schaffenberger, W., Wedemeyer-Böhm, S., Steiner, O., & Freytag, B. 2005, in ESA Special Publication, Vol. 596, Chromospheric and Coronal Magnetic Fields, ed. D. E. Innes, A. Lagg, & S. A. Solanki
- Wedemeyer et al. (2012) Wedemeyer, S., Ludwig, H.-G., & Steiner, O. 2012, ArXiv e-prints
- Wedemeyer-Böhm & Rouppe van der Voort (2009) Wedemeyer-Böhm, S. & Rouppe van der Voort, L. 2009, A&A, 507, L9
- Wedemeyer-Böhm et al. (2012) Wedemeyer-Böhm, S., Scullion, E., Steiner, O., et al. 2012, Nature, 486, 505