DNA-Programmed Mesoscopic Architecture
Abstract
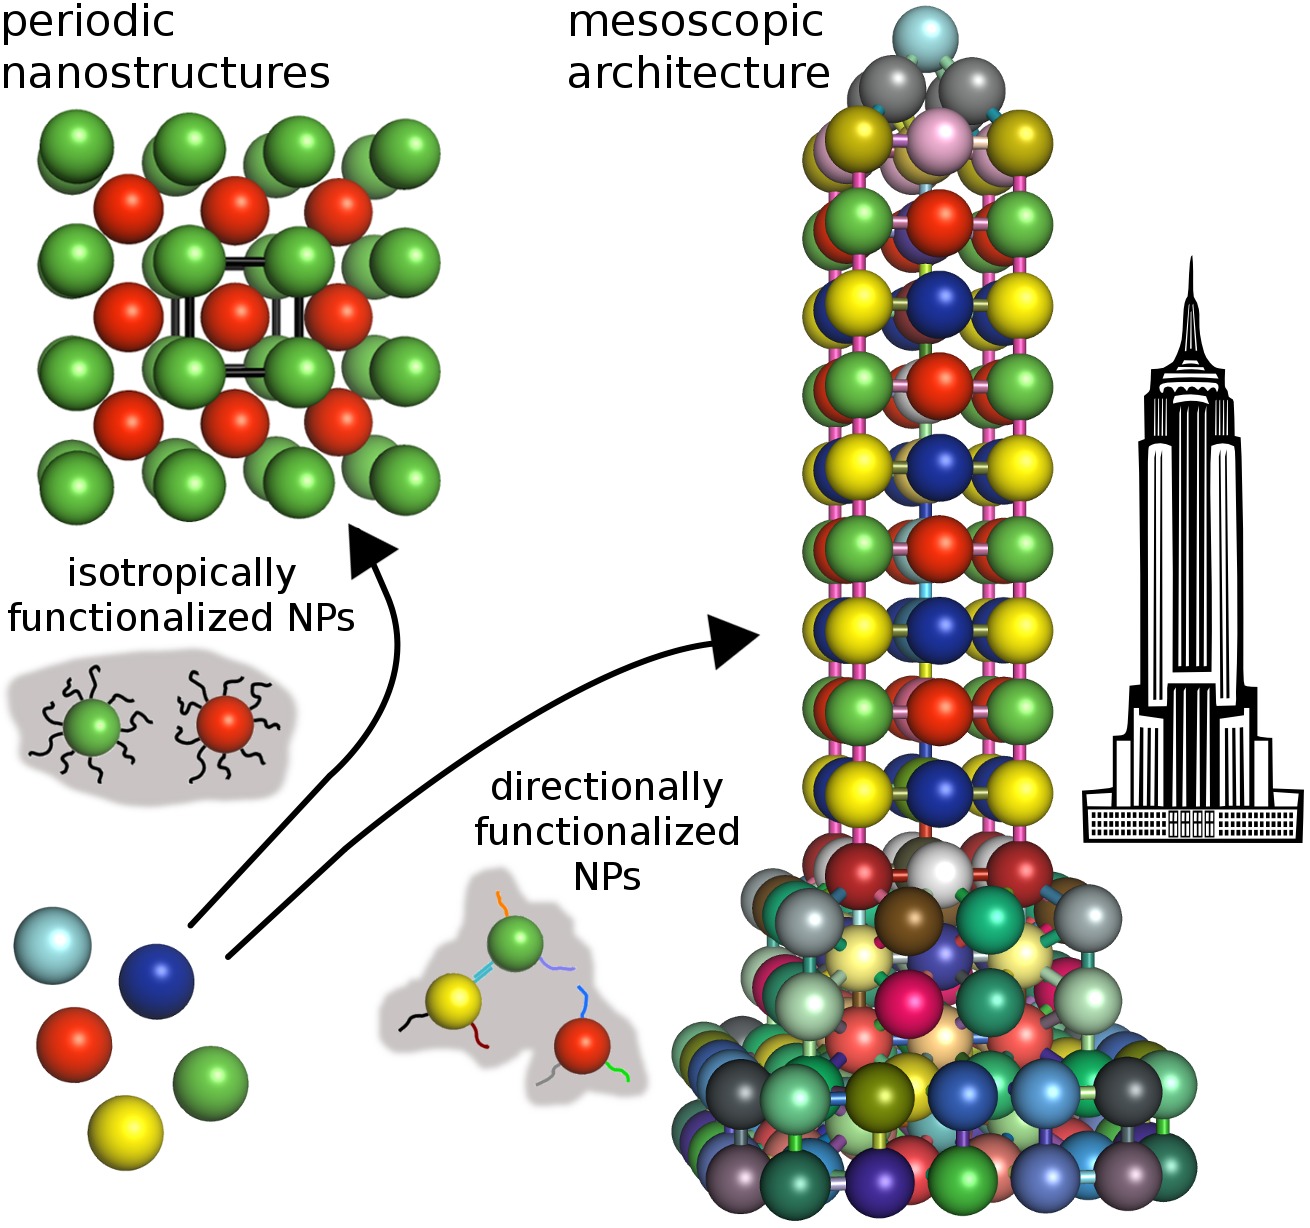
We study the problem of the self-assembly of nanoparticles (NPs) into finite mesoscopic structures with a programmed local morphology and complex overall shape. Our proposed building blocks are NPs directionally-functionalized with DNA. The combination of directionality and selectivity of interactions allows one to avoid unwanted metastable configurations which have been shown to lead to slow self-assembly kinetics even in much simpler systems. With numerical simulations, we show that a variety of target mesoscopic objects can be designed and self-assembled in near perfect yield. They include cubes, pyramids, boxes and even an Empire State Building model. We summarize our findings with a set of design strategies that lead to the successful self-assembly of a wide range of mesostructures.
pacs:
82.70.Dd,87.14.gk,81.16.Dn,81.07.-bI Introduction
Impressive progress has been made recently in using the molecular recognition properties of DNA to direct the self-assembly of nanoparticles Mirkin et al. (1996); Alivisatos et al. (1996) into a variety of periodic nanostructures Nykypanchuk et al. (2008); Park et al. (2008); Macfarlane et al. (2011). Many experimental Kim et al. (2006); Leunissen et al. (2009); Kim et al. (2009); Scarlett et al. (2011); Rogers and Crocker (2011) and theoretical Tkachenko (2002); Hsu et al. (2010); Martinez-Veracoechea et al. (2011); Knorowski et al. (2011); Padovan-Merhar et al. (2011); Angioletti-Uberti et al. (2012) studies have aided our understanding of these systems and helped in formulating design rules. However, the NP-DNA superlattices that have been the focus of most of the research to date, represent only a small subset of the plausible morphologies for this class of systems. One may expect that DNA hybridization would enable one to design arbitrary nanoparticle clusters with a prescribed overall architecture. In this work, we explore a methodology for “programming” such NP-DNA mesoscopic structures, and test it with computer simulations. We demonstrate that the slow kinetics and errors typically associated with unwanted metastable states can be completely avoided for nanoparticles which are directionally functionalized with DNA.
Conceptually, we are looking for the solution of the inverse problem in self-assembly: To identify the set of constituent particles that will form the desired structure in a robust, error-free manner. In a finite set of colloids isotropically functionalized with DNA, one can design the pairwise DNA-mediated interactions so that a particular target cluster will be its ground state Licata and Tkachenko (2008); Meng et al. (2010); Hormoz and Brenner (2011). However, it has been shown both theoretically and experimentally that the space of metastable configurations in such a system grows rapidly with the cluster size, making the overall kinetics very slow. Furthermore, in order to program a structure containing particles one would typically need to use distinct DNA sequences to encode each individual particle differently, and isolate a complete set of particles prior to the self-assembly. In the theoretical paper that precedes this work Tkachenko (2011), we have argued that these problems are avoided by the use of directionally-functionalized nanoparticles (dfNPs) (see Fig. 1). It has been argued that the target structure is kinetically preferred if the partially built mesostructure is sufficiently rigid to avoid undesired bonds. We have also estimated the upper bound of the number of DNA sequences needed to program a particular structure. In this work, we use computer simulations to move from that abstract theoretical foundation towards more specific and practical realizations.
The dfNPs are more complex than regular DNA-functionalized particles due to the fact that single-stranded DNA (ssDNA) with given sequences are attached at well-defined positions rather than randomly. Recent experiments indicate that achieving a greater control over DNA functionalization and eventually building arbitrary dfNPs is within reach. For instance, Suzuki et al. Suzuki et al. (2009) have made particles with two distinct ssDNA attached at a well-defined separation. Kim et al. Kim et al. (2011) used electrostatic repulsion to form dfNPs with up to 6 ssDNA, and colloidal particles with controlled DNA surface patches have also been synthesized Wang et al. (2012). Theoretically, we proposed several pathways to self-assemble dfNPs Licata and Tkachenko (2008); Tkachenko (2011), inspired by advances in DNA nanotechnology Winfree et al. (1998); Barish et al. (2009); Rothemund (2006). These building blocks, in addition to the mutual recognition of the neighboring particles, provide control over valence (number of bonds per particle) and, to a large extent, bond directionality. In other words, dfNPs combine the advantages of two major classes of building blocks proposed for programmable self-assembly: high selectivity of binding typical for isotropic DNA-functionalized particles and the directionality of interactions similar to that of patchy colloids Glotzer and Solomon (2007).
One can also make a parallel between our approach and the booming field of DNA nanotechnology. Similar to DNA origami Rothemund (2006) and most recent DNA Lego Ke et al. (2012) approaches, our objective is to create a mesoscopic 3D object with predetermined architecture, and similar to DNA tiling and algorithmic self-assembly Winfree et al. (1998); Barish et al. (2009); Park et al. (2006), we rely on selective directional interactions to program the structure. However, in our case NPs of an arbitrary type are naturally incorporated into the design, which greatly expands the range of potential applications.
II Model and Methodology
The central idea of our approach is to encode bonds between neighboring NPs in the target state with a pair of complementary ssDNA, each grafted to its respective particle. This design procedure maps the desired mesostructure onto a set of dfNPs. Upon hybridization of the ssDNA pairs, the rigid double-stranded DNA (dsDNA) bonds are formed. If the scheme is successful a collection of identical programmed mesostructures will assemble. Here we engineer a number of increasingly complex mesostructures, and use Brownian dynamics simulations to verify that the mesostructures self-assemble from an initially disordered solution of dfNPs.
We have in mind NPs of size 5–50 nm in solution. In the simulations, particles undergo translational and rotational Brownian motion subject to a pairwise excluded-volume potential , where is the separation distance and is the particle radius. The DNA bonds are modeled by a harmonic potential with . The particle volume fraction is , where is the number of particles and is the side of the cubic simulation box. Periodic boundary conditions were used.
The forming and breaking of dsDNA bonds was treated using a stochastic scheme based on a local equilibrium model. For a binary system where each NP is grafted with a single DNA chain of sequence or its complement , the dissociation and association rate constants are related by
| (1) |
where and . In the definition of , is the entropy of hybridization of free DNA, is the universal gas constant and is the absolute temperature. Eq. 1 has been written such that the equilibrium fraction of dimers is at , where is approximately equal to the melting temperature of free dsDNA with the sequence at concentration C. The control parameter characterizes the deviation from and in general it can be different for each dsDNA bond in the mesostructure.
Bond forming and breaking was attempted at each time step of the simulation after the positions and orientations of the particles were updated. Our approach uses an implicit model of DNA where only the surface positions or site locations of the ssDNA are needed. Particle pairs with complementary sites that are not bonded and separated by less than are added to a list of possible site-site bonds. The number of bonds to actually form from this list (randomly chosen) is drawn from a Poisson distribution with mean , where , is the total number of possible bonds and is the time window which was taken as the time step.
For the disassociation, the number of bonds to randomly break is drawn from a Poisson distribution with mean , where and is the number of existing bonds of type . In our procedure the probability of breaking a bond of type is proportional to . In the simulations we use which corresponds to as explained below. The translational diffusion time is with given by the Stokes-Einstein relation , where is the Boltzmann constant and is the solvent viscosity.
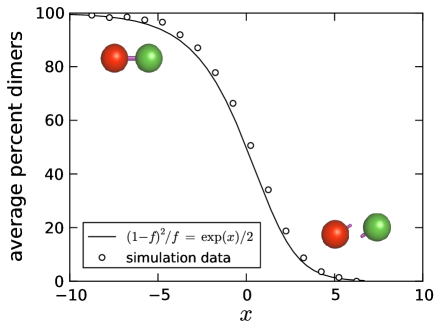
The melting curve for dimers as determined by simulation is shown in Fig. 2. For there are a very small number of dimers. This value corresponds to roughly the melting temperature of the dsDNA bond. As decreases the number of dimers increases until around where all possible bonds have formed. It is important to realize that for a given value of these systems enter a dynamic equilibrium where bonds are broken and reformed. The simulation data is qualitatively consistent with experimentally obtained curves Leunissen et al. (2009). One may derive an analytical expression to describe the data. The time evolution of the concentration of dimers is given by
| (2) |
With , where denotes the fraction of dimers, at steady state Eq. 2 becomes
| (3) |
Good agreement is found between the simulation data and Eq. 3 as shown in Fig. 2. Note that the melting curve in Fig. 2 is for dimers at a given value of and it does not necessarily apply to the systems described below. Additional details of our model and simulation methodology are given in the Supplemental Material (SM) sup .
III Results
Consider a simple mesostructure where the particles are arranged on the vertices of a cube. The most complicated and robust design would be to encode each bond with a unique pair of complementary DNA strands leading to 12 complementary pairs and 8 particle types (Design 1 in Fig. 3(a)). We can use the underlying symmetry of the target structure to reduce the number of unique DNA sequences and particle types. This process resulted in 5 different designs with gradually reducing complexity as shown in Fig. 3(a).
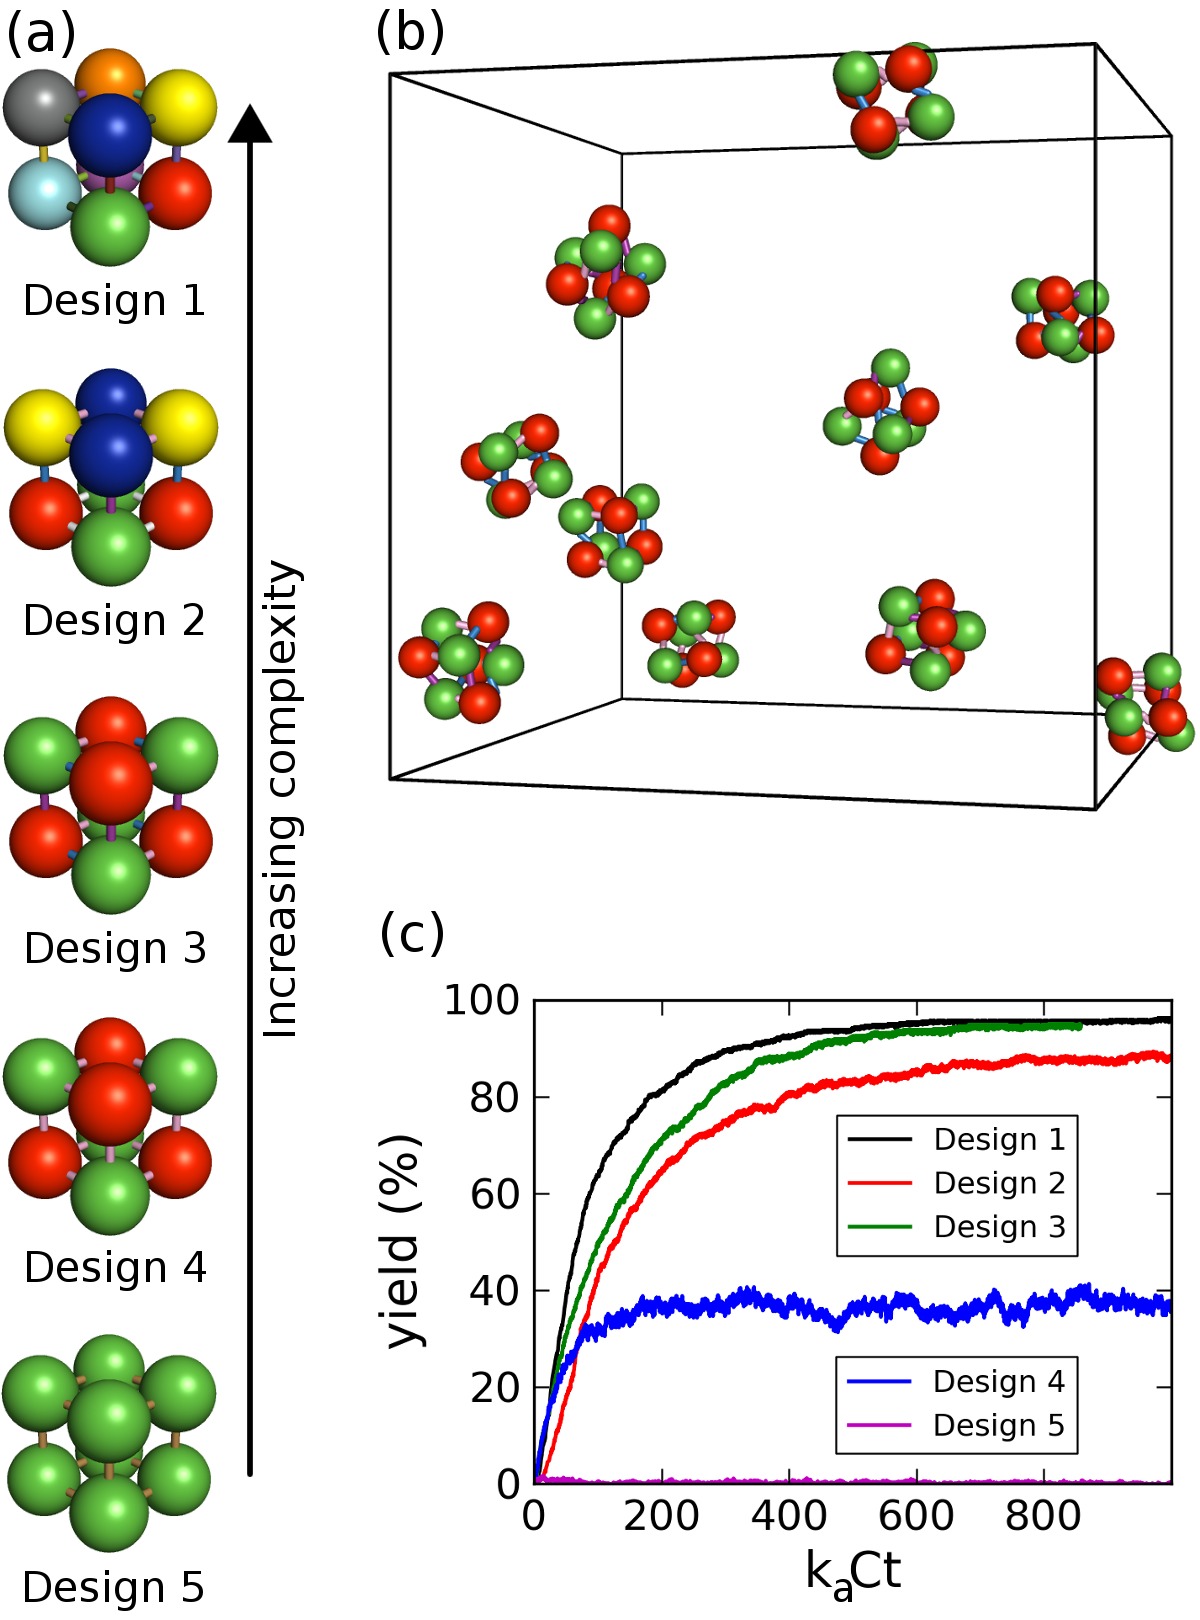
Simulations have been conducted to study the self-assembly of each of the five cube designs. At initialization, the particles are assigned random positions and orientations. The value for each bond in each design was the same with for Designs 1–5, respectively. The value of varies between designs because the concentration of bond types is different for each design. The percent yield is shown in Fig. 3, where the yield is defined as the number of mesostructures perfectly formed, with all particles and bonds in place, divided by the total number of expected mesostructures. Designs 1–3 lead to cubes in high yield. While Design 3 has only 3 unique complementary pairs it leads to the same yield and fast kinetics as the design with 12 pairs (see Video 1 of SM sup ). Design 4 is produced in a yield of just less than 40%, and Design 5 leads to the formation of tetrahedra and 6-particle clusters in high yield with essentially no cubes. The standard deviation in the final yield was less than 3% for all designs except Design 4 which was approximately 7%. From the experimental point of view, Design 3 is optimal because it requires the fewest number of unique DNA sequences to produce the target cluster quickly and in near perfect yield.
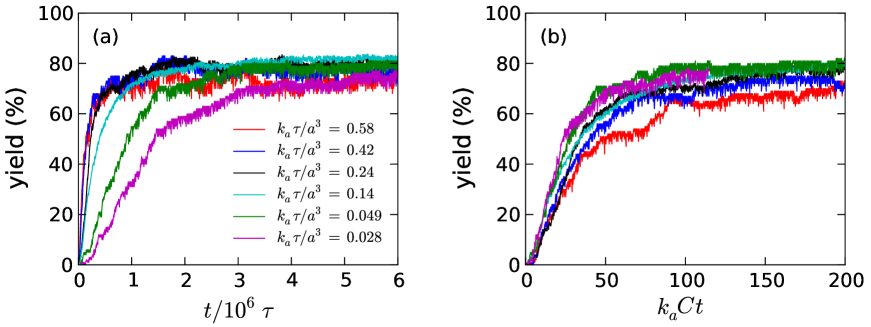
We have investigated the effect of the DNA hybridization rate on the self-assembly of cubes with Design 3. For a given choice of there is a corresponding value of . To determine these values we conducted simulations of the self-assembly of dimers with . By choosing to prevent disassociation, can be obtained as the initial slope of a plot of versus . For instance, with , we find , respectively. The yield of cubes as a function of time for six values of is shown in Fig. 4(a). All cases give an equilibrium yield of roughly 65% with the time required to reach equilibrium decreasing with increasing . In Fig. 4b the yield is plotted against . While spans a wide range, the data sets are found to mostly collapse onto a master curve indicating that the characteristic time scale for these systems is . The exception to this behavior is the curve with the largest value of . In the simulations we use , and its corresponding value of , because the structures form fast with this choice and the overall yield is the same as for smaller values.
One expects to be less than but within an order of magnitude of the association rate constant of free DNA . If an experimental value were used for one would expect the same results but the simulations would have to be run for much longer. For instance, Tsuruoka et al. Tsuruoka et al. (1996) reported a value of of roughly s-1M-1 which corresponds to . Chen et al. Chen et al. (2007) report for complementary strands with 21 bases a value of s-1M-1. Hence, in real experiments, a rough estimate of the characteristic time scale is s, which indicates that the cubes form in roughly 4 hours.
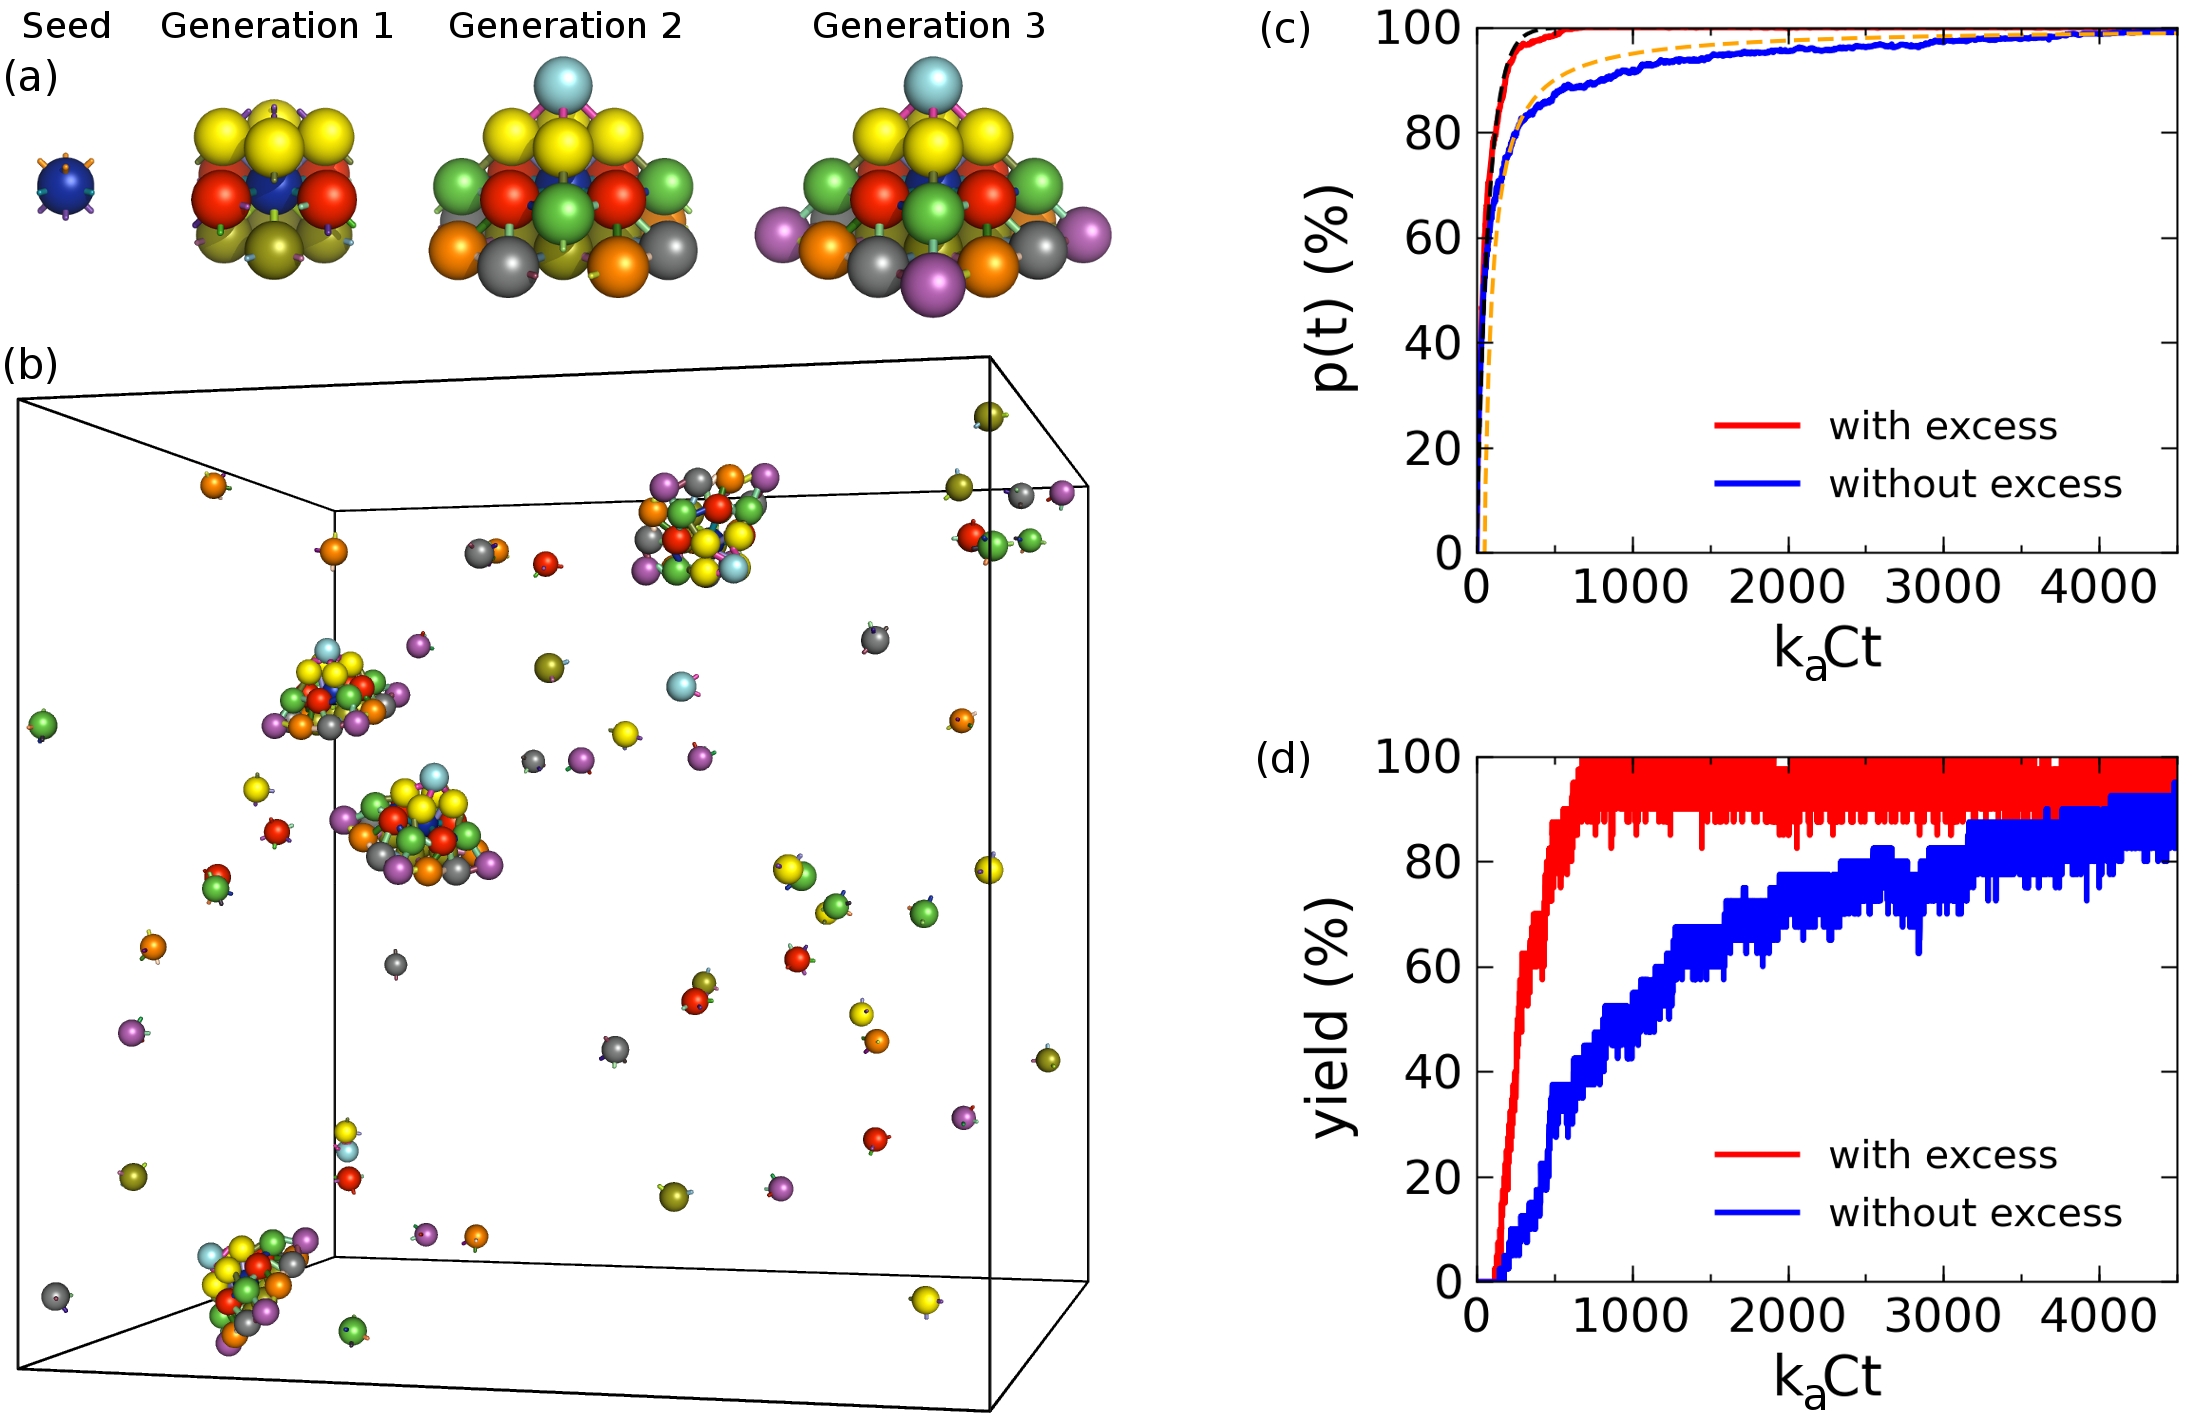
To fabricate structures more complicated than cubes it becomes important to employ a strategy that controls both the process of nucleation and growth. Ideally, one wants to operate in the regime where the number of nucleation sites or dynamically-growing clusters matches the total number of expected mesostructures, with all other particles remaining unbound until joining a cluster. Such conditions can very nearly be realized by forming the mesostructure in a generation-by-generation manner as illustrated for a pyramid in Fig. 5(a). The success of this design strategy, which is described in detail below, is demonstrated in Fig. 5(b) where the pyramids are shown to self-assemble in perfect yield (see Video 2 of SM sup ). Simulations have been conducted when the system composition corresponds to exactly four pyramids and when excess particles (not seed) are present. Aside from the immediate application of symmetry, the design of the pyramid was arrived at through an iterative process where the number of bonds and -values were refined until the structures formed quickly and without errors (see SM for details). Over the course of this study a general design strategy became apparent. This strategy, which is applicable to all the mesostructures described here, is given below.
For typical values, the bonds between the NPs in a fully formed mesostructure are continually breaking and reforming. For large structures where it is very likely that at least one bond will be broken at time , our previous definition of the yield is replaced by , where is the number of particles in the dynamically-growing cluster, is the number of seed particles, and the brackets denote an average over all clusters. Fig. 5(c) and (d) show the yield of pyramids using both definitions. The standard deviation in at equilibrium is essentially zero for the case with excess particles and approximately 2% for the case without.
When the clusters are in an intermediate state of growth, a simple description of the time evolution of the concentration of particles of type that have yet to join the clusters is
| (4) |
where is the concentration of excess particles and . For the concentration of vacancies decays slowly as a power law, , while adding excess particles leads to sharper exponential relaxation, . Good agreement is found when these expressions are used to fit the data in Fig. 5(c). In real experiments the pyramids are predicted to form in roughly 1 hour.
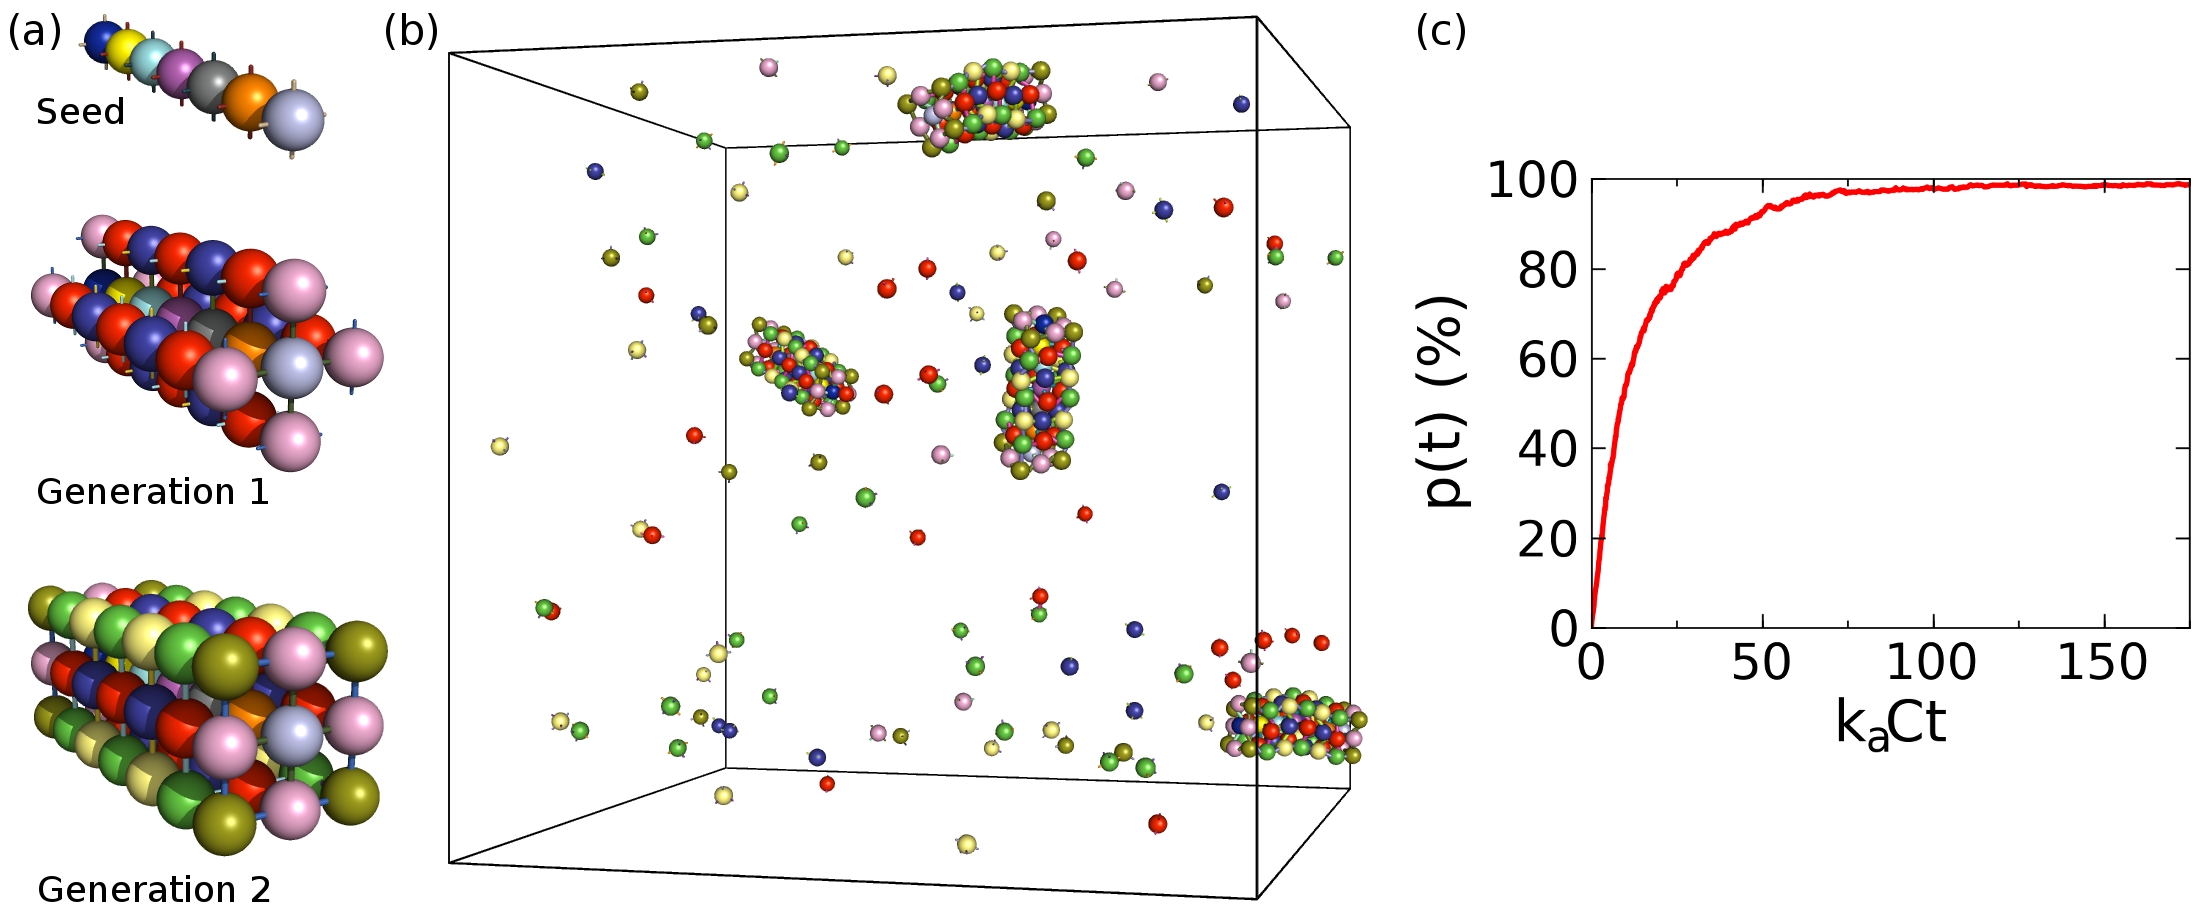
While symmetry is helpful in reducing the design complexity, there are many finite-size objects with a repeating motif which lack symmetry in a strict mathematical sense. For instance, in the 7-layer box structure shown in Fig. 6(a), the translational symmetry is broken due to its finite size. Does this imply that each of the layers has to be built out of a distinct set of particles? In the proposed design, we avoided this by using a linear seed made of 7 distinct particles. The seed effectively encodes the size and 1D coordinate along the cluster. The rest of the box (56 particles) is built around the seed with only 6 distinct particle types. This means that the length of the structure can be increased with a minimal increase in the number of particle types. While the cubes and pyramids form at a single temperature, the linear seed of the box forms at, for example, room temperature with the remaining particles joining at a lower temperature (). Boxes are produced in near perfect yield as shown in Fig. 6(b) and (c). The standard deviation in the final value of was 2%.
When dfNPs are synthesized in the laboratory it is likely that there will be slight errors in the positions of the DNA strands. To investigate the effect of these anticipated errors, simulations using Design 3 for the cubes were carried out with particles that had each of their surface sites randomly displaced. The sites were randomly rotated along the particle surface by two angles about orthogonal axes each according to a Gaussian distribution with mean and standard deviation . The yield of cubes was found to be higher than 75% for values of up to and then drop to around 60% for and around 20% for . For a particle with a 10 nm diameter a displacement along the surface by is an arc length of about 1 nm or 20% of the radius. However, even with such a fairly large error the yield is still high.
We have examined the robustness of our results to variations in the excluded volume parameters ( and ), average bond length () and spring constant (). The simulations were conducted at with for the cubes with Design 3 and for the pyramids with excess particles. The baseline values were , , and . We found that the cubes and the pyramids still form in high yield (%) with variations in up to %, in up to %, in up to % and in from to %. These values suggest that our findings are quite robust and not sensitive to the details of the model.
IV Discussion and Conclusions
While the early mesostructure designs were done in a trial-and-error manner, over the course of this work a general procedure applicable to a wide range of mesostructures emerged. The key elements to our design strategy for dfNP systems are summarized below:
I. Symmetry – The complexity of the system can be reduced by taking advantage of symmetry, subject to two limitations: (i) neighbors have to be of different types and (ii) all bonds for a given particle should be encoded by different sequences. While the use of this simple rule is best illustrated by the cubes, all mesostructures were designed by using symmetry to minimize the number of unique bond types.
II. Controlled nucleation – For the advanced mesostructures, the number of nucleation sites is controlled by using a seed structure. For the pyramid this was a single particle while for the box it was a linear chain. Particles in the seed structure form strong bonds to particles in the first generation. This can be accomplished experimentally by using DNA sequences with a high CG content. The pyramids form at a single temperature. For the box, the dfNPs are designed such that only the seed forms at a higher temperature (e.g., room temperature) by using a high CG content in the bonds. When the temperature is lowered by a few degrees the bonds in the outer generations become strong enough to form.
III. Cooperative binding – The pyramid and box mesostructures self-assemble in a generation-by-generation manner. Once the first generation has formed, particles in higher generations can easily add to the cluster because forming multiple bonds with the particles that are already in place is energetically favorable whereas dimer formation is not. This can be understood by considering a green particle in Generation 2 of the pyramid (see Fig. 5(a)). When an unbound green particle encounters either an unbound red or yellow particle it can form at most one bond which will break at some later time because bonds are not permanent as indicated by Eq. 1. However, when Generation 1 is in place and a green particle bonds to either a red or yellow particle it is very likely to form two additional bonds which will keep it in place. Note that generation-by-generation growth of the cluster occurs locally. That is, it is not necessary for all the particles in the first generation to be in place before a particle in the second generation can join.
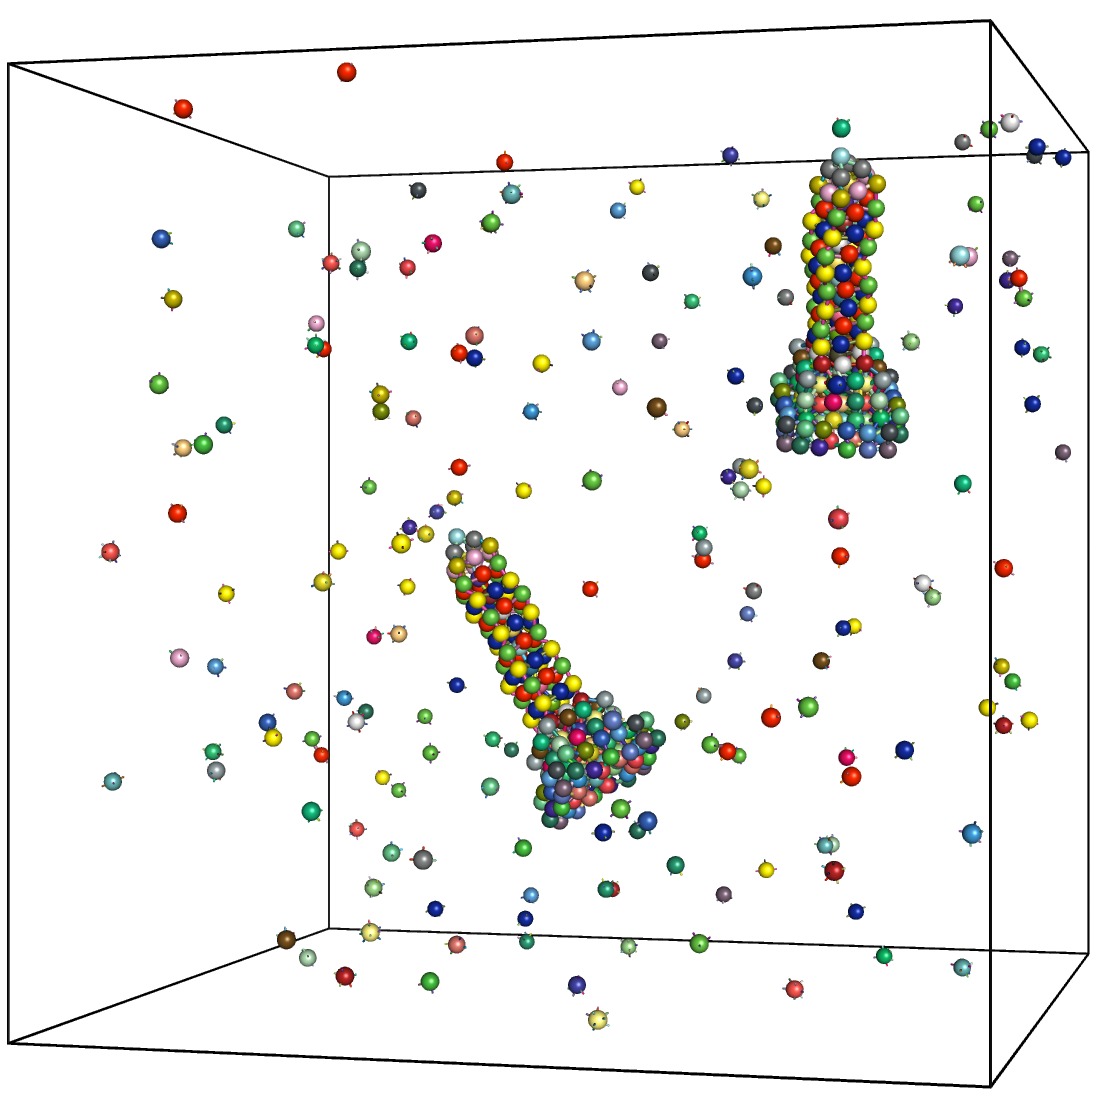
We have demonstrated that dfNPs can be designed to self-assemble into a variety of finite mesoscopic structures, each with a programmed local morphology and complex overall shape. Importantly, this approach avoids unwanted metastable configurations during the self-assembly process which allows the mesostructures to form on a time scale that is practical for nanomanufacturing. While additional design strategies may be needed as more advanced mesostructures are sought, the approach presented here has proven to be sufficient for a wide range of structures. To illustrate this, we have designed and demonstrated the successful self-assembly of an Empire State Building model composed of 210 dfNPs (51 types) as shown in Fig. 7 (see Video 3 of SM sup ). While it is unlikely that such a structure will be realized experimentally in the near future, it serves as a remarkable demonstration of the potential of NP-DNA self-assembly with directional bonding. The ability to produce objects with complicated programmed architecture, in a parallel and nearly error-free manner, can eventually lead to a great variety of practically important applications in the fields of metamaterials, nanoplasmonics Fan et al. (2010) and nanomedicine.
This work benefited from discussions with O. Gang, M. Hybertsen, W. Sherman, P. Chaikin, K.-T. Wu and G. S. Grest. Research carried out in whole at the Center for Functional Nanomaterials, Brookhaven National Laboratory, which is supported by the U.S. Department of Energy, Office of Basic Energy Sciences, under Contract No. DE-AC02-98CH10886.
References
- Mirkin et al. (1996) C. Mirkin, R. Letsinger, R. Mucic, and J. Storhoff, Nature 382, 607 (1996).
- Alivisatos et al. (1996) A. Alivisatos, K. Johnsson, X. Peng, T. Wilson, C. Loweth, M. Bruchez, and P. Schultz, Nature 382, 609 (1996).
- Nykypanchuk et al. (2008) D. Nykypanchuk, M. M. Maye, D. van der Lelie, and O. Gang, Nature 451, 549 (2008).
- Park et al. (2008) S. Y. Park, A. K. R. Lytton-Jean, B. Lee, S. Weigand, G. C. Schatz, and C. A. Mirkin, Nature 451, 553 (2008).
- Macfarlane et al. (2011) R. J. Macfarlane, B. Lee, M. R. Jones, N. Harris, G. C. Schatz, and C. A. Mirkin, Science 334, 204 (2011).
- Kim et al. (2006) A. Kim, P. Biancaniello, and J. Crocker, Langmuir 22, 1991 (2006).
- Leunissen et al. (2009) M. E. Leunissen, R. Dreyfus, R. Sha, T. Wang, N. C. Seeman, D. J. Pine, and P. M. Chaikin, Soft Matter 5, 2422 (2009).
- Kim et al. (2009) A. J. Kim, R. Scarlett, P. L. Biancaniello, T. Sinno, and J. C. Crocker, Nature Materials 8, 52 (2009).
- Scarlett et al. (2011) R. T. Scarlett, M. T. Ung, J. C. Crocker, and T. Sinno, Soft Matter 7, 1912 (2011).
- Rogers and Crocker (2011) W. B. Rogers and J. C. Crocker, PNAS 108, 15687 (2011).
- Tkachenko (2002) A. V. Tkachenko, Phys. Rev. Lett. 89, 148303 (2002).
- Hsu et al. (2010) C. W. Hsu, F. Sciortino, and F. Starr, Phys. Rev. Lett. 105, 055502 (2010).
- Martinez-Veracoechea et al. (2011) F. J. Martinez-Veracoechea, B. M. Mladek, A. V. Tkachenko, and D. Frenkel, Phys. Rev. Lett. 107, 045902 (2011).
- Knorowski et al. (2011) C. Knorowski, S. Burleigh, and A. Travesset, Phys. Rev. Lett. 106, 215501 (2011).
- Padovan-Merhar et al. (2011) O. Padovan-Merhar, F. V. Lara, and F. W. Starr, J. Chem. Phys. 134, 244701 (2011).
- Angioletti-Uberti et al. (2012) S. Angioletti-Uberti, B. M. Mognetti, and D. Frenkel, Nature Materials 11, 518 (2012).
- Licata and Tkachenko (2008) N. A. Licata and A. V. Tkachenko, Europhys. Lett. 84, 20010 (2008).
- Meng et al. (2010) G. Meng, N. Arkus, M. P. Brenner, and V. N. Manoharan, Science 327, 560 (2010).
- Hormoz and Brenner (2011) S. Hormoz and M. P. Brenner, Proc. Natl. Acad. Sci. USA 108, 5193 (2011).
- Tkachenko (2011) A. V. Tkachenko, Phys. Rev. Lett. 106, 255501 (2011).
- Suzuki et al. (2009) K. Suzuki, K. Hosokawa, and M. Maeda, J. Am. Chem. Soc. 131, 7518 (2009).
- Kim et al. (2011) J.-W. Kim, J.-H. Kim, and R. Deaton, Angew. Chem. Int. Ed. 50, 9185 (2011).
- Wang et al. (2012) Y. Wang, Y. Wang, D. R. Breed, V. N. Manoharan, L. Feng, A. D. Hollingsworth, M. Weck, and D. J. Pine, Nature 491, 51 (2012).
- Winfree et al. (1998) E. Winfree, F. Liu, L. Wenzler, and N. Seeman, Nature 394, 539 (1998).
- Barish et al. (2009) R. D. Barish, R. Schulman, P. W. K. Rothemund, and E. Winfree, PNAS 106, 6054 (2009).
- Rothemund (2006) P. Rothemund, Nature 440, 297 (2006).
- Glotzer and Solomon (2007) S. C. Glotzer and M. J. Solomon, Nature Materials 6, 557 (2007).
- Ke et al. (2012) Y. Ke, L. L. Ong, W. M. Shih, and P. Yin, Science 338, 1177 (2012).
- Park et al. (2006) S. H. Park, C. Pistol, S. J. Ahn, J. H. Reif, A. R. Lebeck, C. Dwyer, and T. H. LaBean, Angew. Chem. Int. Ed. 45, 735 (2006).
- (30) See Supplemental Material at http://link.aps.org/supplemental/10.1103/PhysRevE.87.062310 for the detailed simulation methodology and animations of the self-assembly of cubes, pyramids and the Empire State Building model. An animation which summarizes the work is available on YouTube: http://www.youtube.com/watch?v=iKk6mEUimic.
- Tsuruoka et al. (1996) M. Tsuruoka, K. Yano, K. Ikebukuro, H. Nakayamab, Y. Masudab, and I. Karube, J. Biotechnology 48, 201 (1996).
- Chen et al. (2007) C. Chen, W. Wang, Z. Wang, F. Wei, and X. S. Zhao, Nucleic Acids Research 35, 2875 (2007).
- Fan et al. (2010) J. A. Fan, C. Wu, K. Bao, J. Bao, R. Bardhan, N. J. Halas, V. N. Manoharan, P. Nordlander, G. Shvets, and F. Capasso, Science 328, 1135 (2010).