Strontium and Barium In Early-Type Galaxies
Abstract
The detailed abundance patterns of the stars within galaxies provide a unique window into the history of star formation (SF) at early times. Two widely used ‘chronometers’ include the and iron-peak elements, which are created on short and long timescales, respectively. These two clocks have been widely used to estimate SF timescales from moderate-resolution spectra of early-type galaxies. Elements formed via -process neutron captures (e.g., Sr and Ba) comprise a third type of chronometer, as the site of the main -process is believed to be intermediate and low-mass asymptotic giant branch stars. The [/Ba] ratio in particular should provide a powerful new constraint on the SF histories of galaxies, in part because it is insensitive to the uncertain distribution of Type Ia SNe detonation times and the overall Ia rate. Here we present new measurements of the abundance of Sr and Ba in nearby early-type galaxies by applying stellar population synthesis tools to high S/N optical spectra. We find a strong anti-correlation between [Mg/Fe] and [Ba/Fe], and a strong positive correlation between [Mg/Ba] and galaxy velocity dispersion. These trends are consistent with the idea that more massive galaxies formed their stars on shorter timescales compared to less massive galaxies, and rule out several other proposed explanations for the observed super-solar [Mg/Fe] values in massive galaxies. In contrast, [Sr/Fe] , with no strong variation across the sample. It is difficult to interpret the Sr trends without detailed chemical evolution models owing to the multiplicity of proposed nucleosynthetic sites for Sr.
Subject headings:
galaxies: stellar content — galaxies: abundances — galaxies: elliptical and lenticular, cD1. Introduction
While it is clear that the majority of massive early-type galaxies formed the bulk of their stars at , the precise nature and duration of star formation in these galaxies has proven difficult to constrain. The difficulty arises from the fact that the main sequence turnoff point varies little with age at late times, implying that the integrated spectral energy distribution varies little with age at late times. For old stellar systems such as early-type galaxies, it has become common to instead rely on elemental abundance ratios to probe the star formation histories at early times (e.g., Worthey et al., 1992; Thomas et al., 2005). The classic example is the ratio of to iron-peak elements, [/Fe]111[X/Fe]log(X/Fe)log(X/Fe)⊙. The elements form mostly in massive stars, which evolve on short timescales, while iron-peak elements form mostly in Type Ia supernovae (SNe), which occur on longer timescales. The [/Fe] ratio is thus a sensitive probe of SF on yr timescales (e.g., Tinsley, 1979; Thomas et al., 1998).
One of the principal difficulties in using [/Fe] to measure a SF timescale is the unknown Type Ia SNe delay time distribution. Other difficulties include the possibility that the overall Ia rate varies in some systematic way with galaxy properties, the possibility of selective mass-loss such that Fe is preferentially lost from the system, and potential variation in the initial mass function (Worthey et al., 1992; Thomas et al., 1999; Trager et al., 2000). A promising alternative chronometer is Ba, which is believed to form predominately within the envelopes of asymptotic giant branch stars via -process neutron captures (Burbidge et al., 1957; Busso et al., 1999; Herwig, 2005). The precise mass-dependent yields of Ba are presently not well-known, but there is hope that progress on this topic can be made in the near-term (in contrast to the delay time distribution for Ia’s, which appears to be governed largely by the initial conditions of stellar binarity). The prospects for measuring Ba in the integrated light spectra of galaxies are favorable owing to the strong transitions of Ba ii in the blue spectral region.
Sr is another neutron capture element with strong transitions in the blue. Like Ba, Sr is predominantly produced by the -process, at least in the solar system. These two elements probe two of the three -process peaks, with Sr belonging to the first (along with Y and Zr), and Ba belonging to the second (along with La, Ce, Pr, and Nd). While the nucleosynthetic origin of Ba is relatively secure, the same cannot be said for the elements in the first -process peak (Couch et al., 1974; Woosley & Hoffman, 1992; Raiteri et al., 1993; Sneden et al., 2008). Indeed, current chemical evolution models of the Galaxy are unable to reproduce the observed behavior of Sr-Y-Zr at low metallicity without appealing to exotic and/or ad hoc nucleosynthetic sites (e.g., Travaglio et al., 2004; Qian & Wasserburg, 2008). Perhaps the [Sr/Ba] ratios in metal-rich massive galaxies will provide some insight into this problem.
In this Letter we employ our new stellar population synthesis (SPS) model to interpret high quality optical spectra of early-type galaxies in order to constrain the abundances of Sr and Ba. In Sections 2 and 3 we describe the model and data, and in Section 4 we present our results.
2. Model
The SPS model used herein was developed in Conroy & van Dokkum (2012a, CvD12). The model adopts standard SPS techniques, including constructing libraries of isochrones and stellar spectra. Empirical spectra form the core of the model. The empirical stars are of approximately solar metallicity and have solar abundance patterns. We computed a large grid of model stellar atmospheres and spectra in order to construct response functions (i.e., the relative change in the spectrum of a star due to a change in the abundance of a single element). The model atmospheres and spectra were computed with the ATLAS model atmosphere and spectrum synthesis package (Kurucz, 1970, 1993), ported to Linux by Sbordone et al. (2004). Specifically, we use the ATLAS12 code, computing new atmospheres for each change in abundance pattern. The line list was provided by R. Kurucz222kurucz.harvard.edu/, including linelists for TiO and H2O, amongst other molecules. The spectral response functions were applied to the empirical stellar spectra in order to create models with arbitrary abundance patterns. The model allows for arbitrary variation in the initial mass function (IMF) and spans ages from Gyr. See CvD12 for further details regarding the model.
We follow Conroy & van Dokkum (2012b) in fitting the model to data. In its present form the model contains 27 free parameters, including the redshift and velocity dispersion, a two-part power-law IMF, two population ages, four nuisance parameters, and the abundances of C, N, Na, Mg, Si, Ca, Ti, V, Cr, Mn, Fe, Co, Ni, Sr, Y, and Ba, and O,Ne,S are varied in lock-step. These parameters are fit to the data via a Markov Chain Monte Carlo fitting technique. The data and models are split into four wavelength intervals (defined in the following section) and, within each interval the spectra are normalized by a high-order polynomial (with degree where Å; see Conroy & van Dokkum, 2012b, for details). We have masked the spectral regions surrounding the H, [N ii], [S ii], H, [O iii], and [N i] emission lines.
The effective resolution of the data varies from owing to intrinsic Doppler broadening. Both because of this low resolution and the fact that in our model the synthetic spectra are only used differentially, several uncertainties associated with abundance analysis at high resolution (including the adopted microturbulent velocity, treatment of convection, non-LTE effects, and hyperfine splitting of certain levels) are mitigated to some extent herein. Moreover, Bergemann et al. (2012) has demonstrated that the strong Sr ii line at 4077Å suffers from negligible non-LTE corrections at [Fe/H]. Of course when working at low resolution one is more dependent on the fidelity of the model than the case where equivalent widths of individual unsaturated lines are directly measured from the data.
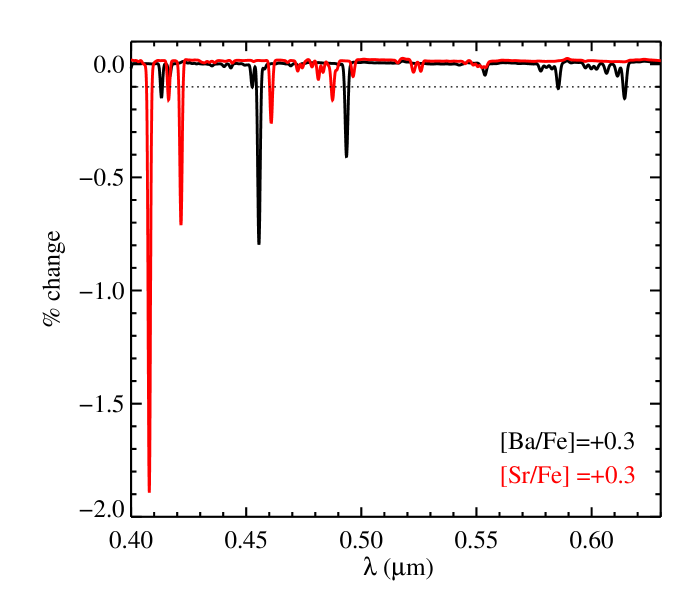
As an example of what can be measured from low resolution spectra, in Figure 1 we show the change in the model spectrum due to a 0.3 dex increase in the [Sr/Fe] and [Ba/Fe] abundance ratios (holding [Fe/H] fixed to the solar value). The reference model is for an age of 13 Gyr, with a Galactic (Kroupa, 2001) IMF, and for solar metallicity. The model was convolved with a velocity dispersion of . Notice that even at this low resolution, at least two Sr ii lines and two Ba ii lines produce a change in the spectrum of % per 0.3 dex change in abundance. As we will demonstrate in Section 4, the existence of multiple, well-separated Sr and Ba lines allows us to test the robustness of our results in a relatively model-independent fashion.
3. Data
In this Letter we consider two samples of early-type galaxies. The first sample of 34 early-type galaxies (and the nuclear bulge of M31) was presented in van Dokkum & Conroy (2012). The sample was selected from the SAURON survey of nearby galaxies (Bacon et al., 2001). High S/N spectra of these objects were obtained with the Low Resolution Imaging Spectrometer (LRIS) on the Keck I telescope. The wavelength coverage spans the range ÅÅ with a gap at ÅÅ. Four wavelength intervals were defined, , , , and for fitting models to data. The wavelength choices reflect the limitations of the model and data wavelength coverage and regions of severe telluric corrections. The S/N at 5000Å varies from Å-1 to Å-1. Spectra were extracted within , with a weighting intended to mimic a circular aperture, where is the effective radius. These data have already been compared to the CvD12 models in Conroy & van Dokkum (2012b, see the Appendix of that paper for a comparison of the best-fit models and data for each of the 35 LRIS galaxies). In that earlier work, we did not consider variation in Sr and Ba, and only briefly commented on the abundances of the other elements considered in the fit. We found that the ages, [Fe/H] and [Mg/Fe] values derived with our full spectrum fitting technique agreed with conventional Lick index-based techniques.
The second source of data is provided by the Sloan Digital Sky Survey (SDSS; York et al., 2000). Following the methodology outlined in Graves et al. (2009), we have selected a sample of galaxies within a narrow redshift interval of , with no detected emission in H nor in [O ii], and with concentrated, de Vaucouleurs-like light profiles. The SDSS obtains spectra with fibers that have 3” diameters. The typical S/N of SDSS spectra in our sample is modest, of order 20 Å-1, and so we have chosen to stack the spectra in seven bins of velocity dispersion with mean dispersions in each bin of 88, 112, 138, 167, 203, 246, and 300. For the smallest sigma bin the SDSS fiber samples the inner , while for the most massive bin the fiber samples the inner . We have verified that our results do not change if we select galaxies within each bin such that the fiber samples the same fraction of . Each spectrum was continuum-normalized and convolved to an effective dispersion of before stacking, and each spectrum contributed equally to the stack. The resulting S/N of the stacked spectra at 5000Å ranges from Å-1 to Å-1. As with the LRIS data, four wavelength intervals were defined for the SDSS stacks, , , , and for fitting models to data. These stacked data will be the focus of future work aimed at measuring the detailed abundance patterns as a function of galaxy properties. In this work we limit our attention to the neutron capture elements Sr and Ba.
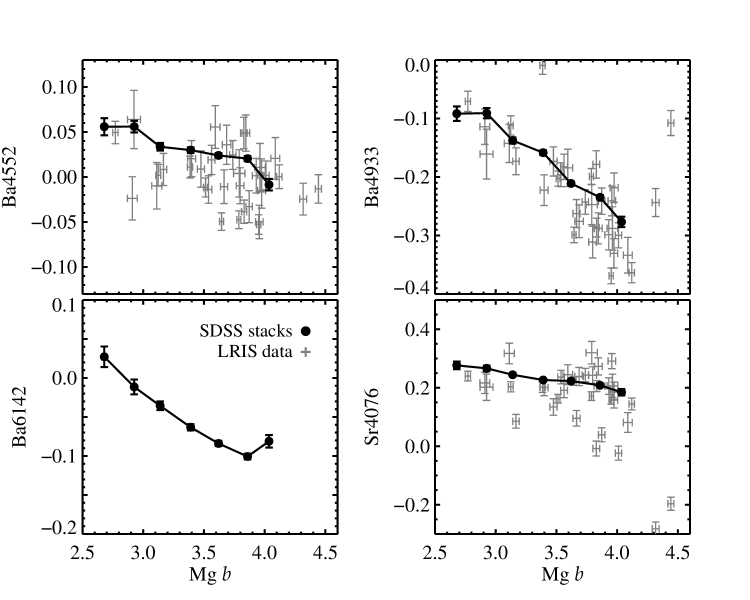
As a first look at the data, in Figure 2 we show spectral indices for both the SDSS stacked spectra and the individual LRIS galaxies. The Mg b index is sensitive to Mg, while the other indices are sensitive to Ba and Sr lines (with central wavelengths indicated by the index name). The Br and Sr indices are defined in Serven et al. (2005), while the Mg b index is defined in Worthey et al. (1994, no effort was made to place the latter on the Lick index scale). For this figure, the LRIS data were convolved to a common dispersion of in order to afford a direct comparison with the SDSS stacked spectra. The LRIS data do not cover the 6142Å spectral region. Overall the agreement between the LRIS and SDSS samples is encouraging, given the very different observational setups and reduction techniques. It is however difficult to interpret spectral indices because an index is in general sensitive not only to the feature of interest but also to features contributing to the sidebands (i.e., the index measures a feature strength relative to a pseudocontinuum). This is especially true when the feature of interest is weak compared to other features. Full spectrum fitting such as the kind performed in the present work does not suffer from this drawback.
4. Results
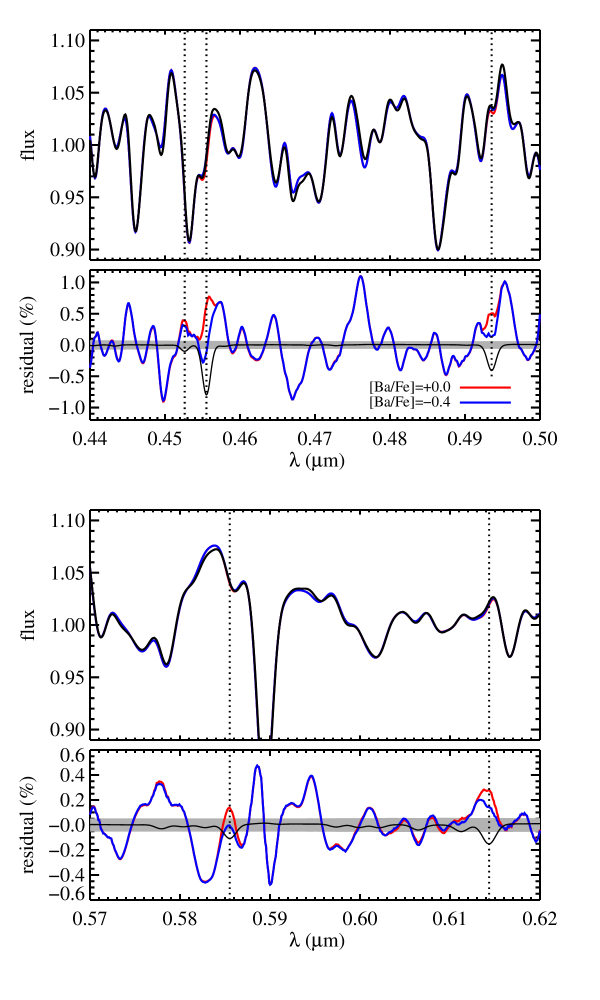
Before showing the derived abundance trends, in Figure 3 we explore the quality of the fit around the Ba ii lines for the stacked SDSS spectrum in the second highest bin. In the figure we compare two model fits, one in which [Ba/Fe] and another in which the Ba abundance is allowed to vary in the fit (with a resulting best-fit value of [Ba/Fe]). We also mark the locations of the strongest Ba ii lines in this spectral region. It is noteworthy that the residuals decrease in all spectral regions sensitive to Ba. This is an important test of the results to follow because it is also evident from this figure that there are numerous places where the residuals exceed the formal S/N limits of the data (demarcated by the grey band). If there were only one strong Ba line then it would have been difficult to argue that a region of high residual required non-solar [Ba/Fe] values. We return to this point later in this section.
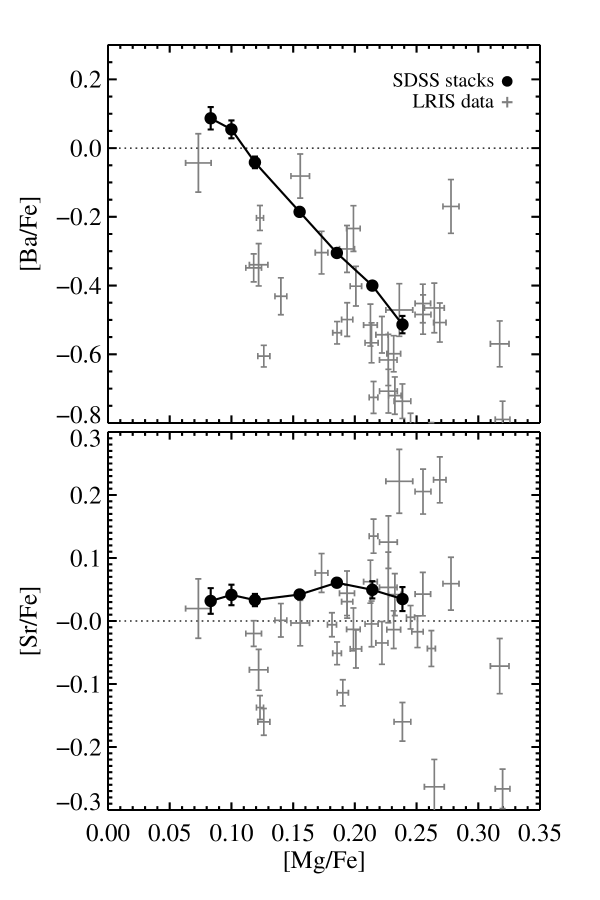
Our main result is shown in Figure 4. In this figure we show the best-fit [Ba/Fe] and [Sr/Fe] abundance ratios as a function of [Mg/Fe]. We include both the stacked SDSS spectra and the LRIS spectra of individual galaxies. The formal statistical errors from the SDSS stacks are very small owing to the very high S/N of the spectra. It is encouraging that the LRIS data and SDSS stacks follow the same general trends of decreasing [Ba/Fe] and constant [Sr/Fe] with increasing [Mg/Fe]. Such low values of [Ba/Fe] are not uncommon amongst metal-poor halo stars in the Galaxy (Sneden et al., 2008). Indeed, below [Fe/H] essentially all halo stars have [Ba/Fe], with many stars having Ba abundances as low as [Ba/Fe] (François et al., 2007). Such stars are also enhanced, and have [Sr/Ba], again broadly consistent with the mean abundance ratios of the massive early-type galaxies (although with very different overall metallicities).
Taken at face value, the [Ba/Fe] versus [Mg/Fe] trends are consistent with the standard interpretation of [Mg/Fe] probing the SF timescale in these galaxies. A shorter timescale should lead to higher [Mg/Fe] and lower [Ba/Fe] values, as observed. Although not shown, the SDSS data also display a strong correlation between [Mg/Ba] and . The derived [Fe/H] values range from to over the SDSS early-type sample, and so the trends observed in Figure 4 are unlikely to be due to metallicity-dependent yields. Other explanations for the [Mg/Fe] relation have been proposed, including a varying IMF, varying SN Ia rate, and selective mass-loss of SN Ia ejecta (Worthey et al., 1992; Thomas et al., 1999; Trager et al., 2000). The [Mg/Ba] data allow us to rule out the explanations that are particular to the Ia’s, since the Ia’s influence neither Mg nor Ba, but it cannot discriminate between a varying SF timescale and a varying high-mass IMF for the observed variation in [Mg/Fe] with .
The near constancy of [Sr/Fe] is puzzling. It has been suggested that Sr may have multiple nucleosynthetic origins, including the -process, both the weak and main -processes, and perhaps even hypernovae (Raiteri et al., 1993; Travaglio et al., 2004; Qian & Wasserburg, 2008). As [Mg/Fe] (and presumably the SF timescale) varies, then perhaps the main nucleosynthetic site varies in such a way as to keep a rough constancy in [Sr/Fe]. With detailed chemical evolution models constrained to match the observed [Mg/Fe] and [Ba/Fe] trends, it may be possible to place interesting constraints on the origin(s) of Sr in these massive galaxies.
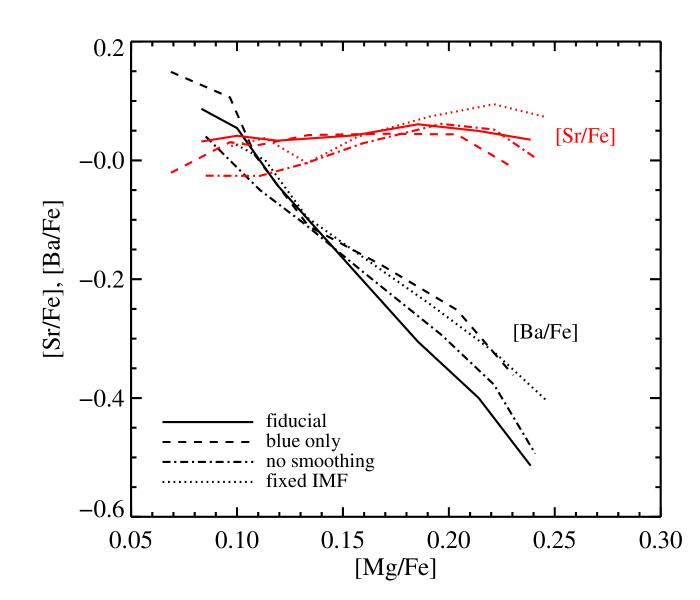
We turn now to several tests that have been performed to assess the robustness of these results. In Figure 5 we show the same abundance trends as before, for only the SDSS stacked spectra, and for a variety of permutations to the fiducial model. We consider a model in which the IMF is held fixed to the Galactic (Kroupa, 2001) form, a model in which only the blue (Å) spectral region is fit, and a model in which the SDSS stacks are not smoothed to a common resolution of . The latter is a particularly important test because much more information is available in the low dispersion bins, which effectively have higher spectral resolution, compared to the high dispersion bins. Relatedly, when the data are not broadened to , the associated response functions (Figure 1) become much stronger. The derived abundance ratios vary between these model permutations by dex, but the overall qualitative trends are clearly robust to these details. We have also masked each of the two strongest Ba ii lines (one at a time) and refit the models to the data. The resulting [Ba/Fe] versus [Mg/Fe] trends are unaltered, although in the case of masking the Ba ii 4555Å line the overall [Ba/Fe] abundances shift lower by dex. This highlights that while trends appear to be robust in our analysis, there are zero-point uncertainties at the dex level.
A concern is that the features we are trying to measure are much weaker than other metal lines. In fact, as shown in Figure 3 the expected Ba line strengths are similar to the typical systematic residual in the spectra after subtraction of our best-fit model! A robust test of our result is to randomly shuffle the central wavelengths of the strongest Ba ii lines and recompute around the shuffled lines. In practice, this is achieved by altering the response function for Ba (see Figure 1) by assigning random central wavelengths in the interval ÅÅ while keeping the relative strengths and widths of the lines the same. We have performed this test times for each of the SDSS stacked spectra. As an example of the results for the highest bin, the residuals decrease around the strongest shuffled Ba ii line in only % of the shuffled models when using the best-fit [Ba/Fe] value shown in Figure 4. Moreover, in none of the shuffled models do the residuals decrease in both of the two strongest shuffled Ba ii lines. In the four highest bins, where the best-fit [Ba/Fe] ratios are , the shuffled models are never able to reduce the residuals in all three of the strongest Ba ii lines. It is therefore highly unlikely that the derived [Ba/Fe] abundances are the result of a chance alignment between the strong Ba ii lines and spectral regions where the residuals happen to be high.
The elemental abundances derived herein should provide novel constraints on the duration of star formation in early-type galaxies once chemical evolution models that include yields from the - and -processes are employed. The [Mg/Ba] ratio is particularly promising because the derived timescale will not depend on the uncertain delay time distribution or overall rate of Type Ia SNe, in contrast to timescales derived from the [Mg/Fe] ratio. In future work, we will present detailed abundance patterns for elements, which promise to provide further insight into the early formation histories of these now dormant galaxies.
References
- Bacon et al. (2001) Bacon, R. et al. 2001, MNRAS, 326, 23
- Bergemann et al. (2012) Bergemann, M., Hansen, C. J., Bautista, M., & Ruchti, G. 2012, A&A, 546, A90
- Burbidge et al. (1957) Burbidge, E. M., Burbidge, G. R., Fowler, W. A., & Hoyle, F. 1957, Reviews of Modern Physics, 29, 547
- Busso et al. (1999) Busso, M., Gallino, R., & Wasserburg, G. J. 1999, ARA&A, 37, 239
- Conroy & van Dokkum (2012a) Conroy, C. & van Dokkum, P. 2012a, ApJ, 747, 69
- Conroy & van Dokkum (2012b) Conroy, C. & van Dokkum, P. G. 2012b, ApJ, 760, 71
- Couch et al. (1974) Couch, R. G., Schmiedekamp, A. B., & Arnett, W. D. 1974, ApJ, 190, 95
- François et al. (2007) François, P. et al. 2007, A&A, 476, 935
- Graves et al. (2009) Graves, G. J., Faber, S. M., & Schiavon, R. P. 2009, ApJ, 693, 486
- Herwig (2005) Herwig, F. 2005, ARA&A, 43, 435
- Kroupa (2001) Kroupa, P. 2001, MNRAS, 322, 231
- Kurucz (1970) Kurucz, R. L. 1970, SAO Special Report, 309
- Kurucz (1993) —. 1993, SYNTHE spectrum synthesis programs and line data, ed. Kurucz, R. L.
- Qian & Wasserburg (2008) Qian, Y.-Z. & Wasserburg, G. J. 2008, ApJ, 687, 272
- Raiteri et al. (1993) Raiteri, C. M., Gallino, R., Busso, M., Neuberger, D., & Kaeppeler, F. 1993, ApJ, 419, 207
- Sbordone et al. (2004) Sbordone, L., Bonifacio, P., Castelli, F., & Kurucz, R. L. 2004, Memorie della Societa Astronomica Italiana Supplementi, 5, 93
- Serven et al. (2005) Serven, J., Worthey, G., & Briley, M. M. 2005, ApJ, 627, 754
- Sneden et al. (2008) Sneden, C., Cowan, J. J., & Gallino, R. 2008, ARA&A, 46, 241
- Thomas et al. (1998) Thomas, D., Greggio, L., & Bender, R. 1998, MNRAS, 296, 119
- Thomas et al. (1999) —. 1999, MNRAS, 302, 537
- Thomas et al. (2005) Thomas, D., Maraston, C., Bender, R., & Mendes de Oliveira, C. 2005, ApJ, 621, 673
- Tinsley (1979) Tinsley, B. M. 1979, ApJ, 229, 1046
- Trager et al. (2000) Trager, S. C., Faber, S. M., Worthey, G., & González, J. J. 2000, AJ, 120, 165
- Travaglio et al. (2004) Travaglio, C., Gallino, R., Arnone, E., Cowan, J., Jordan, F., & Sneden, C. 2004, ApJ, 601, 864
- van Dokkum & Conroy (2012) van Dokkum, P. G. & Conroy, C. 2012, ApJ, 760, 70
- Woosley & Hoffman (1992) Woosley, S. E. & Hoffman, R. D. 1992, ApJ, 395, 202
- Worthey et al. (1992) Worthey, G., Faber, S. M., & Gonzalez, J. J. 1992, ApJ, 398, 69
- Worthey et al. (1994) Worthey, G., Faber, S. M., Gonzalez, J. J., & Burstein, D. 1994, ApJS, 94, 687
- York et al. (2000) York, D. G. et al. 2000, AJ, 120, 1579