The Radial Distribution of Star Formation in Galaxies at From the 3D-HST Survey
Abstract
The assembly of galaxies can be described by the distribution of their star formation as a function of cosmic time. Thanks to the WFC3 grism on HST it is now possible to measure this beyond the local Universe. Here we present the spatial distribution of H emission for a sample of 54 strongly star-forming galaxies at in the 3D-HST Treasury survey. By stacking the H emission we find that star formation occurred in approximately exponential distributions at , with median Sérsic index of . The stacks are elongated with median axis ratios of in H consistent with (possibly thick) disks at random orientation angles. Keck spectra obtained for a subset of eight of the galaxies show clear evidence for rotation, with inclination corrected velocities of 90 to 330 km/s. The most straightforward interpretation of our results is that star formation in strongly star-forming galaxies at generally occurred in disks. The disks appear to be ”scaled-up” versions of nearby spiral galaxies: they have EW(H )100Å out to the solar orbit and they have star formation surface densities above the threshold for driving galactic scale winds.
Subject headings:
galaxies: evolution — galaxies: formation — galaxies: high-redshift — galaxies: structure — galaxies: kinematics and dynamics — galaxies: star formation.
1. Introduction
Galaxy formation is a complex process, involving starbursts, mergers, and strong gas flows (e.g., Hopkins et al. 2006; Brooks et al. 2009; Dekel et al. 2009). Furthermore, stellar migration and secular processes can change the structure of galaxies at late times (e.g., Roškar et al. 2008; Grand, Kawata, & Cropper 2012). Therefore, even if we could perfectly locate and age date every star in the Milky Way, we still couldn’t say where and with what structural and kinematic properties those stars formed. The only way to establish where a galaxy’s stars formed, and hence how it was assembled, is to map the star formation while those stars were forming.
Obtaining H and stellar continuum maps of galaxies, with the kpc resolution necessary to put constraints on the spatial distribution of star formation, is challenging and has so far only been possible using a combination of adaptive optics and integral field units (IFUs) on 8–10 m class telescopes. These studies paint a complex picture: they find that star forming galaxies at are a mix of “puffy” and often clumpy rotating disks, mergers, and more compact dispersion-dominated objects (e.g., Genzel et al. 2008; Shapiro et al. 2008; Cresci et al. 2009; Förster Schreiber et al. 2009; Law et al. 2009; Jones et al. 2010; Mancini et al. 2011).
Some studies claim that there are trends in the structural properties of H as a function of redshift implying that the way galaxies assemble their stars varies fundamentally as a function of cosmic time. In particular, Epinat et al. (2009) and Kassin et al. (2012) suggest that galaxies become cooler and more rotation-dominated with time, being the epoch of “disk settling”. This is interesting because most of the stars in the disks of galaxies like the Milky Way were formed in this epoch.
It is now possible to obtain high spatial resolution ( kpc) information on H emission at with a high Strehl ratio, owing to the near-IR slitless spectroscopic capabilities provided by the WFC3 camera on the Hubble Space Telescope (HST). In Nelson et al. (2012) we used data taken as part of the 3D-HST survey to build on previous ground-based studies by mapping the H and stellar continuum with high resolution for a sample of 57 galaxies at and showed that star formation broadly follows the rest-frame optical light, but is slightly more extended. Here we stack the H maps of these galaxies to construct high signal-to-noise ratio (S/N) radial profiles and measure structural parameters of stellar continuum emission and star formation. These unique, high spatial resolution data from 3D-HST are combined with kinematics from the Near Infrared Spectrometer (NIRSPEC) on the W. M. Keck telescope (McLean et al. 1998) We assume H km s-1Mpc-1, , and .
2. 3D-HST And Sample Selection
The 3D-HST survey, a 248-orbit Treasury program on the Hubble Space Telescope, supplies the 2D emission line maps needed to measure the spatial distribution of star formation. The WFC3 G141 grism provides spatially resolved spectra of all sources in the field. The wavelength range of the G141 grism, m, covers the H emission line for galaxies in the redshift range . The survey also provides broad-band near-infrared imaging in the F140W filter, which samples the rest-frame band for . Using the same camera under the same conditions to map the both H and continuum emission allows us to compare their distributions directly, a crucial advantage of this strategy. The maps have a spatial sampling of 0.5 kpc at ( pixels). The data presented in this paper are based on the pointings, roughly half of the full data set, that were obtained prior to June 2011 see Nelson et al. (2012). The survey, data reduction, and determination of derived quantities (e.g. redshifts and masses) are described in Brammer et al. (2012) and van Dokkum et al. (2011).
The 3D-HST grism spectra have high spatial resolution and low spectral resolution () meaning that emission line structure reflects almost exclusively spatial structure (morphology) in contrast to data with high spectral resolution where structure reflects velocity (rotation or dispersion). Emission line maps of galaxies are made by subtracting the continuum emission from the two-dimensional spectrum. The details of the procedure are described in (Nelson et al. 2012; Lundgren et al. 2012; Schmidt et al. 2012 submitted)
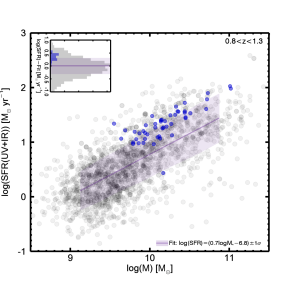
We selected galaxies with redshifts , total F140W AB magnitude , and rest-frame Å. We also limited the sample to galaxies with effectively no contaminating flux from the spectra of other nearby objects. The position of the sample in the star formation rate (SFR)–stellar mass plane is shown in Fig. 1. Star formation rates were derived from the IR + UV luminosities as described in Whitaker et al. (2012). The selected galaxies lie predominantly on the upper half of the ‘star-forming main sequence’ (as shown in the histogram of Fig 1) (e.g. Noeske et al. 2007; Daddi et al. 2007; Whitaker et al. 2012). These galaxies were selected in H not IR; while this selection may bias the sample, it may possibly also have the advantage that it adds less uncertainty to interpreting the spatial distribution of star formation due to dust extinction.
3. The spatial distribution of star formation
3.1. Stacked H and Stellar Continuum Emission
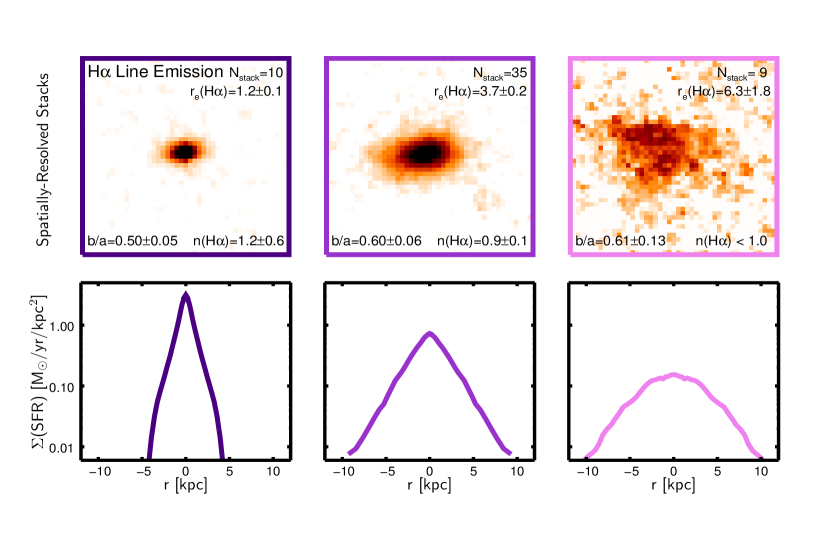
We stack the high spatial resolution H maps from 3D-HST to create average H maps – increasing the S/N and providing for a reliable measurement of the structural properties of H to large radii for this sample at . We divide the sample in three bins based on their H size111The sizes are measured using growth curves as described in Nelson et al. (2012) in order to homogenize the sample and investigate trends with size.222The results are similar when the bins are defined according to the F140W sizes. The median stellar masses of the stacks are . The galaxies are normalized by their F140W flux and centered according to their luminosity-weighted F140W image centers. We masked the [S ii] Å emission in the fit. At our spectral resolution, the FWHM of a line is Å , meaning that H Å and [N ii] Å are unresolved but H and [S ii] are separated by resolution elements. We rotated the images based on their GALFIT-derived F140W position angles to align them along their major axes, summed them, and divided the resulting stack by the summed masks. Finally, in order to correct for the effects of the PSF, the stacks were deconvolved by adding the GALFIT-derived PSF-deconvolved model to the residuals of the fit, a method developed in Szomoru et al. (2010).
Figs. 2 and 3 show the stacked, PSF-corrected H emission. The S/N in the stacks is high, and the emission is clearly spatially extended. Furthermore, both the rest-frame R-band and H maps are clearly elongated. We quantified the structural properties of the stacks with GALFIT (Peng et al. 2002) using empirical PSFs. For the continuum and H we find weighted mean axis ratios of and (H )=0.58 respectively, consistent with expectations for randomly oriented disks with thickness c/a=0.26,0.33. This thickness could be attributed to disks being intrinsically thick at , heterogeneous properties of the galaxies being stacked, the effect of bulges, a selection biased toward face-on galaxies, or noise.
3.2. Radial Profiles are Nearly Exponential
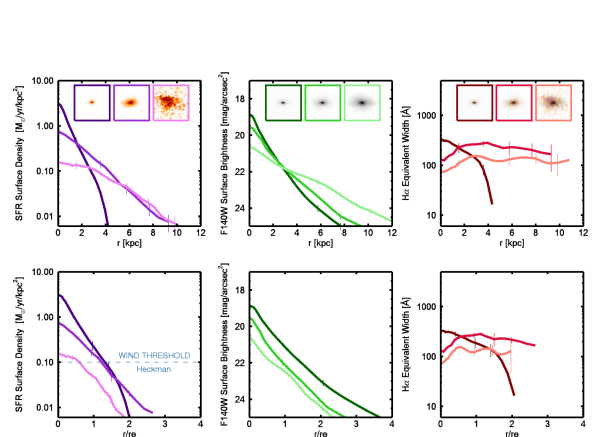
Fig. 3 shows the radial profiles derived from the stacks. Radial profiles of the PSF-corrected stacks were created by summing the flux in elliptical radii. A 30% correction was applied to account for [N ii] (see § 4). All uncertainties were derived by bootstrap resampling the stacks.
The H emission ranges from exponential to much less centrally concentrated than exponential. The stellar continuum emission in all the stacks is nearly exponential.
The radial equivalent width profiles (right panels of Fig. 3) are flat to within a factor of two and EW(H )Å for all stacks within 1.5. This suggests that the high global EW(H )s seen in these galaxies are not driven primarily by central starbursts but by strong star formation at all radii.
The derived Sérsic indices (Fig. 2) of the H and stellar continuum profiles are and with weighted means of and . As shown in van Dokkum et al. (2010), structural parameters measured from stacks are close to the mean values for the individual galaxies going into the stacks. The upper limit of for the largest H stack reflects the fact that the derived depends somewhat on the details of the fit (treatment of sky, fitting region) but always .
We find that the stacked spatial distribution of H for galaxies in this sample is exponential or shallower. All stacks have , implying a bulge fraction of less than 20% (van Dokkum et al. 1998). The radial H profiles (Fig. 3, left), seem to show a trend toward lower (H ) with increasing size. However, this trend is not statistically significant given the errors in the derived Sérsic indices. Additionally, note that the median galaxy with EW(H ) Å has a high enough star formation surface density to drive winds out to (Heckman 2002).
3.3. Effects of Dust
A major uncertainty in the interpretation of the radial H profile is the effect of differential dust extinction: if some parts of the galaxies are more obscured than others (see e.g. Wuyts et al. 2012), the derived radial profile of H would not reflect the radial profile of star formation. To assess the importance of this effect, we estimate the extinction as a function of radius. We determine the extinction from the radial color profile.
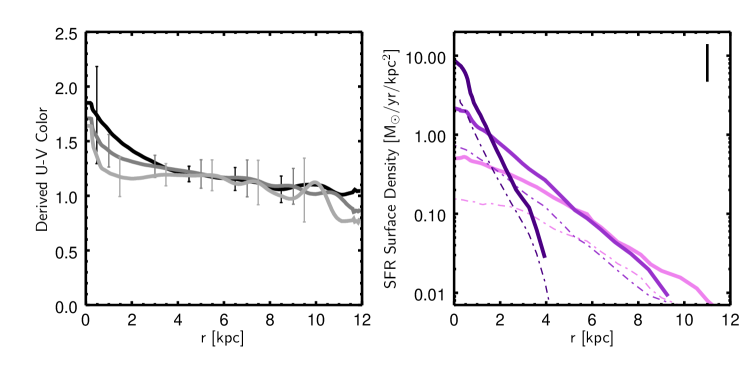
The color profile is determined from the combination of the F140W stacks with ACS F814W stacks, which can be converted into rest-frame color profiles. As shown in the left panel of Fig. 4, for most of the radial extent of the stacks the color is fairly constant, but it becomes redder inside a radius of 2 kpc (see also Szomoru et al. 2012). To estimate roughly how color translates into missed star formation, we assume that the star formation that is not captured by H will be captured by the IR (Kennicutt et al. 2009). Using photometry from Skelton et al. (2013) in prep, in addition to rest-frame U-V colors and IR-based SFRs from the NEWFIRM Medium Band Survey (NMBS, Whitaker et al. 2012), empirical relations were derived for the translation of rest-frame U-V colors into star formation corrections:
| (1) |
The dust-corrected radial profiles are shown in the right panel of Fig 4. The smallest galaxies appear to have star formation which is marginally steeper than exponential. The large galaxies have the largest radial gradients but their implied star formation is still less steep than exponential. Although this analysis assigns the entire observed color gradient to extinction, the centers of the radial color profiles could be red because of dust or age. Importantly, the Sérsic indices of the star formation in these stacks based on the implied dust correction remain close to one – for each of the stacks, weighted mean=1.0 So, even when accounting for dust, the averaged star formation in these galaxies has a nearly exponential spatial distribution.
4. Kinematics
The flattening of the stacks and the exponential H profiles suggest that the star formation occurs in rotating disks. To test this, we measured kinematics for a subset of this sample using NIRSPEC on the Keck II telescope on April 9-10, 2012. The sample comprises eight galaxies chosen from the small (1), middle (5), and large (2) stack, which have sizes, masses, Sérsic indices, star formation rates, and axis ratios representative of the sample as a whole.
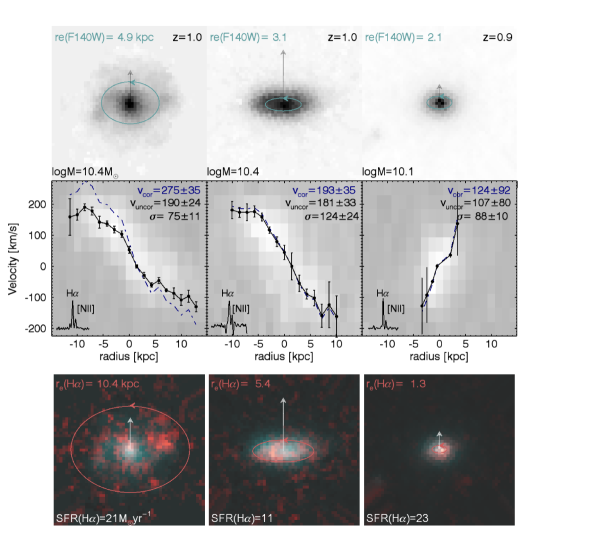
We used the low dispersion mode of NIRSPEC with 0.5” seeing and a slit width of 0.7”, giving a spectral resolution of km/s in the band (compared to km/s in the grism spectra). The slit was aligned along the major axis of each galaxy and observations were conducted in a series of four 900s exposures, dithering along the slit. The data reduction followed standard procedures for long slit spectroscopy (see, e.g., van Dokkum et al. 2004). We extracted kinematic information from the two dimensional spectra by fitting a gaussian to the H and [N ii] emission simultaneously at each spatial position along the slit. The median [N ii]/H is 0.3. Assuming the velocity shear in the two dimensional spectra is due to rotation, we take the rotational velocity to be the velocity difference between the geometrical center of the galaxy and the maximum velocity. We correct the rotation velocities for inclination angle using the 3D-HST axis ratios. We calculate one dimensional velocity dispersions by fitting a gaussian to the H emission in the central row of each spectrum. We calculate the instrumental to be km/s by fitting a gaussian to the sky lines. The intrinsic velocity dispersion is calculated by subtracting the instrumental dispersion from the measured dispersion in quadrature.
We find that all galaxies show velocity shear in their two dimensional spectra, with derived rotation velocities of 90–235 km/s uncorrected and 110–330 km/s corrected for inclination.333Measured velocity dispersions are also relatively high, but are difficult to interpret given the low spatial resolution of the Keck spectra. Fig. 5 shows the rotation curves for one example galaxy for each stack. These spectra are of the best quality but appear to be representative of the eight. The velocity profile of the smallest galaxy in Fig. 3 does not show evidence for a turnover, which means the measured maximum velocity is a lower limit on the rotation velocity at large radii. We conclude that the kinematics are consistent with the disk interpretation of the structural properties of the H emission. Although different classification methods make it difficult to perform a quantitative comparison, our results are qualitatively consistent with the finding that a large fraction of star-forming galaxies at appear to be rotating. (e.g., Wisnioski et al. 2011; Epinat et al. 2012; Swinbank et al. 2012).
5. Discussion
The central result of this paper is that the radial distribution of stacked H emission in galaxies is close to exponential out to kpc. Combined with the axis ratios of the stacks and the kinematics of a subset of the sample, the most straightforward interpretation is that star formation seems typically to occur in disks at at least for galaxies with high EW(H ). The factor of increase in the star formation rates of galaxies from to (e.g., Damen et al. 2009; Fumagalli et al. 2012) is apparently driven by increased star formation activity in disks rather than a much greater prevalence of merger-driven central starbursts – consistent with other studies (e.g., Rodighiero et al. 2011; Wuyts et al. 2011, 2012).
This result raises a number of questions. First, it is not clear how these galaxies are related to galaxies. An average galaxy in this sample has a distribution of stars with a Sérsic index of . If this average galaxy forms stars with , it will have a lower Sérsic index at later times. Either we are witnessing the build up of only the latest of late-type galaxies; these galaxies substantially change where their star formation is occurring between and ; or their stars, once formed, must migrate into a different configuration. In other words, if these are the ancestors of typical spiral galaxies, their bulges need to be built in some way besides the star formation we are seeing. This could be accomplished by mergers or secular evolution (e.g., Bournaud, Elmegreen, & Martig 2009; Ellison et al. 2011). These observations could be understood in the context of the following picture: at , disks are gas-rich and turbulent. As redshift decreases, the gas fraction decreases, and a bar instability grows, increasing the central concentration and central vertical velocity dispersion. (e.g., van den Bosch 2001; DeBuhr, Ma, & White 2012; Forbes, Krumholz, & Burkert 2012)
We also note the somewhat surprising presence of a population of large, rapidly-rotating disks with relatively low stellar masses at . These galaxies have mean (H)=7.3 kpc, v=240 km/s, km/s, and M⊙, meaning they are disks 8 Gyr ago, larger in size than the Milky Way (Drimmel & Spergel 2001) and thicker (Freeman 1987), with of the stellar mass (McMillan 2011) and similar or higher maximum rotation velocities (Bovy, Hogg, & Rix 2009). Both what these galaxies become in the local universe and how such extended star forming disks were made in an epoch of high disk turbulence are open questions. The small disks on the other end of the size distribution are also of interest. With median (H)=1.9 kpc, (R)=2.1 kpc, M⊙, and stacked , they more closely resemble compact versions of disky star formers than merger-driven star formation in spheroids (see also van der Wel et al. (2011).)
There are several caveats. First, our sample is not complete in mass or in SFR(UV+IR). In future papers (using the full 3D-HST survey) we will study the distribution of star formation as a function of these parameters. Second, the distribution of star formation in the stacks is not necessarily representative of individual galaxies. In individual galaxies the star formation is clumpy (e.g. Genzel et al. 2008, 2011; Förster Schreiber et al. 2009; Nelson et al. 2012, Fig. 1) and it is difficult to quantify the structure. Stacking these clumpy objects could be hazardous, but it may also provide more insight than can be gleaned from individual galaxies: assuming that the clumps are transient and “light up” a part of the underlying gas disk for a short time (as in e.g. Wuyts et al. 2012), our stacking technique effectively produces a time-averaged map of the star formation in the galaxies. Finally, dust attenuation remains a key uncertainty, both in the selection and in the interpretation of the profiles. This can be addressed with maps of the IR emission at the full ALMA resolution, or by measuring (spatially-resolved) Balmer decrements.
We thank the referee for a thorough report which improved the paper. Support from grant HST GO-12177 is gratefully acknowledged.
.
References
- (1)
- (2) Bournaud, F., Elmegreen, B. G., & Martig, M. 2009, ApJ, 707, 1
- (3)
- (4) Bovy, J., Hogg, D. W., & Rix, H.-W. 2009, ApJ, 704, 1704
- (5)
- (6) Brammer, G. B., et al. 2012, eprint arXiv:1206.1867, 200, 13
- (7)
- (8) Brooks, A. M., Governato, F., Quinn, T., Brook, C. B., & Wadsley, J. 2009, The Astrophysical Journal, 694, 396
- (9)
- (10) Cresci, G., et al. 2009, The Astrophysical Journal, 697, 115
- (11)
- (12) Daddi, E., et al. 2007, ApJ, 670, 156
- (13)
- (14) Damen, M., Labbé, I., Franx, M., van Dokkum, P. G., Taylor, E. N., & Gawiser, E. J. 2009, ApJ, 690, 937
- (15)
- (16) DeBuhr, J., Ma, C.-P., & White, S. D. M. 2012, MNRAS, 426, 938
- (17)
- (18) Dekel, A., Sari, R., & Ceverino, D. 2009, ApJ, 703, 785
- (19)
- (20) Drimmel, R., & Spergel, D. N. 2001, The Astrophysical Journal, 556, 181
- (21)
- (22) Ellison, S. L., Patton, D. R., Nair, P., Simard, L., Mendel, J. T., McConnachie, A. W., & Scudder, J. M. 2011, in IAU Symposium, Vol. 277, IAU Symposium, ed. C. Carignan, F. Combes, & K. C. Freeman, 178–181
- (23)
- (24) Epinat, B., et al. 2009, Astronomy and Astrophysics, 504, 789
- (25)
- (26) Epinat, B., et al. 2012, Astronomy and Astrophysics, 539, A92
- (27)
- (28) Forbes, J., Krumholz, M., & Burkert, A. 2012, ApJ, 754, 48
- (29)
- (30) Förster Schreiber, N. M., et al. 2009, ApJ, 706, 1364
- (31)
- (32) Förster Schreiber, N. M., Shapley, A. E., Erb, D. K., Genzel, R., Steidel, C. C., Bouché, N., Cresci, G., & Davies, R. 2011, ApJ, 731, 65
- (33)
- (34) Freeman, K. C. 1987, ARA&A, 25, 603
- (35)
- (36) Fumagalli, M., et al. 2012, eprint arXiv:1206.1867, 757, L22
- (37)
- (38) Genzel, R., et al. 2008, ApJ, 687, 59
- (39)
- (40) Genzel, R., et al. 2011, ApJ, 733, 101
- (41)
- (42) Grand, R. J. J., Kawata, D., & Cropper, M. 2012, eprint arXiv:1206.1867, 421, 1529
- (43)
- (44) Heckman, T. M. 2002, Extragalactic Gas at Low Redshift, 254, 292
- (45)
- (46) Hopkins, P. F., Hernquist, L., Cox, T. J., Di Matteo, T., Robertson, B., & Springel, V. 2006, ApJS, 163, 1
- (47)
- (48) Jones, T. A., Swinbank, A. M., Ellis, R. S., Richard, J., & Stark, D. P. 2010, MNRAS, 404, 1247
- (49)
- (50) Kassin, S. A., Weiner, B., Faber, S. M., et al. 2012, ApJ, 758, 106
- (51)
- (52) Kennicutt, R. C., et al. 2009, The Astrophysical Journal, 703, 1672
- (53)
- (54) Law, D. R., Steidel, C. C., Erb, D. K., Larkin, J. E., Pettini, M., Shapley, A. E., & Wright, S. A. 2009, ApJ, 697, 2057
- (55)
- (56) Lundgren, B. F., et al. 2012, ApJ, 760, 49
- (57)
- (58) Mancini, C., et al. 2011, The Astrophysical Journal, 743, 86
- (59)
- (60) McLean, I. S., et al. 1998, in Society of Photo-Optical Instrumentation Engineers (SPIE) Conference Series, Vol. 3354, Society of Photo-Optical Instrumentation Engineers (SPIE) Conference Series, ed. A. M. Fowler, 566–578
- (61)
- (62) McMillan, P. J. 2011, MNRAS, 414, 2446
- (63)
- (64) Nelson, E. J., et al. 2012, ApJ, 747, L28
- (65)
- (66) Noeske, K. G., et al. 2007, ApJ, 660, L43
- (67)
- (68) Peng, C. Y., Ho, L. C., Impey, C. D., & Rix, H.-W. 2002, The Astronomical Journal, 124, 266
- (69)
- (70) Rodighiero, G., et al. 2011, ApJ, 739, L40
- (71)
- (72) Roškar, R., Debattista, V. P., Quinn, T. R., Stinson, G. S., & Wadsley, J. 2008, The Astrophysical Journal, 684, L79
- (73)
- (74) Shapiro, K. L., et al. 2008, ApJ, 682, 231
- (75)
- (76) Swinbank, M., Smail, I., Sobral, D., Theuns, T., Best, P., & Geach, J. 2012, arXiv: 1209:1395
- (77)
- (78) Szomoru, D., et al. 2010, eprint arXiv:1206.1867, 714, L244
- (79)
- (80) Szomoru, D., Franx, M., van Dokkum, P. G., Trenti, M., Illingworth, G. D., Labbe, I., & Oesch, P. 2012, arXiv: 1208:4363
- (81)
- (82) van den Bosch, F. C. 2001, Monthly Notices of the Royal Astronomical Society, 327, 1334
- (83)
- (84) van der Wel, A., et al. 2011, The Astrophysical Journal, 742, 111
- (85)
- (86) van Dokkum, P. G., Franx, M., Kelson, D. D., Illingworth, G. D., Fisher, D., & Fabricant, D. 1998, The Astrophysical Journal, 500, 714
- (87)
- (88) van Dokkum, P. G., et al. 2004, The Astrophysical Journal, 611, 703
- (89)
- (90) van Dokkum, P. G., et al. 2010, ApJ, 709, 1018
- (91)
- (92) van Dokkum, P. G., et al. 2011, ApJ, 743, L15
- (93)
- (94) Whitaker, K. E., van Dokkum, P. G., Brammer, G., & Franx, M. 2012, ApJ, 754, L29
- (95)
- (96) Wisnioski, E., et al. 2011, Monthly Notices of the Royal Astronomical Society, 417, 2601
- (97)
- (98) Wuyts, S., et al. 2012, ApJ, 753, 114
- (99)
- (100) Wuyts, S., et al. 2011, ApJ, 742, 96
- (101)