The morphology of the ejecta in Supernova 1987A: a study over time and wavelength
Abstract
We present a study of the morphology of the ejecta in Supernova 1987A based on images and spectra from the HST as well as integral field spectroscopy from VLT/SINFONI. The HST observations were obtained between 1994 - 2011 and primarily probe the outer H-rich zones of the ejecta. The SINFONI observations were obtained in 2005 and 2011 and instead probe the [Si I]+[Fe II] emission from the inner regions. We find a strong temporal evolution of the morphology in the HST images, from a roughly elliptical shape before days, to a more irregular, edge-brightened morphology with a ’hole’ in the middle thereafter. This transition is a natural consequence of the change in the dominant energy source powering the ejecta, from radioactive decay before days to X-ray input from the circumstellar interaction thereafter. The [Si I]+[Fe II] images display a more uniform morphology, which may be due to a remaining significant contribution from radioactivity in the inner ejecta and the higher abundance of these elements in the core. Both the H and the [Si I]+[Fe II] line profiles show that the ejecta are distributed fairly close to the plane of the inner circumstellar ring, which is assumed to define the rotational axis of the progenitor star. The H emission extends to higher velocities than [Si I]+[Fe II], as expected from theoretical models. There is no clear symmetry axis for all the emission. Instead, we find that the emission is concentrated to clumps and that the emission is distributed somewhat closer to the ring in the north than in the south. This north-south asymmetry may be partially explained by dust absorption. We compare our results with explosion models and find some qualitative agreement, but note that the observations show a higher degree of large-scale asymmetry.
1 Introduction
Both observations and numerical simulations show that supernova (SN) explosions are asymmetric. In particular, simulations show that large-scale instabilities are likely to play a key role in triggering the explosions (e.g. Kifonidis et al. 2006; Hammer et al. 2010; Müller et al. 2012). The instabilities are expected to be reflected in the morphology of the ejecta in the homologous phase, which thus provides one of the few direct diagnostics of the explosion mechanism.
Information about the morphology of core-collapse SNe can be obtained in several different ways. Direct imaging of Galactic SN remnants can give detailed information about both the abundance and the density distributions. However, there are very few cases unaffected by the interaction with the circumstellar and interstellar media, or a central pulsar wind nebulae. By far, the most important case is Cas A, where both X-ray (e.g. Hwang & Laming 2012) and optical (e.g. Fesen et al. 2006) observations have provided important information about instabilities and large-scale mixing in the explosion. In addition, light echoes of Cas A have revealed evidence for asymmetries and shown that the supernova was a Type IIb (Krause et al., 2008; Rest et al., 2008, 2011).
Constraints on the global geometry of SN ejecta can also be obtained from polarization studies (see Wang & Wheeler 2008 for a review) and from the line profiles in the nebular phase (e.g. Maeda et al. 2008; Taubenberger et al. 2009; Milisavljevic et al. 2010). Both types of studies have revealed strong evidence for asymmetries, but the lack of spatial information means that there are no unique solutions for the 3-dimensional ejecta distributions.
SN 1987A offers a unique opportunity to study the spatial distribution of ejecta from a core collapse SN. Its location in the Large Magellanic Cloud, only kpc away, together with the fact that the explosion was seen only 25 years ago (on 1987 February 23), make it possible to spatially resolve the ejecta and study the morphology in the homologous phase, before the inner ejecta crash into the circumstellar medium.
The structure of the ejecta reflects the progenitor star. There is an inner, metal-rich core and an outer, hydrogen-rich envelope. Observations of emission lines from the core in SN 1987A show that this extends out to (e.g. Meikle et al., 1993, and this work). The core and the envelope are assumed to be separated by a steep density gradient, followed by a power-law gradient outside (Blinnikov et al., 2000). Only the inner ejecta (the metal core and the inner part of the hydrogen envelope) have a high-enough density to be observed directly in the images. However, from the time of the onset of the collision with the circumstellar medium (Lawrence et al., 2000) we know that the tenuous hydrogen envelope extends out to .
The circumstellar material around SN 1987A is most apparent as three rings, inclined by - with respect to the line of sight (Tziamtzis et al., 2011). The inner, equatorial ring spans while the two outer rings, located above and below the equatorial plane, are about three times larger. The rings are thought to have been created some years before the explosion, possibly as a result of a binary merger (Morris & Podsiadlowski, 2007). By 1995, days after the explosion, the outermost part of the ejecta had reached the equatorial ring and the interaction caused the first so-called hot-spot to appear (Garnavich et al., 1997; Lawrence et al., 2000). The ring has since been observed to brighten exponentially across the entire electromagnetic spectrum (e.g. Gröningsson et al. 2008a; Racusin et al. 2009; Zanardo et al. 2010; Dwek et al. 2010), although there are now signs that the flux has started to level off in the optical (Gröningsson et al., 2008a; Mattila et al., 2010).
To study the inner ejecta it is crucial to obtain high enough spatial resolution to separate it from the circumstellar rings. This can be achieved with the Hubble Space Telescope (HST) at optical wavelengths and with the use of adaptive optics from the ground at near-infrared (IR) wavelengths. We have recently used HST imaging observations, carried out approximately once per year since 1994 (day ), to measure the optical light curve of the inner ejecta (Larsson et al. 2011). This showed that the flux declined as expected from radioactive decay of 44Ti until days after the explosion, after which the flux started to increase. The fact that 44Ti is the dominant radioactive isotope at these late times is also supported by the observation of the associated hard X-ray emission lines (Grebenev et al., 2012).
It is clear, however, that radioactive decay cannot explain the re-brightening of the ejecta. Instead, we demonstrated that the most likely explanation for this is the energy input resulting from the X-ray emission produced by the collision between the outer ejecta and the equatorial ring. In this paper we will assume that interpretation is correct. Because of the brightening it is possible to carry out a detailed study of the morphology of the ejecta even at very late times.
There were early observations of asymmetries in SN 1987A long before the spatially resolved images of the ejecta were obtained with the HST. Between days , fine-structure appeared in the spectra (the so-called Bochum-event, Hanuschik & Thimm, 1990, and references therein), which was interpreted as being due to a high-velocity clump of 56Ni (Utrobin et al., 1995). Early speckle observations (Meikle et al., 1987; Nisenson et al., 1987) and polarimetry measurements (Jeffery, 1991) also provided evidence for asymmetries. These early observations only probe the structure of the outer hydrogen envelope and nearby gas though, which is not obviously connected to the inner ejecta.
More recently, studies of the morphology of the inner ejecta have been carried out by Wang et al. (2002), using HST spectral and imaging data from day , and by Kjær et al. (2010), using integral field spectroscopy in the near-IR obtained with SINFONI at the VLT around day . While Wang et al. (2002) favor a model in which the ejecta are prolate, with the long axis pointing out of the equatorial plane, Kjær et al. (2010) instead find that the ejecta are elongated closer to the plane of the ring. The latter conclusion is also supported by observations of light echoes, which probe the first few hundred days after the explosion from different viewing angles (Sinnott et al., 2012).
In this paper we study the morphology of the ejecta using HST imaging observations obtained between day 2,770 and 8,328, HST/STIS spectral observations from days 4,571, 6,355 and 8,378, as well as ground-based VLT/SINFONI integral field spectroscopy observations from days 6,816 and 8,714.
This paper is organized as follows: we describe the observations and data reduction in section 2, present the analysis of the images and spectra in section 3, discuss our results in section 4 and finally present our conclusions in section 5.
2 Observations and data reduction
2.1 HST Imaging
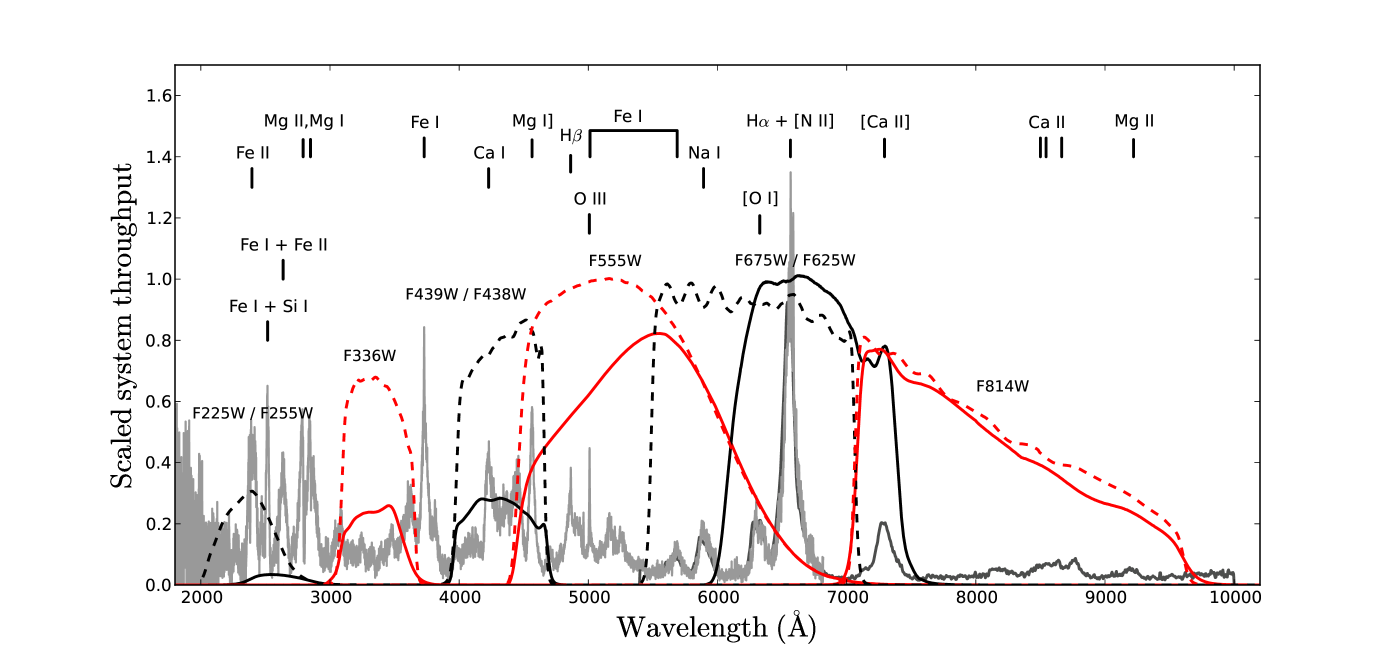
HST imaging observations of SN 1987A have been carried out regularly since days after the explosion (year 1994) as a part of the Supernova 1987A INTensive Study (SAINTS). In order to study the temporal evolution of the morphology we selected six observations, separated by days, taken in the F675W/F625W filters. These images are dominated by strong H-emission and offer the best signal-to-noise ratios. For two of the selected epochs (day 5,012 and day 8,328) there are also high-quality images in five other broad filters which we include in the analysis. The five filters together cover the entire wavelength interval between and , and thus allow a detailed study of the spectral energy distribution. To show which lines contribute to the different filters we plot in Fig. 1 the filter throughput curves superposed on ejecta spectra from HST FOS-2 G570H (day 3,604, below ) and HST STIS G750L (day 4,381, above ).
We used the MULTIDRIZZLE111http://stsdas.stsci.edu/multidrizzle software to remove cosmic rays from the images, apply distortion corrections and combine individual exposures using the drizzle technique (Fruchter & Hook, 2002). For each observation we drizzled the images to an optimal pixel scale based on the instrument and dither pattern used. The effective spatial resolution of the resulting images is between and . A set of common stars located around the remnant were used to align the images, giving excellent accuracy with the positions of stars in the aligned images always agreeing to within . The details of all the observations are summarized in Table 1.
2.2 HST STIS observations
The HST STIS observations that we use for this work were obtained on days 4,381 and 4,571 (year 1999), day 6,355 (year 2004) and day 8,378 (year 2010), using the G750M and G750L gratings. In the wavelength intervals covered by these gratings the H line dominates the emission from the ejecta. The spectral resolution is for G750M and for G750L. The details of the observations are summarized in Table 2.
For each slit position there are at least three separate exposures taken at dithered positions along the slit. We combined these using the CALSTIS software in order to remove cosmic rays and hot pixels. This successfully cleaned up the data from the first two observations, but a number of hot pixels remained in the observations from the later epochs. To remove these we used the IRAF fixpix task together with a user-supplied bad pixel mask. We then produced flux-calibrated two-dimensional spectra from the cleaned data with the CALSTIS x2d task in the standard way, and finally extracted one-dimensional spectra by summing over rows in the two-dimensional spectra. All spectra were corrected for the systematic velocity of SN 1987A (Gröningsson et al., 2008a).
2.3 SINFONI observations
We use integral field spectroscopy observations of SN 1987A obtained with SINFONI at the VLT on days 6,816, 6824, 6825, 6839 and 6843 (year 2005) and days 8,714 and 8,717 (year 2011). For this work we consider only the observations taken in the H-band, which is dominated by the m line. In the modeling of the 44Ti-powered spectrum, Kjær et al. (2010) and Jerkstrand et al. (2011) showed that this line is a blend of [Si I] and [Fe II], with [Si I] dominating, and that both lines originate in the regions close to the inner Fe core. For the two observations that we consider in this paper the X-ray input may also add a contribution from the hydrogen envelope which has not undergone nuclear processing.
The SINFONI K band , discussed in Kjær et al. (2010) has too low signal-to-noise to be useful for this analysis, but we note that the morphology seen in this band (dominated by the He I m line) is consistent with that seen in the H-band. The total H-band exposure times are 4,200 s and 3,600 s for 2005 and 2011, respectively. A detailed analysis of the 2005 data has already been presented by Kjær et al. (2010) and we refer the reader to that paper for details regarding the data reduction. The 2011 data were reduced in the same way, but with a more recent version of the pipeline (v2.2.3, dated 2010-08-12).
There are only variable sources within the small field of view of the SINFONI observations, which makes the flux calibration uncertain. To improve the calibration we used VLT/NACO imaging observations from day 7,201 and 8,644, which have a much wider field of view containing non-variable stars (Mattila et al., in prep.). We extrapolated the continuum level of the SINFONI spectra to account for the small differences in wavelength coverage between the two instruments, and further corrected for the differences in observing epoch by assuming that the flux from the ring evolves in the same way as the soft X-ray light curve (Helder et al., 2013). The latter assumption is based on the expectation that the H-band flux is likely to correlate with the optical flux, which is observed to correlate with the soft X-ray light curve (Gröningsson et al., 2008a). Since there is no published light curve for the ring in the H-band there is a considerable uncertainty in this assumption. A conservative estimate is that the SINFONI fluxes derived in this way have uncertainties of for day 6,816 and for day 8,717. The primary reason for the larger uncertainty in the former case is the larger difference between the SINFONI and NACO observing epochs. As for STIS, all the spectra were corrected for the systematic velocity of SN 1987A.
3 Data analysis
3.1 Imaging
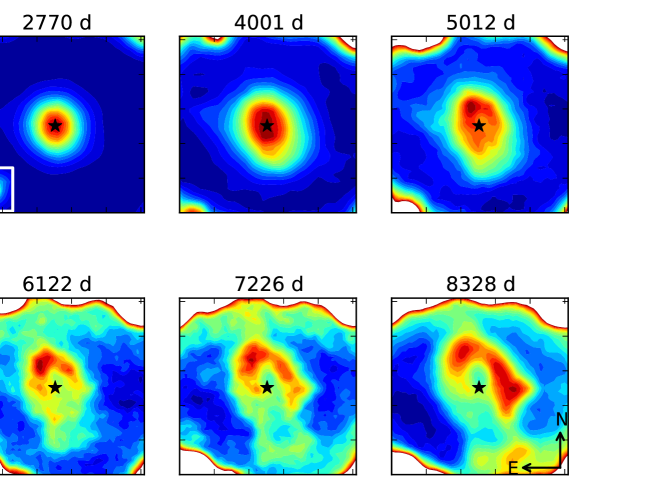
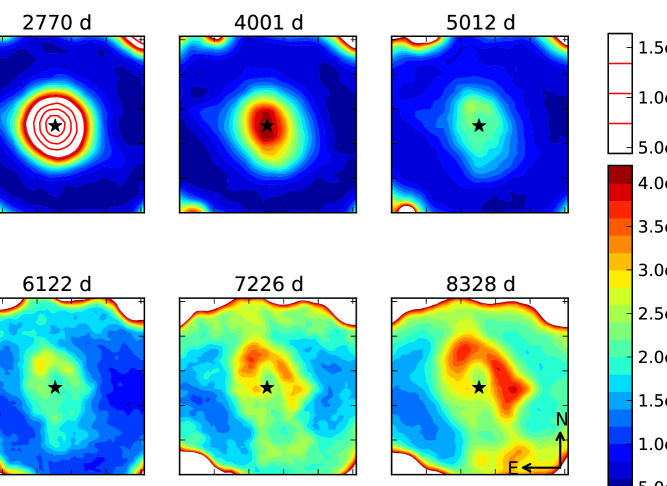
In Fig. 2 we show contour plots of the ejecta produced from the F675W/F625W images in the six selected epochs between day 2,770 and 8,328. In the left panel the contour levels are linearly spaced between the minimum and maximum surface brightness for each epoch, while in the right panel the same levels are used for all epochs. We note that these images are completely dominated by H-emission (see Fig. 1). Specifically, we find from the grating spectra that H makes up more than 70% of the total broad-band fluxes. In addition to H there is a small contribution from Ca I (originating in the O/Si and S/Si zones, Jerkstrand et al. 2011) and [O I] . The red wing of the F675W filter also has a contribution from [Ca II] , while Na I influences the blue wing of the F625W filter.
The most important result from Fig. 2 is that there is a clear transition around days from a roughly elliptical shape to a more irregular morphology, where the brightest part of the ejecta is an arc-like structure that is offset from the center of the remnant. We note that the transition in morphology coincides in time with the re-brightening of the ejecta. The early images also exhibit an asymmetry in the north-east and south-west edges of the ejecta due to one of the outer rings of circumstellar material. The outer rings are fading with time (Tziamtzis et al., 2011) and are not seen at all in the later images.
A natural question to ask is whether the changes in morphology can be explained simply by the fact that the spatial resolution has increased with time, primarily due to the expansion of the ejecta but also because of the change of instruments and dithering strategies. To address this issue we first degraded the resolution of the later, higher-resolution images to match the first observation, which has the lowest resolution. The results are shown in the upper panel of Fig. 3. Next we scaled the final image from day 8,328 to allow a comparison with the previous images. As the ejecta are expanding homologously, this was achieved by increasing the pixel scale by a factor given by the ratio between 8,328 days and the number of days since the explosion for each of the other observations. The results are shown in the bottom panel of Fig. 3. It is clear that the change in morphology cannot be explained by the increased resolution offered by the expansion.
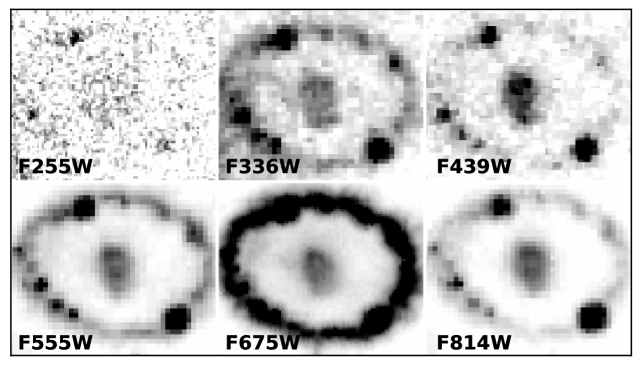
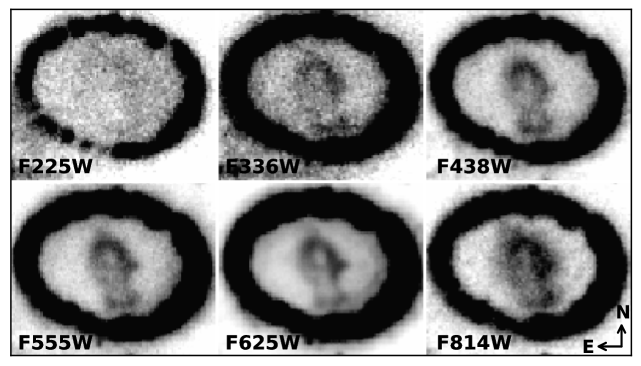
In order to investigate the two morphological stages in more detail we selected one epoch from each stage (day 5,012 and 8,328, respectively) for which there is HST imaging observations in six broad filters covering the entire wavelength interval between (Fig. 1). These images are shown in Fig. 4. The images from day 5,012 all display a similar elliptical morphology, while all the images from day 8,328 reveal a similar edge-brightened morphology. The only notable exception is that the ejecta emission in the F225W and F841W images from day 8,328 appear slightly more extended than in the other images from the same epoch.
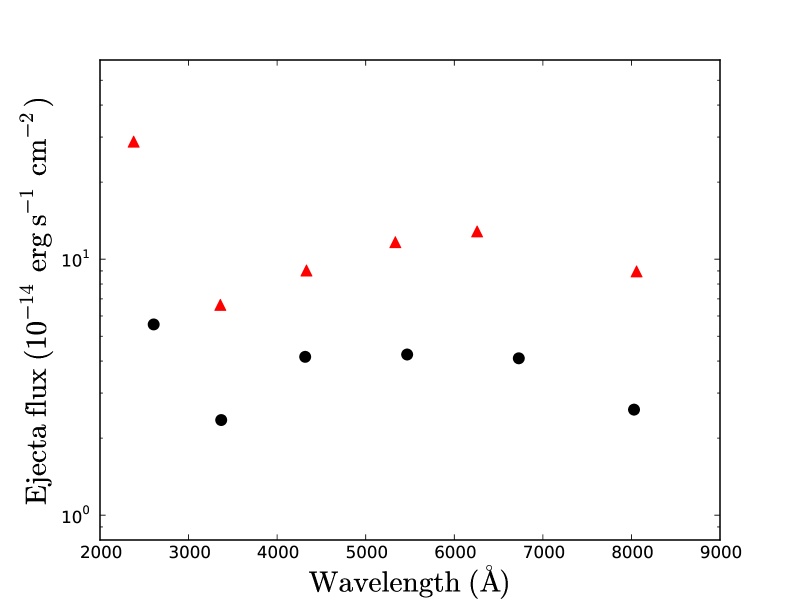
To examine whether the spectral energy distribution has changed between day 5,012 and 8,328 we also measured the flux of the ejecta in all of the images, the results of which are shown in the left panel of Fig. 5. The plotted fluxes are the total fluxes in each filter, i.e. the measured flux density multiplied by the rectangular bandwidth of the filter and the ratio between the peak throughput and the throughput at the reference wavelength. We performed the measurements using elliptical apertures with a position angle of and an axis ratio of , approximating the shape of the ejecta. The semi-major axis of the aperture was for day 5,012 and for day 8,328, chosen to account for the expansion between the epochs and to include as much of the ejecta as possible, while still avoiding the equatorial ring. This semi-major axis corresponds to in the plane of the sky. The sky background was measured as an average of five empty regions located around the remnant, and subtracted from the ejecta fluxes. We note that the sky background is low, contributing less than of the flux in any of the measurements.
A bigger source of uncertainty is the background due to scattered light from the brightening equatorial ring. While this background is negligible in the early epoch it is fairly high in the late one. To estimate the contribution from the ring at 8,328 days we constructed a model for it in the F625W band (where it is brightest) using the Tiny Tim222http://www.stsci.edu/hst/observatory/focus/TinyTim HST point-spread-function modeling tool, as explained in Larsson et al. (2011). Using the model we found that the scattered light from the ring contained within the ejecta aperture corresponds to of the flux measured in a wide elliptical annulus centered on the ring itself. Subtraction of this scattered light reduces the total flux in the ejecta aperture by about in this band. We corrected the ejecta fluxes in the other filters by measuring the ring flux in each filter and assuming that the same fraction of this flux () always falls within the ejecta aperture. This correction reduced the ejecta fluxes by for the different filters. As discussed in Larsson et al. (2011), we estimate that the calculation of the amount of scattered light is accurate to within (i.e. the correction in the F625W band is etc.).
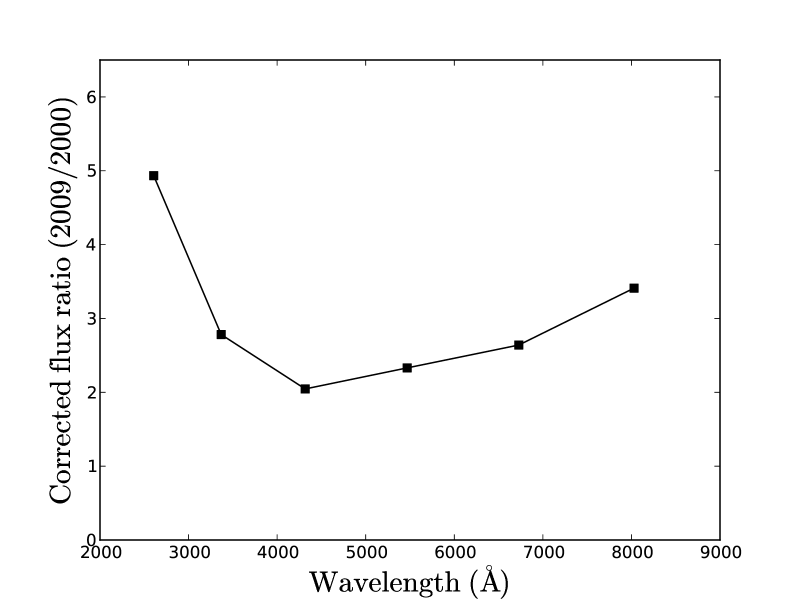
The right-hand panel of Fig. 5 shows the flux ratios between the two epochs, divided by the ratios expected due to the small differences between the filters used for the two epochs (cf. Fig. 1). The latter ratios were calculated using the SYNPHOT333http://www.stsci.edu/institute/software_hardware/stsdas/synphot package with the spectra in Fig. 1 as input. The plot shows that the flux has increased by factors of in most filters, with the exception of the F255W/F225W band where the increase is a factor .
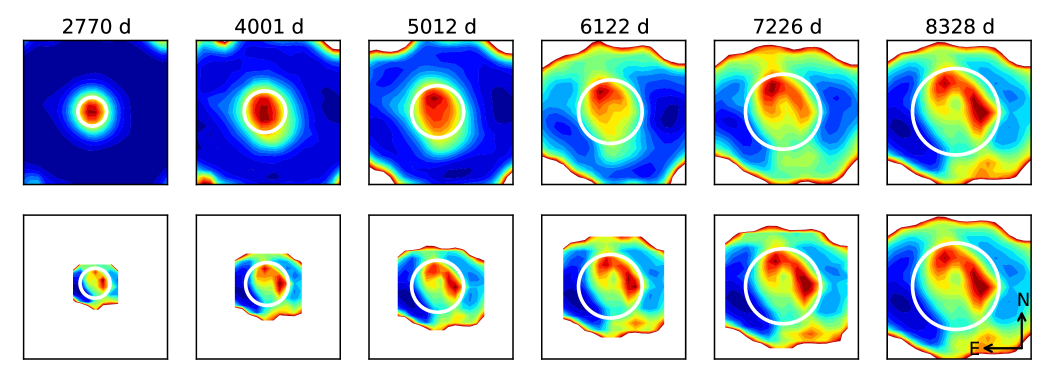
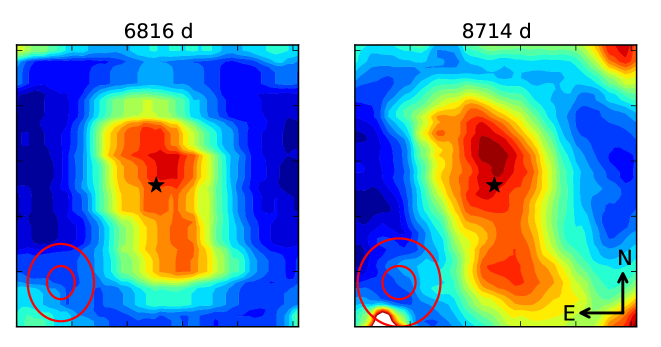
As a final point we compare the HST imaging results with images of the [Si I]+[Fe II] m line from the SINFONI observations on day 6,816 and 8,714. Contour plots of the SINFONI data covering the interval around the line are shown in Fig. 6. The plots also show the 50% and 80% encircled energy from a point source (calculated as described in Kjær et al. 2010), illustrating the enhanced core and broad wings of the point spread function (PSF). There are some clear differences between Fig. 6 and the HST F675W/F625W contour plots in Fig. 2. The peak brightness of the SINFONI images is close to the center of the remnant, near the ’hole’ in the HST images, and there is also a bright region in the southern part of the ejecta, corresponding to another faint region in the HST images. Furthermore, there is no strong emission coincident with the bright western region of the ejecta seen in the last HST image.
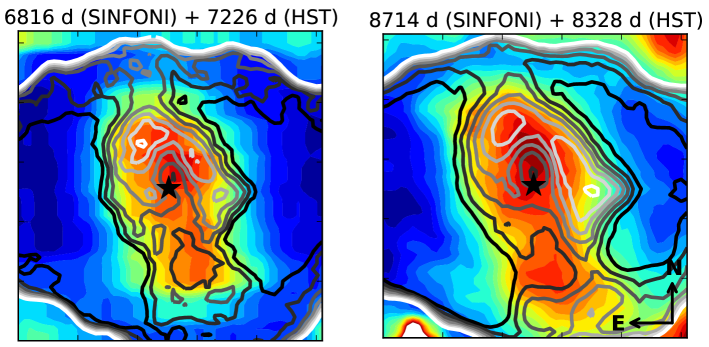
These differences are even more apparent in Fig. 7, where we over-plot contours from the HST F625W images from days 7,226 and 8,328 on the SINFONI contour plots from Fig. 6. The images are well aligned (the equatorial ring has the same position and shape) and the differences in observing dates only introduce a % difference in the size of the ejecta. The spatial resolution is slightly better in the HST images, but this is not enough to e.g. hide the hole in the SINFONI images. In particular, if the hole was absent from the SINFONI images due to the broader wings of the PSFs, we would not expect the brightness to peak near the center of the hole. The SINFONI images are also consistent with the HST/WFC3 F160W images and the H-band images obtained with VLT/NACO (Mattila et al., in prep.). We thus conclude that there are significant differences between the morphology of the m emission and the H emission.
3.2 Spectra
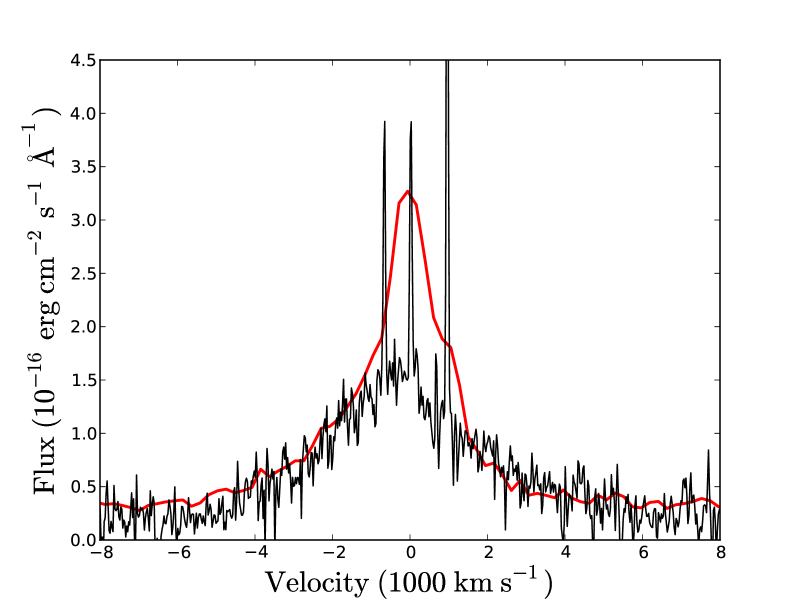
In order to obtain information about the three-dimensional distribution of material we need to complement the imaging observations with spectra. Because of the homologous expansion of the ejecta, the measured Doppler shifts are directly proportional to the distance along the line of sight from the center of the explosion, making the spectral information very powerful. For this analysis we consider HST STIS spectra of the H line taken on days 4,571, 6,355 and 8,378, as well as SINFONI spectra of the [Si I]+[Fe II] m line from days 6,816 and 8,714. We note that there is also a STIS observation from day 4,381, which was obtained with a wide, slit. The full ejecta spectrum from this observation is shown in Fig. 1, but we do not consider it in this section since it is consistent with the spectrum from day 4,571, which has much better spatial and spectral resolution.
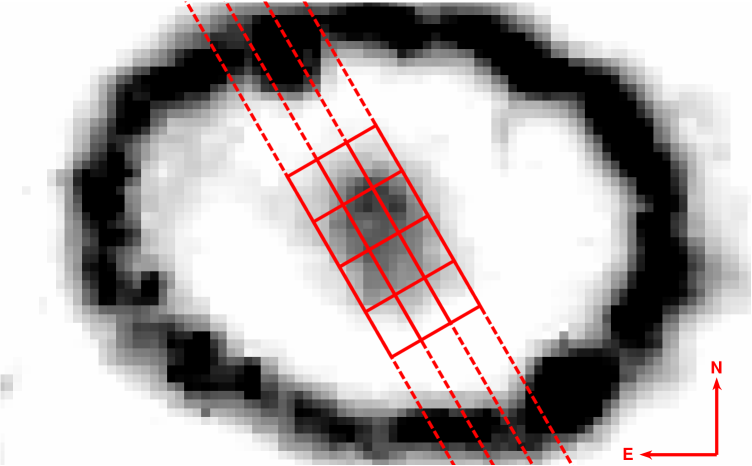
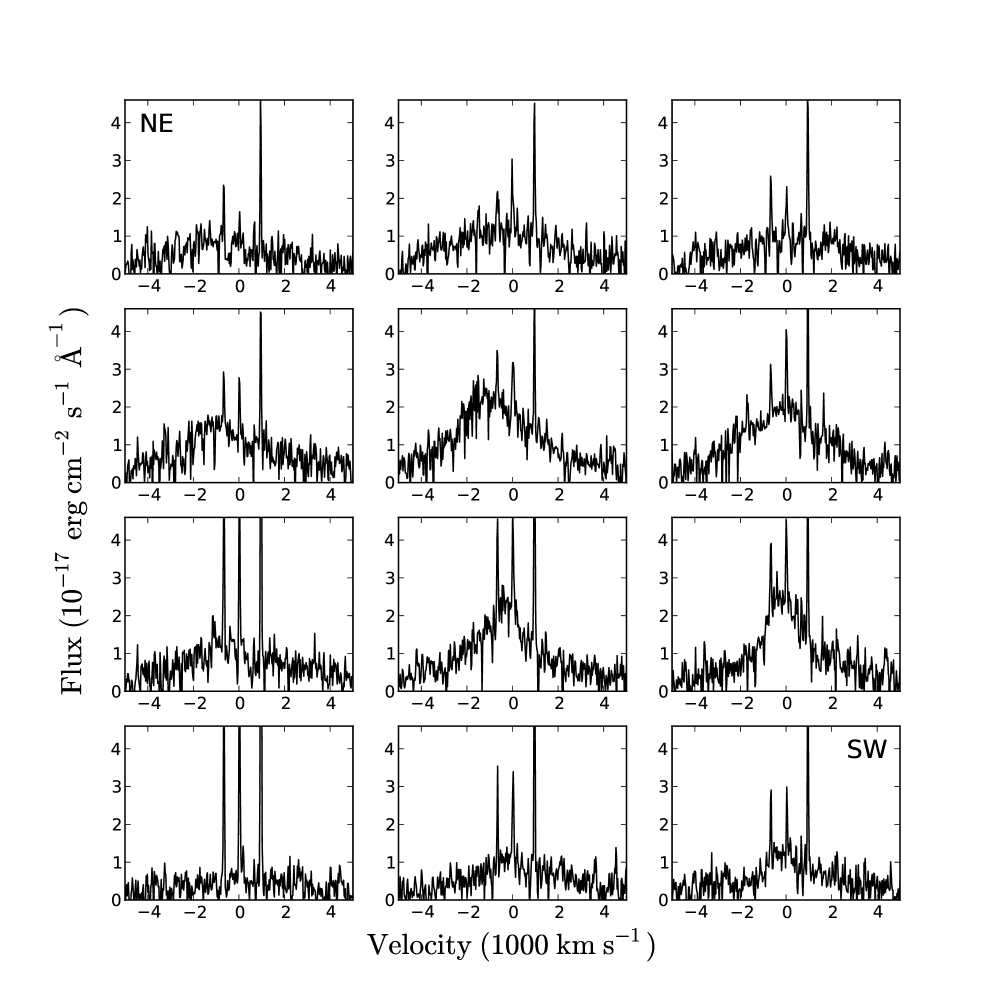
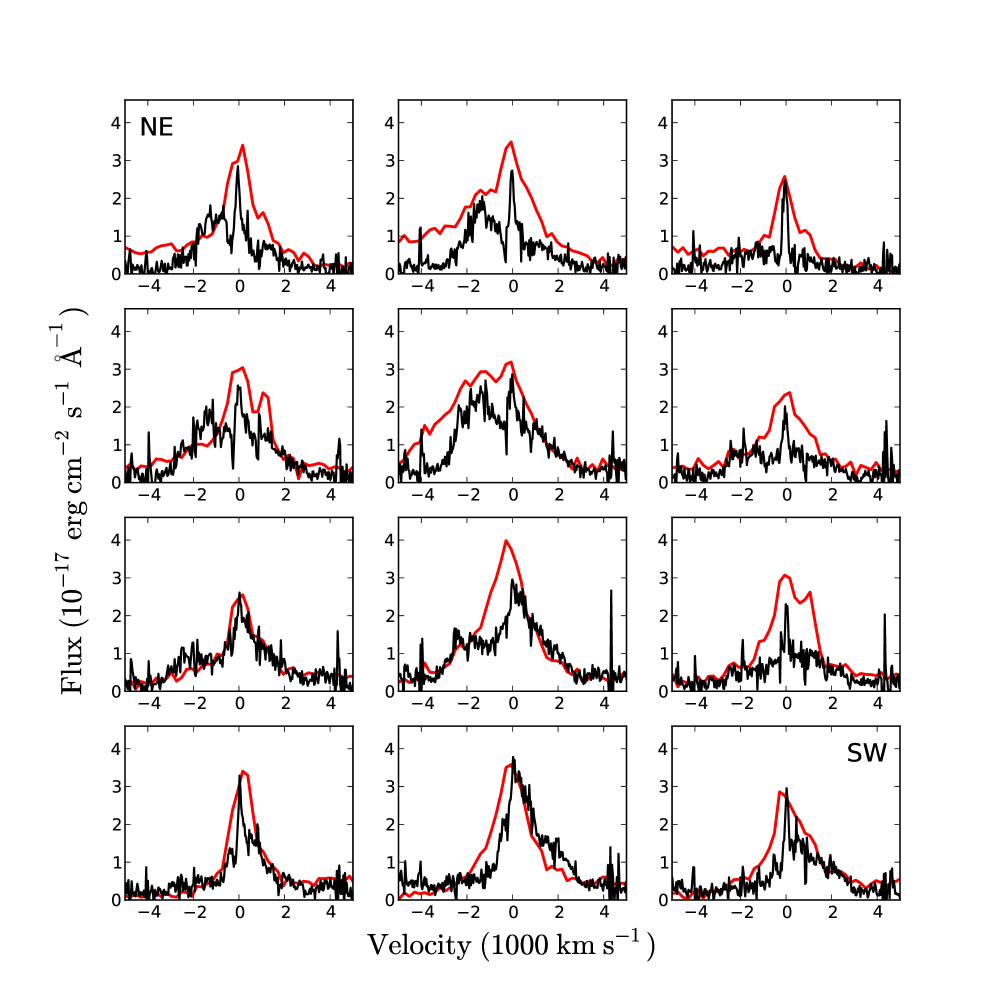
The STIS observations from day 4,571 probe the radioactively dominated phase. The observations were obtained with the G750M grating for three adjacent slit positions (slit width ) tilted by about from the north, thus covering most of the ejecta (see Fig. 8). We extracted one-dimensional spectra in four regions along each slit as marked in Fig. 8. The resulting spatially resolved profiles are shown in Fig. 9 and the total profile is shown in Fig. 10. Due to the excellent spectral resolution we can clearly separate the narrow lines from the outer ring ([N II] , H and [N II] ) from the broad ejecta profile. The latter extends out to at least . The spatially resolved profiles show a trend of more blueshifted emission in the north and more redshifted emission in the south. The emission is also slightly brighter in the north. This is reflected in the full profile in Fig. 10 (black line), which is asymmetric with a somewhat stronger blue wing. This asymmetry may partly be due to the presence of dust (see further discussion in section 4.3.3).
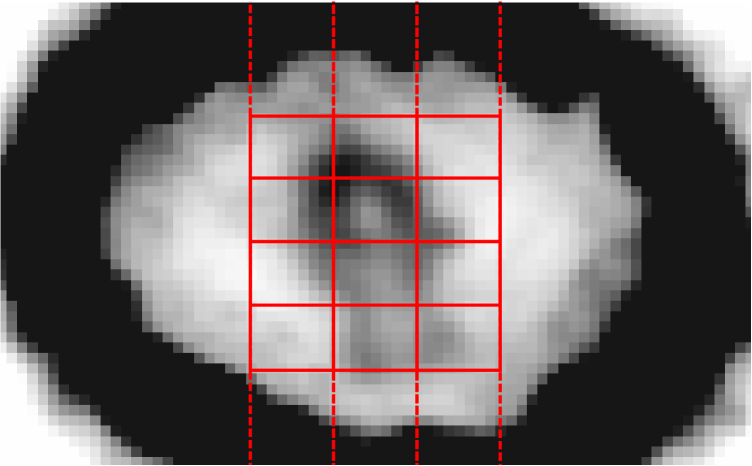
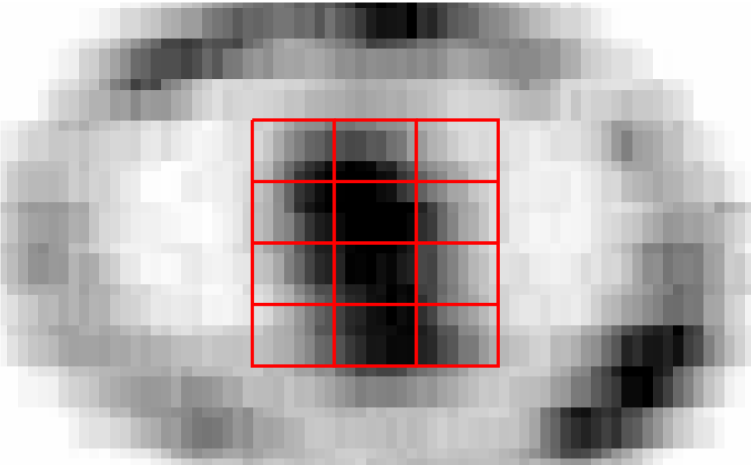
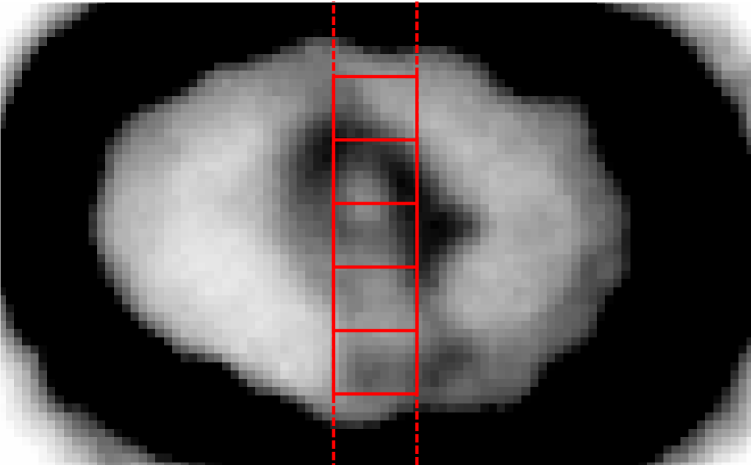
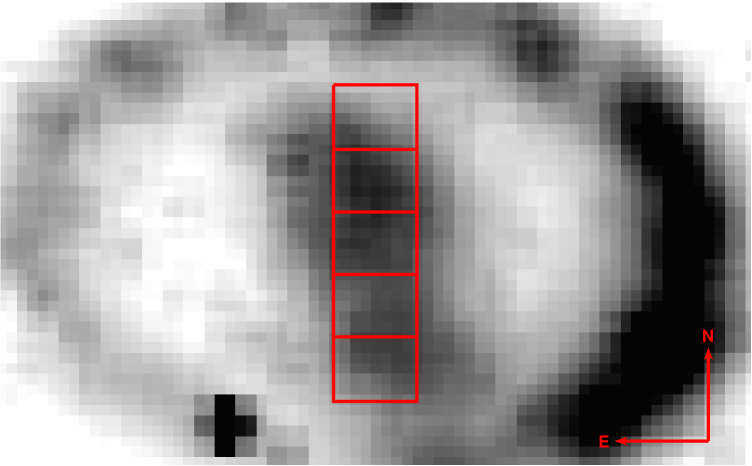
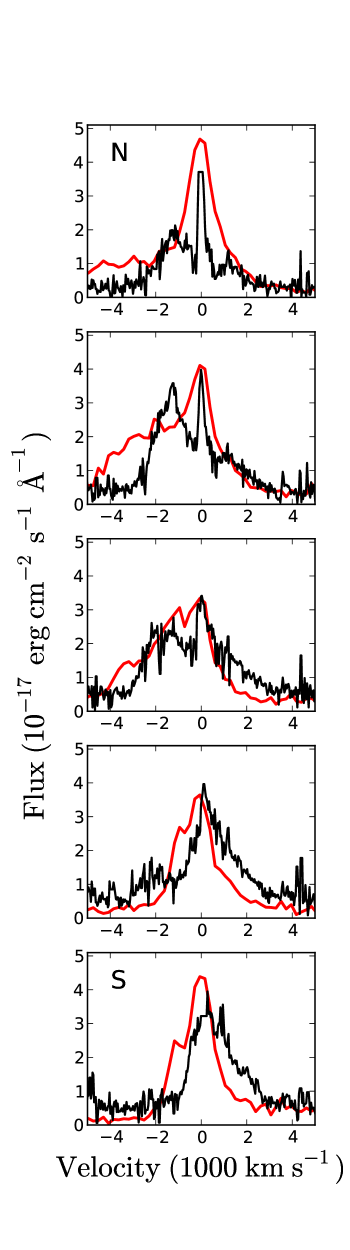
Compared to this early observation the STIS observations from days 6,355 and 8,378 have poorer spectral and spatial resolution, as they were taken with the G750L grating and a slit width of . For day 6,355 three adjacent slit positions oriented in the north-south direction cover most of the ejecta, while on day 8,378 there is only one slit position covering the central part (see Fig. 11). As above, we extracted one-dimensional spectra in steps along each of the slits (Fig. 11). The results for the two epochs are shown in Figs. 12 and 13, respectively. The 2D STIS spectra are plotted in Fransson et al. (2013, in prep. F13 from here on), showing both the H and the [Ca II] emission.
The SINFONI observations were carried out 461 and 629 days later than the two STIS observations, which is close enough to make useful comparisons (the offsets correspond to of the age of the supernova). We therefore include the SINFONI m line profiles from days 6,816 and 8,714 in Fig.12 and 13, respectively. In order to extract SINFONI spectra from the same regions as the STIS spectra we used the geometrical center of the equatorial ring as a reference point, noting that the size and shape of the ring is very similar in the optical and near-IR. The extraction regions are shown superposed on the SINFONI images of the m line () in Fig. 11. There are some uncertainties in the comparison with the STIS spectra owing to the different PSFs (the SINFONI PSF has an enhanced core, with broader faint wings), the positioning of the STIS slits, the image quality etc; however, these effects are small compared to the systematic effects introduced by contamination from the equatorial ring.
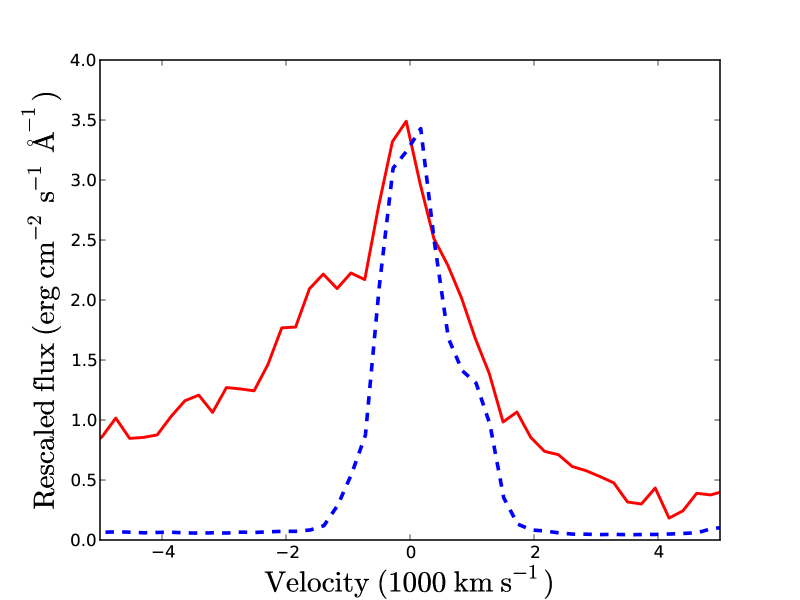
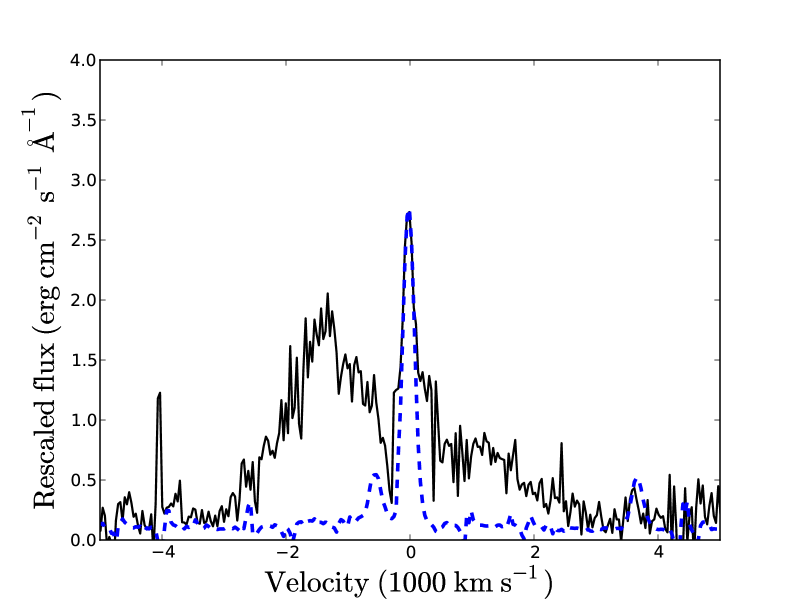
At these late epochs, the fading emission from the outer ring, which was identified in the STIS spectrum from day 4,571, will only make a small contribution to the ejecta spectra (see light curves in Tziamtzis et al. 2011). On the other hand, the equatorial ring is much brighter at these times (e.g., Fig. 4) and it is likely to contribute to the spectra in Figs. 12 and 13. To get an estimate of the level of contamination we extracted spectra from the equatorial ring for both SINFONI and STIS and re-scaled them to the ejecta spectra, as shown in Fig. 14. For SINFONI it is clear that the narrow () central component originates from the ring, but that there are no other strong lines from the ring that could contribute to the broad ejecta profile. In the case of the STIS observations, it is harder to determine the contribution from the ring due to the lower spectral resolution. The ring spectrum contains intermediate-velocity lines of [N II] , H and [N II] (e.g. Gröningsson et al. 2008b), which together make a broad, skewed component that is likely to contaminate the ejecta spectra between about . There are no strong emission lines from the ring that could contaminate the broad wings of the ejecta H-profile outside this interval though.
Inspection of the spatially resolved ejecta profiles in Figs. 12 and 13 show the same trend of more blueshifted emission in the north and more redshifted emission in the south, as already noted for the earlier STIS observations in Fig. 9. The H and [Si I]+[Fe II] profiles mainly differ in their blueshifted emission, with the H-lines exhibiting smoother wings extending to higher velocities. These properties will be discussed in more detail in section 4 below.
As the slit positions for the STIS observations on day 6,355 cover most of the ejecta we also show the full profile from these observations in Fig. 10, together with the total profile from day 4,571. Even though the spectra were extracted such that most of the ejecta would be included for both epochs, it is clear that some uncertainties are introduced by differences in gratings, slit width and orientation, as well as the expansion of the ejecta. Nevertheless, it is interesting to note that the two STIS profiles are very similar despite the change in morphology that has occurred during the five years between the two observations. The fluxes are also rather similar, which is likely due to a combination of the uncertainties mentioned above, together with the fact that the minimum flux was reached in the time interval between the observations
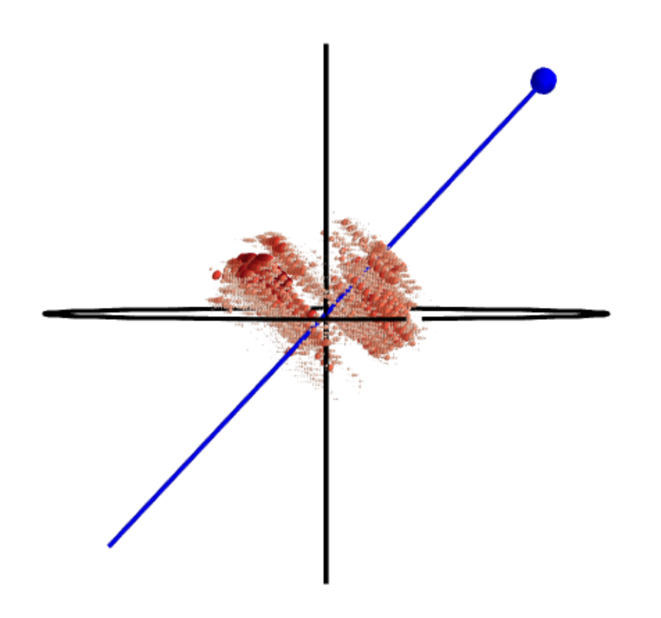
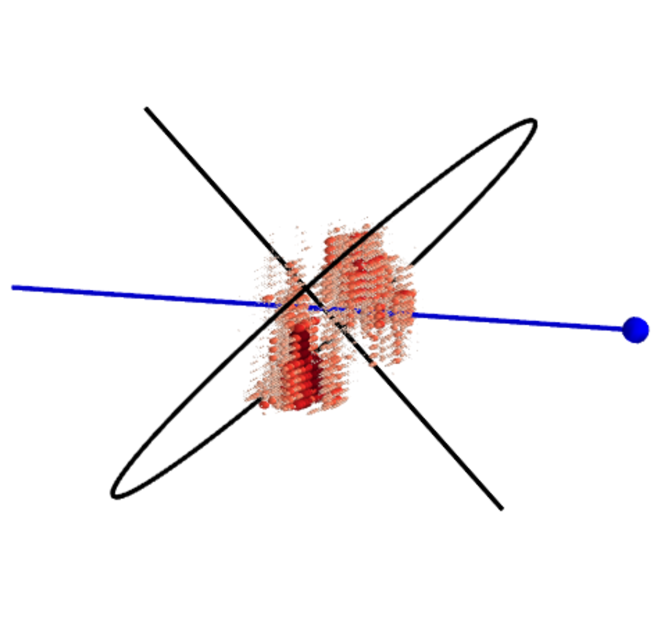
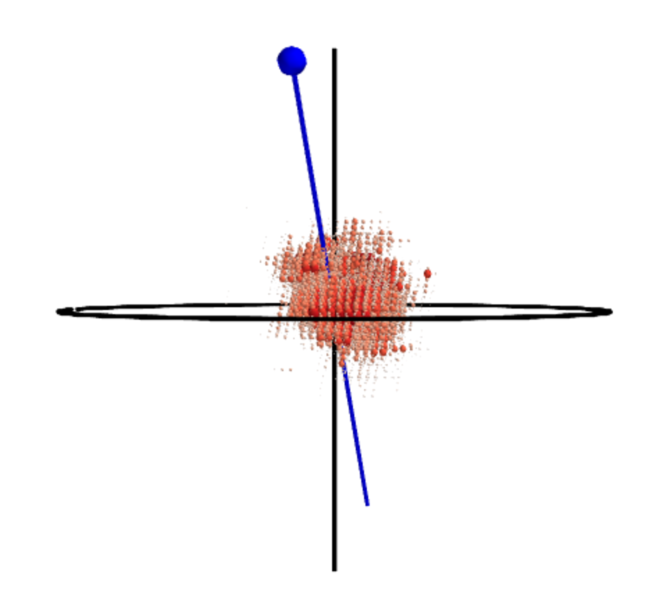
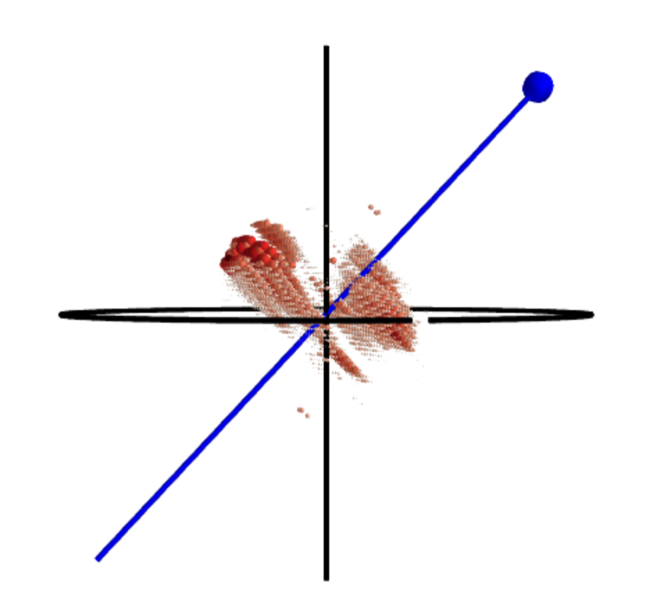
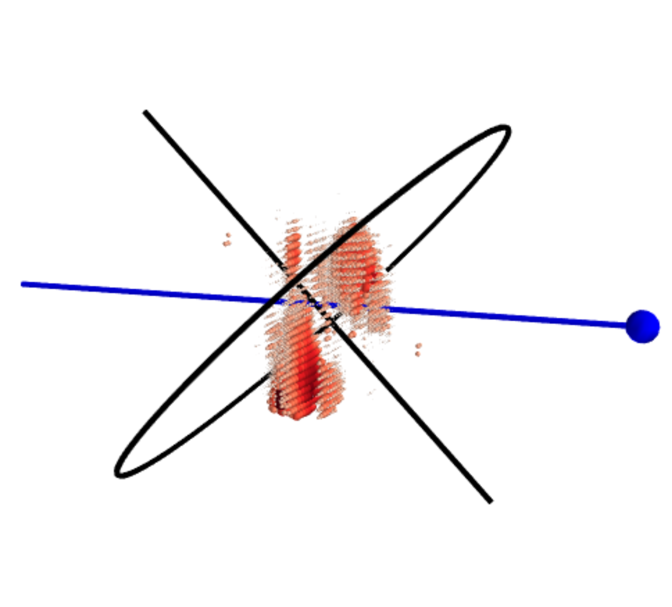
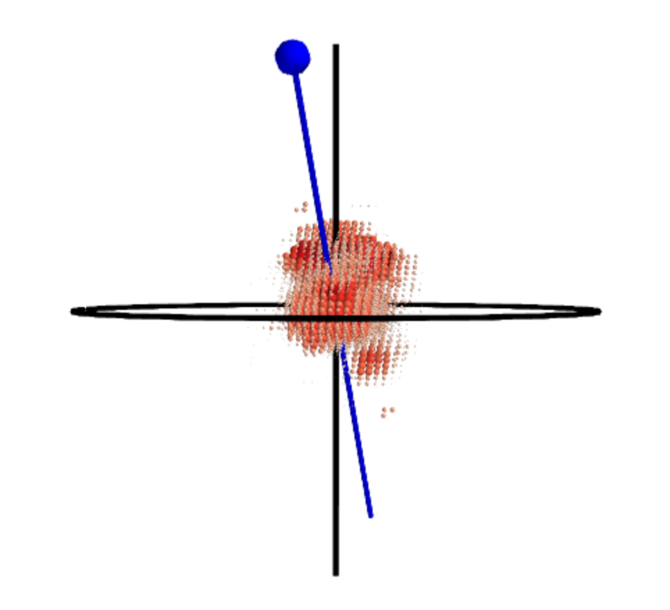
The SINFONI data also cover all of the ejecta and we therefore next consider these observations in more detail. Compared to the STIS observations, the SINFONI data have the advantage of higher spatial and spectral resolution. In Fig. 15 we plot the three-dimensional emissivity in the [Si I]+[Fe II] line, obtained by converting the velocity along the line of sight to a distance from the center for each pixel, assuming homologous expansion and a distance of 50 kpc to SN 1987A. The position of the equatorial ring and our line of sight are also included as reference points. Animations showing the full 3D view of the emissivity, created with Mayavi (Ramachandran & Varoquaux, 2011), are included in the online version of the journal.
These plots and animations show that the emission is concentrated in two ”clumps”, one to the north on the near side and one to the south on the far side with respect to the plane of the sky. In order to show the large-scale structure as clearly as possible we have chosen to only plot ejecta emission brighter than 3 times the continuum level with velocities lower than (excluding the central along the line of sight). The first condition ensures that the plotted data points are well above the noise level and highlights the location of the brightest emission. We note that choosing a lower cutoff simply makes the observed structures slightly larger. The cuts in velocity were chosen in order to avoid emission from the ring blending with the ejecta emission. The downside of this is that some bright emission in the southern tip of the ejecta is excluded (cf. Fig. 6) and that there is a small gap in the central region. We stress that none of these different cuts change the main conclusion that the emission is concentrated to two clumps. It is also clear that there is very little change in morphology between the two observations.
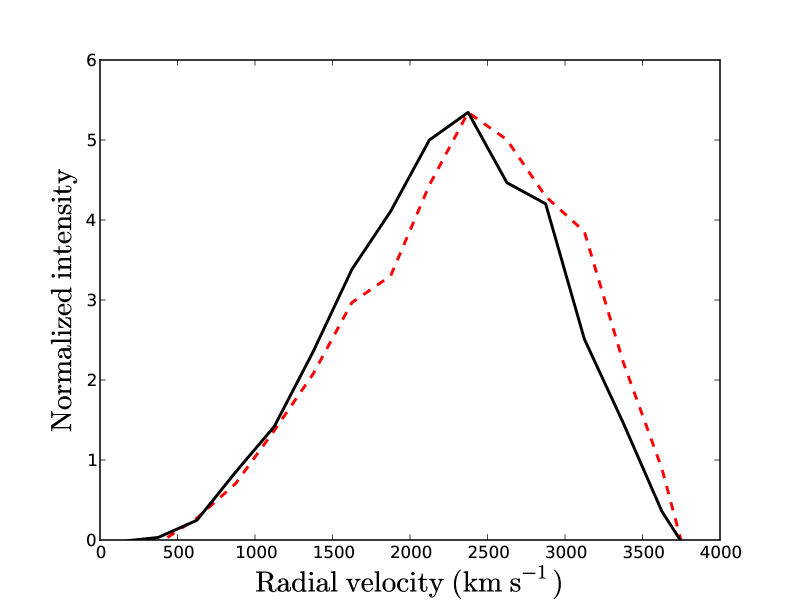
From these three-dimensional maps we also calculate the radial intensity distribution by summing over spherical shells of width . The results are shown in Fig. 16. For both epochs the intensity peaks around and the width of the distribution at half maximum is . We note that there are systematic uncertainties in these distributions due to difficulties in defining the continuum level ( % uncertainty) and the fact that the resolution is higher along the line of sight than perpendicular to it by a factor of (the velocity resolution perpendicular to the line of sight improves with time due to the expansion).
The change in the ejecta flux between the two SINFONI observations is a factor of . While this is consistent with the HST observations, the rather large uncertainties in the flux calibration (discussed in section 2.3) means that we cannot exclude the possibility that a significant fraction of the emission at these wavelengths is still due to radioactivity.
4 Discussion
4.1 Thermalization of the radioactive and X-ray input
Our observations provide us with intensity maps in different spectral lines. Because our main goal is to infer information about the spatial distribution of the different elements, we need to discuss the connection between the energy input in the form of radioactivity and X-rays, the density distribution, and the observed emission. This is discussed in detail in e.g., Kozma & Fransson (1992), Jerkstrand et al. (2011) and F13, so here we only summarize the main points.
The decay of 44Ti produces gamma-rays and positrons. Jerkstrand et al. (2011) estimate an optical depth to the gamma-rays of . At 20 years is only , which mens that the positrons dominate the energy input. With full trapping of the positrons, as indicated in Jerkstrand et al. (2011), almost all radioactive input will be deposited in the Fe-rich material. The energy of the positrons is deposited as ionizations, excitations and heating, resulting in optical and IR emission lines. Because the energy input mainly occurs in the Fe-rich material, with a minor contribution from the Si/S zone, most of the resulting emission will come from ions of the Fe-rich material.
In addition to the energy input directly connected to the 44Ti decay, there is an important contribution from freeze-out emission in the hydrogen envelope, where the low density makes recombination slow and energy input from earlier radioactive decays of 56Co and 57Co dominate (Fransson & Kozma, 1993). This component mainly results in Ly, two-photon and Balmer line emission.
Even in the H and He zones the optical depth to the UV resonance lines from Mg I-II, Ti I-II, Fe I-II and other trace elements is large enough to scatter nearly all of the radiation emitted in the UV. Some of this will escape as blended lines at longer wavelengths in the UV and near-UV, while some is emitted as fluorescence radiation in the optical and IR. Spatially, this emission comes from the hydrogen envelope, even though the primary origin may be from the processed Fe core.
At later epochs, when the ejecta are powered by the X-ray emission, the thermalization of the fast photoelectrons created by the X-ray absorption is similar to that of the gamma-rays and positrons resulting from the radioactive decay. As long as the energy of the photoelectron is larger than keV, the fractions of the energy going into heating, ionizations and excitations are independent of energy (e.g. Xu & McCray, 1991). The fractions are, however, sensitive to the ionization level, which determines the efficiency for Coulomb heating. Estimates in F13 show that the ionization in the outer regions close to the ring can be high, , while that in the core is typically . For ionization fractions in this range, the total fraction of the X-ray energy emerging as H is (Xu & McCray, 1991; Kozma & Fransson, 1992). Most of the remaining energy emerges as two-photon emission and Ly. In the same way as described above, this emission may be scattered by UV resonance lines.
4.2 Evolution of the spectral energy distribution
In Larsson et al. (2011) we showed that the ejecta of SN 1987A have brightened by a factor 2-3 in the F675W/F625W and F439W bands since day 5,012. We also showed that the brightening can be explained by a change in the dominant energy source, from radioactive decay before day (year ) to X-ray input from the ejecta - ring collision thereafter. In this paper we have extended the analysis to a broader wavelength range, using five broad filters that cover the entire interval between and Å. As shown in Fig. 5, the flux has increased by a factor 2-3 between days 5,012 and 8,323 in all the filters, with the exception of the UV-band (F255W/F225W), where the increase is a factor of .
There are no spectra in the UV-band at late epochs, so we cannot say exactly which lines are responsible for the large increase, or if the flux correction between the F225W and F255W filters deduced from the early spectra has changed. However, we note that at early epochs the band is dominated by Fe I-II and Mg I-II lines (Fig. 1) and that most of the flux in these lines is due to resonance scattering in the H-rich zones of the supernova (section 4.1 and Jerkstrand et al., 2011). As we will discuss below, most of the X-rays are absorbed in the H-rich outer ejecta, so it is reasonable that the largest increase is seen in this wavelength interval. In fact, from figures 3 and 4 in Jerkstrand et al. (2011) it is clear that the core emits primarily in the Å range, while the envelope dominates the emission at shorter and longer wavelengths. This also agrees with the fact that the filter with the second to largest increase is F814W, at the longest wavelengths (Fig. 5). In this filter the dominant lines are the Ca [II] doublet, the Ca II triplet and the Mg II lines, all of which primarily come from the envelope. As discussed in F13, the Mg II lines may also be enhanced through Ly fluorescence.
The evolution of the broad-band fluxes can be compared with the spectral evolution determined from ground-based observations obtained with UVES at the VLT (F13). Although the spatial resolution is limited, the high spectral resolution of the UVES data makes it possible to follow several lines from the ejecta. In particular, the broad emission lines from the inner ejecta can be separated from the narrow lines from the equatorial ring, as well as the boxy, broad lines from the reverse shock. Using this method, F13 found an increase in the H and [Ca II] lines (which fall within the F675W and F814W filters) by a factor of between 5,000 and 8,000 days. This is somewhat higher than we have found with HST (Fig. 5) and the difference gives an idea of the systematic uncertainties involved in the measurements. The main uncertainties are the contamination from the equatorial ring and differences in the fraction of ejecta contained within the slits and apertures used. The latter problem is enhanced by the fact that the ejecta brightness is highly nonuniform. The comparison between the HST and UVES results are further complicated due to the fact that we are comparing broad-band fluxes with fluxes in individual lines. However, given that the continuum is rather low (Fig. 1) this is unlikely to be the main reason for the differences. Due to all these systematic differences a direct comparison of absolute flux levels determined from HST and UVES is not meaningful.
The flux in the m line, which we measured from the SINFONI observations on days 6,816 and 8,328, has also increased, but the rather large uncertainties in the absolute flux calibration prevents us from drawing any strong conclusions from this. As already noted above, it is possible that a significant fraction of the emission at these wavelengths is still due to radioactivity.
4.3 Evolution of the morphology
4.3.1 Edge-brightened morphology due to X-ray illumination?
In this paper we have shown that the morphology of the ejecta seen in the HST images changes from an elliptical shape to a more irregular, edge-brightened geometry around the same time as the dominant energy source changes. A likely explanation for the late-time morphology is thus that it is due to the external X-ray illumination. The details of the X-ray deposition in the ejecta are discussed in some detail in F13, so here we only make some qualitative remarks that are relevant for the morphology.
The location of X-ray absorption in the ejecta depends on the X-ray spectrum. Specifically, the column density penetrated by an X-ray photon with energy is . As a result, the soft X-ray/extreme UV emission from the slow shocks in the ring will be absorbed in the outermost parts of the ejecta, while the hard emission ( keV) can penetrate further in.
As shown in Park et al. (2011) there is a considerable and increasing hard flux from the shocks in the equatorial ring. Most of the hard emission is likely to be absorbed at the boundary between the envelope and core region, where the steep density gradient and the dramatic increase in metallicity leads to an increase in the X-ray opacity (Larsson et al., 2011, F13). A central low surface brightness region, largely protected from the X-ray illumination from the ring, is therefore a natural outcome, as also demonstrated by the modeling in F13.
In view of this model it is also interesting to consider the top panel of Fig. 3, which shows the temporal evolution of the R-band morphology together with a circle that follows the homologous expansion. In most of the ejecta the emission follows the homologous flow. This is expected in both a radioactively- (or freeze-out-) dominated scenario, as well as in the case where most of the X-rays are thermalized in the steep density gradient between the envelope and the core. However, the southern part of the ejecta clearly ’expands’ faster. This could indicate a dense region moving at high velocities which was not reached by the early radioactive input, but which is now being illuminated by the X-rays.
Looking in more detail at the late-time morphology in the different bands in Fig. 4, we see that the emission appears somewhat more spatially extended in the F225W and F814W filters than in the other bands. In the former case this is likely due to the resonance scattering discussed in section 4.1. The forest of strong lines in the 2000-3000 Å region have large optical depths and may scatter emission at lower densities and thus larger radii than in the redder bands.
In the case of the F814W band the emission is dominated by the Ca [II] doublet, the Ca II triplet and the Mg II lines. The Mg II emission is likely to be a result of Ly fluorescence in the hydrogen envelope (see discussion in F13), which may result in a more extended emissivity. However, confirmation of these issues will require a detailed spectral modeling, including the X-ray input.
One possible explanation for the more centrally peaked morphology in the SINFONI images is that we are still probing the radioactive input with these observations. However, any hard X-ray emission penetrating the inner core of the ejecta would also result in stronger [Si I] and [Fe II] emission from this region compared to H. The reason for this is that the non-thermal excitation by the electrons produced in the X-ray photoionization is roughly proportional to the abundance (in contrast to thermal excitation, which is mainly temperature-dependent) and the abundance of Si and Fe is higher in the core.
In this context it is also important to point out why the morphology seen by SINFONI differs from the morphology in e.g. the F225W/F255W band, which is also dominated by metal lines. As discussed above, the emission in this band is dominated by resonance scattering in the H-rich gas. A large fraction of the UV/optical emission from the metal core will thus have its last scattering in the hydrogen envelope, while the emission at near-IR and longer wavelengths can escape directly from the core.
4.3.2 Correlation between ring and ejecta emission
If the ejecta are powered by radiation emanating from the equatorial ring, we would expect some degree of spatial correlation between the flux from the ring and the ejecta (we have already shown that the total fluxes correlate, Larsson et al. 2011). The month light travel time between the ring and the inner ejecta is, however, too short to probe with the available observations.
The first optical hot-spot appeared in the north-east part of the ring (Sonneborn et al., 1998; Lawrence et al., 2000), and a corresponding brightening can indeed be seen in the closest part of the ejecta (days 5,012 and 6,122 in Fig. 2). As more and more optical hot-spots appeared a larger fraction of the ejecta started brightening, as is apparent from Fig. 2. A caveat here is of course that the hot-spots observed in the optical/UV are produced by radiative shocks with velocities (Gröningsson et al., 2008a). They therefore mainly reflect the softest X-rays with energies keV, which are expected to be absorbed in the outermost parts of the ejecta. The resulting effect on the morphology is difficult to judge due to the low surface brightness of this region. Slow recombination (freeze-out) may also delay the optical ejecta emission compared to the X-rays from the ring.
For the harder X-rays, which are more important for the deposition further in, we have to compare with the Chandra images. A set of 0.3 - 8 keV images from day 4,711 to day 7,987 are shown in Park et al. (2007) and Racusin et al. (2009). Unfortunately, no separate images are shown for the different X-ray energies. While Chandra observations at around 5,000 days showed a different morphology above and below 1.2 keV (Park et al., 2002), Park et al. (2007) state that the later images up to 2007 show a similar morphology in the hard and soft X-ray bands.
Although the resolution of the Chandra images is considerably lower () than the HST images, we note that the brightening in the X-rays first occurred in the north-east and south-east parts of the ring (see Fig. 1 of Park et al., 2007). In particular, the north-east brightening corresponds to a similar brightening of the ejecta in the HST image at 5,012 days (Fig. 2). The south-east X-ray brightening does not, however, have a prominent correspondence in the ejecta. Possible reasons for this are noted below. The next region to brighten in the Chandra images is the north-west part, which increases dramatically between day 5,791 and day 6,533. Again, a similar evolution can be seen in the day 6,122 and day 7,226 ejecta images. The last Chandra region to turn on is the south-west, which is also followed by a brightening in the HST ejecta images after day 7,226.
To summarize, we find a fairly good correspondence between the X-rays emission from the ring and the HST images of the ejecta, as expected from the X-ray dominated scenario for the energy input. A more detailed analysis is beyond the scope of this paper, as it would have to take into account the difference in the azimuthal X-ray illumination between the soft and hard bands, the non-spherical distribution of the ejecta, as well as the possibility of dust obscuration.
4.3.3 Effects of the Ni-bubble and dust
Although it is clear that the X-ray illumination can explain the edge-brightened morphology in the HST images, it is also possible that the observed morphology is affected by the ’Ni-bubble’ or the presence of dust in the ejecta. We now discuss these alternatives in turn.
The Ni-bubble is expected to occur as a result of heating by the 56Ni decay during the first days after the explosion (e.g. Herant & Benz, 1992; Li et al., 1993; Ellinger et al., 2012). The bubble (which may be composed of many small bubbles, Li et al. 1993) has the effect of pushing the nuclear burning zones located outside the Fe core outwards, thus creating a dense shell separating the H- to O-rich zones from the Fe-rich material. This could in principle explain the difference in morphology between the SINFONI and HST images (Fig. 7).
However, we believe that this explanation is unlikely since we find that the ejecta morphology has changed considerably over the observed time interval, in contradiction with the expectation that the Ni-bubble should be frozen into the homologous expansion. An additional problem with this explanation is that the filling factor of the Ni-bubble was estimated to be only (Kozma & Fransson, 1998) within , which is likely to be too small to explain the observations. The filling factor estimated by Kozma & Fransson (1998) is smaller than the results of Li et al. (1993) (who find a filling factor of ), but the latter work assumed that no primordial Fe contributes to the line emission.
There is plenty of evidence for the formation of dust in SN 1987A, both from line profiles (Lucy et al., 1989) and thermal emission during the first years (Wooden et al., 1993), as well as recent Herschel (Matsuura et al., 2011) and sub-millimeter (Lakićević et al., 2011) observations, although the amount of dust formed is highly debated. Any dust present in the ejecta is likely to have formed in the metal-rich core of the SN, and could thus cause an obscuration of the central regions. The difference between the SINFONI and HST images could then partly be an effect of the lower extinction in the near-IR SINFONI band.
In order for this effect to be important the dust has to be optically thick in the F814W filter at m (where the hole is seen, Fig. 4), but not in the SINFONI H-band at m. The comparatively small difference in extinction between 0.85 m and 1.6 m (a factor of ) then requires that we observe at just the right epoch when these conditions are met. Since the optical depth of the dust is expected to decrease as , where is the time since explosion, substantial fine tuning is required in order for optical depth unity to be reached at years. In addition, the decrease in optical depth would be considerable during the time covered by our observations, leading to an increased transparency at H, which is not indicated in the HST images.
It is more likely that the dust is in the form of very optically thick clumps, which would give the same extinction at optical and infrared wavelengths. This is supported by the fact that the [O I] 6300, 6364 lines, which became asymmetric after about 500 days, presumably as a result of dust formation (Lucy et al., 1989) still have very similar profiles around 4,000 days (F13). These line profiles, as well as the Mg I] 4571 line (Jerkstrand et al., 2011) indicate an effective optical depth close to unity, which in the case of optically thick clumps represents a covering fraction of the clumps.
Absorption by dust in the ejecta will primarily have the effect of reducing the redshifted emission. As clearly seen in Fig. 12, the red halves of the profiles decay smoothly (and in a similar way for H and [Si I]+[Fe II]) while the blue profiles rise more sharply for [Si I]+[Fe II] . This indicates that Si/Fe is distributed in more sharply defined clumps than H, but that both components are affected by dust absorption. More definite conclusions regarding the effects of dust on the observed morphology and line profiles will have to await spatially resolved images of the dust emission in the ejecta. This will hopefully be achieved with ALMA in the near future.
4.4 Evolution of the line profiles
Our study of the ejecta spectra at different epochs does not reveal any strong temporal evolution of the line profiles. In particular, we do not see any major changes between the H profiles from day 4,571 (when radioactive decay was still dominating the energy input, Figs. 9 and 10) and day 6,355 (when the X-ray input had started to dominate, Figs. 12 and 10). We note, however, that the comparison is made difficult by the change of grating, slit width and slit orientation.
The change in the dominant energy source is not expected to produce any sudden, dramatic changes in the spectra. Both the radioactive decay and the X-ray emission result in secondary non-thermal electrons, which subsequently give rise to line emission via the same physical processes, thus producing similar spectra. (see section 4.1 above, Larsson et al. 2011 and F13). In addition, the freeze-out effect in the envelope will delay changes in the energy input. The main difference between the two phases is that the energy deposition occurs at higher ejecta velocities in the X-ray dominated phase. The location of the X-ray deposition is also likely to change with time as the ejecta expand and the X-ray light curve evolves. These changes should be reflected in the observed line profiles.
No major changes have been seen yet, as evident from a comparison of the spatially resolved profiles in Figs. 12 and 13, which show the H and [Si I]+[Fe II] emission around and days, respectively. However, the one slit that was used in the latter STIS observation does not contain the blob in the western part of the ejecta, where the strongest brightening is seen in the HST images.
An important lesson from this work is that the total line profiles of the ejecta are only slightly asymmetric (Fig. 10), despite the large asymmetries seen in the images and in the spatially resolved line profiles. The fact that such prominent asymmetries can nearly cancel out in the integrated profile highlights the uncertainties involved in trying to obtain information about the explosion geometry from the spectra of distant supernovae, where no spatial information is available.
4.5 Spatial distribution of the ejecta and implications for explosion models
All the observations that we have considered in this paper show that the ejecta morphology is highly non-spherical. There is no well-defined symmetry axis for all the emission, but it is clear from Fig. 15 that the [SiI]+[Fe II] emission is closer to the plane of the ring than perpendicular to it (as already noted by Kjær et al. 2010). The H emission is consistent with having the same distribution relative to the ring plane, but the emission extends to higher velocities than [Si I]+[Fe II]. The fact that the ejecta are preferentially distributed close to the plane of the ring has also been inferred from observations of light echoes (Sinnott et al., 2012), although it should be noted that these observations primarily probe the outermost ejecta.
We also found that there is a north-south asymmetry for both [Si I]+[Fe II] and H; the strongest emission in the southern part is concentrated closer to the plane of the sky, while the strongest emission in the northern part is closer to the plane of the ring. As discussed above, this asymmetry may be enhanced by dust absorption.
One of the main motivations for this study was to obtain information about the explosion geometry. As discussed in section 4.1 above, the observed emissivity distribution does not necessarily trace the matter distribution, but is a complex convolution of the input from radioactivity or X-rays, the density and abundance distribution, dust absorption, as well as the thermalization process.
In the case of [Si I]+[Fe II] we are clearly seeing the innermost regions of the ejecta, and it therefore seems likely that the observed emission is a reasonably good representation of the density distribution, regardless of what the dominant energy source is (see section 4.3). In the case of H it is harder to relate the observed morphology to the density distribution since the morphology changes with time, responding to changes in the energy source. However, for the X-ray dominated scenario we have argued that the hole and the ringlike structure can be interpreted in terms of the high-density core and the hydrogen envelope just outside the core, respectively. This means that the late-time observations still provide useful information about the structure of the ejecta, even though the emission is not directly proportional to the density. As discussed above, dust absorption is unlikely to significantly affect the observed morphology in other ways than reducing the intensity of the redshifted emission.
Keeping the above caveats in mind we compare the observed morphology with existing multidimensional simulations of the explosion geometry. In the absence of detailed predictions for the H and [Si I]+[Fe II] intensity distributions from these models we limit ourselves to some qualitative comparisons. The most detailed calculations of the explosion geometry are the 3D simulations by Hammer et al. (2010). These calculations start from a self-consistent explosion model which provides the initial non-spherical irregularities that act as seeds for the continued evolution. Unfortunately, the simulations do not include the heating by the 56Ni decay, which creates the ’Ni-bubble’. They are also based on a 15 progenitor, which is at the lower end of the published mass estimates for SN 1987A. Fransson & Kozma (2002) find a progenitor mass of based on the estimated O mass, while Smartt (2009) estimate a progenitor mass in the range .
Compared to similar, previous calculations in Kifonidis et al. (2006), these 3D calculations are found to give considerably more efficient velocity mixing of the different elements, including Ni-blobs with high velocities. These fast clumps have also been seen in later SPH simulations by Ellinger et al. (2012). Even though Ellinger et al. (2012) do not start from a self-consistent explosion model, they do include the 56Ni decay, and also run their simulations for a much longer time than Hammer et al. (2010), making sure that the effects of the radioactive heating are included.
Starting with the [Si I]+[Fe II] emission, we note two prominent blobs in the 3D maps shown in Fig. 15. The reduction in flux at low velocities seen in this plot is exaggerated because the interval along the line of sight was removed due to the strong contamination from the equatorial ring. However, a real decrease at low velocities is present, clearly seen in e.g. the dips on both sides of the narrow line from the ring in the northern part of the ejecta (Figs. 12 and 13). These clumps can be compared with the Hammer et al. (2010) simulations (their Figs. 2 and 3), where some prominent ’Ni’ clumps (which include both Si and Fe) extend out to high velocities. However, despite the qualitative agreement, our observations show a significantly higher degree of asymmetry on large scales. Our integrated radial distribution of emission (Fig. 16) also peaks at a higher velocity () compared to the radial mass distribution of ’Ni’ in Fig. 6 of Hammer et al. (2010)().
The observations of H in SN 1987A have lower spectral resolution and are also harder to relate to the full density distribution. We therefore limit our comparison with explosion models to two very general properties of the observed emission. These are that the H emission extends to higher velocity than [Si I]+[Fe II] and that the the emission decays more smoothly with velocity than [Si I]+[Fe II]. Both of these conclusions are in qualitative agreement with the results of Hammer et al. (2010).
From the late-time HST images we can also estimate the size scale of different structures in the ejecta, bearing in mind that this only gives projected sizes and that we cannot resolve structures smaller than . The diameter of the ’hole’ is around for all the late-time images, but the center of the hole is offset by from the center of the remnant. The width of the ring-like structure corresponds to a velocity width between . As noted above, we may identify the faint, central regions with the high-density core and the ring structure with the hydrogen envelope just outside the core. The brightest emission in the SINFONI images is close to the faintest regions in the HST images, in agreement with this interpretation.
In terms of studies of other young supernova remnants the most detailed results regarding the ejecta structure have been obtained in the case of Cas A (Fesen et al., 2006; DeLaney et al., 2010; Hwang & Laming, 2012). A comparison with our results is not straightforward since both the supernova type and the type of observational data available are different. In particular, the fact that Cas A was a type IIb SN (Krause et al., 2008) means that the H mass was very small; something which will strongly affect both expansion velocities and instabilities (Iwamoto et al., 1997). Compared to SN 1987A, the Cas A observations have dramatically higher spatial resolution, and also differ from our observations in that most of the observed emission comes from ejecta passing the reverse shock. Despite these differences, it is interesting to note that the knots, jets and pistons in Cas A have been suggested to have a flattened distribution (DeLaney et al., 2010). While we do not detect the same type of structures, we find that the ejecta in SN 1987A also have a flattened distribution.
In summary, we find reasonable qualitative agreement with the models, but we stress that a more detailed comparison requires both more realistic spectral modeling, as well as explosion simulations with parameters matching SN 1987A and all physical effects included. In terms of observations, future ALMA observations of the spatial distribution of dust and molecules will help reduce uncertainties about the three-dimensional ejecta distribution. HST STIS observations with narrow slits covering the full ejecta would also greatly improve the comparison between the [Si I]+[Fe II] and H emission.
5 Conclusions
We have studied the morphology of the ejecta of SN 1987A using HST images obtained between day 2,770 and 8,328. In addition, we have obtained information about the 3D geometry from HST STIS spectra (for three epochs after 4,500 days) and SINFONI integral field spectroscopy (for two epochs after 6,800 days). The HST imaging covers the interval, while the STIS spectra mainly probe the H emission. For the SINFONI data we focused on the m [Si I]/[Fe II] emission. Our main conclusions are as follows:
-
•
There is a strong temporal evolution of the morphology in the HST images, from a roughly elliptical shape before days, to a more irregular, edge-brightened morphology (with a ’hole’ in the middle) thereafter. The transition is most likely due to the fact that X-ray emission from the equatorial ring starts to dominate the energy input to the ejecta at this point, with most of the X-rays being absorbed at the boundary between the envelope and core region. We find that other effects, from either the Ni-bubble or dust, are unlikely to significantly effect the morphology. The X-ray input also results in a brightening of the ejecta, as we have previously shown in Larsson et al. (2011). We note that the change in morphology and the late-time brightening is observed in all five broad HST filters between and , with the largest increase in flux occurring at the shortest wavelengths.
-
•
The SINFONI images of the m [Si I]+[Fe II] emission show a more uniform morphology, with the brightest regions appearing close to the faintest, central regions of the HST images. This may be due to a remaining significant contribution from radioactive decay in the inner part of the ejecta. However, because of the high abundances of Si and Fe in the core, a similar morphology would also be expected if there is a significant hard X-ray flux reaching the innermost ejecta. Accurate flux measurements at these wavelengths over the coming years are needed in order to determine what the dominant energy source is.
-
•
The STIS H and SINFONI m [Si I]+[Fe II] line profiles are similar in the sense that they show predominantly blueshifted emission in the north and predominantly redshifted emission in the south, showing that the ejecta have a flattened distribution fairly close to the plane of the equatorial ring. There is also a north-south asymmetry: the emission in the northern half of the ejecta is concentrated around the plane of the ring, while the emission in the southern part is mostly above the ring, closer to the plane of the sky. This asymmetry may partly be due to dust absorption in the far side of the ejecta, as suggested by the smooth decrease of the redshifted emission. The H and m [Si I]+[Fe II] profiles differ in that the H emission extends to higher velocities, as expected from the differences between the images.
-
•
Three-dimensional emissivity maps of the [Si I]+[Fe II] line constructed from the SINFONI observations reveal that most of the emission from these elements is concentrated to two clumps in the velocity interval . We do not have the spatial or spectral resolution to estimate the size of clumps from the H spectra, but in the HST images there is substructure with projected velocity widths of (the diameter of the ’hole’) to (the thickest part of the ring structure).
-
•
We have compared our results with the explosion models by Hammer et al. (2010). While there is some qualitative agreement, we also found that the observations show a higher degree of large-scale asymmetry than the simulation. We stress, however, that this explosion model was not set up specifically to model SN 1987A and that radioactive heating was not included. In terms of explosion models we also note that the observed distribution of emission is inconsistent with a jet-like structure perpendicular to the equatorial ring. However, this does not necessarily rule out explosion models where most of the energy (but not ejecta) comes out along the poles.
References
- Blinnikov et al. (2000) Blinnikov, S., Lundqvist, P., Bartunov, O., Nomoto, K., & Iwamoto, K. 2000, Astrophys. J., 532, 1132
- Cardelli et al. (1989) Cardelli, J. A., Clayton, G. C., & Mathis, J. S. 1989, Astrophys. J., 345, 245
- DeLaney et al. (2010) DeLaney, T., Rudnick, L., Stage, M. D., et al. 2010, Astrophys. J., 725, 2038
- Dwek et al. (2010) Dwek, E., Arendt, R. G., Bouchet, P., et al. 2010, Astrophys. J., 722, 425
- Ellinger et al. (2012) Ellinger, C. I., Young, P. A., Fryer, C. L., & Rockefeller, G. 2012, Astrophys. J., 755, 160
- Fesen et al. (2006) Fesen, R. A., Hammell, M. C., Morse, J., et al. 2006, Astrophys. J., 645, 283
- France et al. (2011) France, K., McCray, R., Penton, S. V., et al. 2011, Astrophys. J., 743, 186
- Fransson & Kozma (1993) Fransson, C., & Kozma, C. 1993, Astrophys. J., 408, L25
- Fransson & Kozma (2002) —. 2002, New A Rev., 46, 487
- Fruchter & Hook (2002) Fruchter, A. S., & Hook, R. N. 2002, PASP, 114, 144
- Garnavich et al. (1997) Garnavich, P., Kirshner, R., & Challis, P. 1997, IAU Circ., 6710, 2
- Grebenev et al. (2012) Grebenev, S. A., Lutovinov, A. A., Tsygankov, S. S., & Winkler, C. 2012, Nature, 490, 373
- Gröningsson et al. (2008a) Gröningsson, P., Fransson, C., Leibundgut, B., et al. 2008a, Astron. Astrophys., 492, 481
- Gröningsson et al. (2008b) Gröningsson, P., Fransson, C., Lundqvist, P., et al. 2008b, Astron. Astrophys., 479, 761
- Hammer et al. (2010) Hammer, N. J., Janka, H.-T., & Müller, E. 2010, Astrophys. J., 714, 1371
- Hanuschik & Thimm (1990) Hanuschik, R. W., & Thimm, G. J. 1990, Astron. Astrophys., 231, 77
- Helder et al. (2013) Helder, E. A., Broos, P. S., Dewey, D., et al. 2013, Astrophys. J., 764, 11
- Herant & Benz (1992) Herant, M., & Benz, W. 1992, Astrophys. J., 387, 294
- Hwang & Laming (2012) Hwang, U., & Laming, J. M. 2012, Astrophys. J., 746, 130
- Iwamoto et al. (1997) Iwamoto, K., Young, T. R., Nakasato, N., et al. 1997, Astrophys. J., 477, 865
- Jeffery (1991) Jeffery, D. J. 1991, Astrophys. J., 375, 264
- Jerkstrand et al. (2011) Jerkstrand, A., Fransson, C., & Kozma, C. 2011, Astron. Astrophys., 530, A45
- Kifonidis et al. (2006) Kifonidis, K., Plewa, T., Scheck, L., Janka, H.-T., & Müller, E. 2006, Astron. Astrophys., 453, 661
- Kjær et al. (2010) Kjær, K., Leibundgut, B., Fransson, C., Jerkstrand, A., & Spyromilio, J. 2010, Astron. Astrophys., 517, A51
- Kozma & Fransson (1992) Kozma, C., & Fransson, C. 1992, Astrophys. J., 390, 602
- Kozma & Fransson (1998) —. 1998, Astrophys. J., 497, 431
- Krause et al. (2008) Krause, O., Birkmann, S. M., Usuda, T., et al. 2008, Science, 320, 1195
- Lakićević et al. (2011) Lakićević, M., van Loon, J. T., Patat, F., Staveley-Smith, L., & Zanardo, G. 2011, Astron. Astrophys., 532, L8
- Larsson et al. (2011) Larsson, J., Fransson, C., Östlin, G., et al. 2011, Nature, 474, 484
- Lawrence et al. (2000) Lawrence, S. S., Sugerman, B. E., Bouchet, P., et al. 2000, Astrophys. J., 537, L123
- Li et al. (1993) Li, H., McCray, R., & Sunyaev, R. A. 1993, Astrophys. J., 419, 824
- Lucy et al. (1989) Lucy, L. B., Danziger, I. J., Gouiffes, C., & Bouchet, P. 1989, in Lecture Notes in Physics, Berlin Springer Verlag, Vol. 350, IAU Colloq. 120: Structure and Dynamics of the Interstellar Medium, ed. G. Tenorio-Tagle, M. Moles, & J. Melnick, 164
- Maeda et al. (2008) Maeda, K., Kawabata, K., Mazzali, P. A., et al. 2008, Science, 319, 1220
- Matsuura et al. (2011) Matsuura, M., Dwek, E., Meixner, M., et al. 2011, Science, 333, 1258
- Mattila et al. (2010) Mattila, S., Lundqvist, P., Gröningsson, P., et al. 2010, Astrophys. J., 717, 1140
- Meikle et al. (1987) Meikle, W. P. S., Matcher, S. J., & Morgan, B. L. 1987, Nature, 329, 608
- Meikle et al. (1993) Meikle, W. P. S., Spyromilio, J., Allen, D. A., Varani, G.-F., & Cumming, R. J. 1993, Mon. Not. Roy. Astron. Soc., 261, 535
- Milisavljevic et al. (2010) Milisavljevic, D., Fesen, R. A., Gerardy, C. L., Kirshner, R. P., & Challis, P. 2010, Astrophys. J., 709, 1343
- Morris & Podsiadlowski (2007) Morris, T., & Podsiadlowski, P. 2007, Science, 315, 1103
- Müller et al. (2012) Müller, B., Janka, H.-T., & Heger, A. 2012, Astrophys. J., 761, 72
- Nisenson et al. (1987) Nisenson, P., Papaliolios, C., Karovska, M., & Noyes, R. 1987, Astrophys. J., 320, L15
- Park et al. (2007) Park, S., Burrows, D. N., Garmire, G. P., et al. 2007, in American Institute of Physics Conference Series, Vol. 937, Supernova 1987A: 20 Years After: Supernovae and Gamma-Ray Bursters, ed. S. Immler, K. Weiler, & R. McCray, 43–50
- Park et al. (2002) Park, S., Burrows, D. N., Garmire, G. P., et al. 2002, Astrophys. J., 567, 314
- Park et al. (2011) Park, S., Zhekov, S. A., Burrows, D. N., et al. 2011, Astrophys. J., 733, L35
- Racusin et al. (2009) Racusin, J. L., Park, S., Zhekov, S., et al. 2009, Astrophys. J., 703, 1752
- Ramachandran & Varoquaux (2011) Ramachandran, P., & Varoquaux, G. 2011, Computing in Science & Engineering, 13, 40
- Rest et al. (2008) Rest, A., Welch, D. L., Suntzeff, N. B., et al. 2008, Astrophys. J., 681, L81
- Rest et al. (2011) Rest, A., Foley, R. J., Sinnott, B., et al. 2011, Astrophys. J., 732, 3
- Sinnott et al. (2012) Sinnott, B., Welch, D. L., Rest, A., Sutherland, P. G., & Bergmann, M. 2012, ArXiv:1211.3781
- Smartt (2009) Smartt, S. J. 2009, ARA&A, 47, 63
- Sonneborn et al. (1998) Sonneborn, G., Pun, C. S. J., Kimble, R. A., et al. 1998, Astrophys. J., 492, L139
- Taubenberger et al. (2009) Taubenberger, S., Valenti, S., Benetti, S., et al. 2009, Mon. Not. Roy. Astron. Soc., 397, 677
- Tziamtzis et al. (2011) Tziamtzis, A., Lundqvist, P., Gröningsson, P., & Nasoudi-Shoar, S. 2011, Astron. Astrophys., 527, A35
- Utrobin et al. (1995) Utrobin, V. P., Chugai, N. N., & Andronova, A. A. 1995, Astron. Astrophys., 295, 129
- Wang & Wheeler (2008) Wang, L., & Wheeler, J. C. 2008, ARA&A, 46, 433
- Wang et al. (2002) Wang, L., Wheeler, J. C., Höflich, P., et al. 2002, Astrophys. J., 579, 671
- Wooden et al. (1993) Wooden, D. H., Rank, D. M., Bregman, J. D., et al. 1993, Astrophys. J. Supp., 88, 477
- Xu & McCray (1991) Xu, Y., & McCray, R. 1991, Astrophys. J., 375, 190
- Zanardo et al. (2010) Zanardo, G., Staveley-Smith, L., Ball, L., et al. 2010, Astrophys. J., 710, 1515
| Date | Days since explosion111987 February 23 | Instrument | Filter | Exposure time |
|---|---|---|---|---|
| (s) | ||||
| 1994-09-24 | 2,770 | WFPC2 | F675W | 600 |
| 1998-02-06 | 4,001 | WFPC2 | F675W | 400 |
| 2000-11-13 | 5,012 | WFPC2 | F255W | 5,600 |
| 2000-11-13 | 5,012 | WFPC2 | F336W | 2,000 |
| 2000-11-13 | 5,012 | WFPC2 | F439W | 1,200 |
| 2000-11-13 | 5,012 | WFPC2 | F555W | 800 |
| 2000-11-13 | 5,012 | WFPC2 | F675W | 2,400 |
| 2000-11-13 | 5,012 | WFPC2 | F814W | 800 |
| 2003-11-28 | 6,122 | ACS HRC | F625W | 800 |
| 2006-12-06 | 7,226 | ACS HRC | F625W | 1,200 |
| 2009-12-12 | 8,328 | WFC3 | F225W | 800 |
| 2009-12-12 | 8,328 | WFC3 | F336W | 800 |
| 2009-12-12 | 8,328 | WFC3 | F438W | 800 |
| 2009-12-12 | 8,328 | WFC3 | F555W | 400 |
| 2009-12-12 | 8,328 | WFC3 | F625W | 3,000 |
| 2009-12-12 | 8,328 | WFC3 | F814W | 400 |
| Date | Days since explosion111987 February 23 | Grating | Slit width | Slit PA | Exposure time |
|---|---|---|---|---|---|
| (arcsec) | (degrees east of north) | (s) | |||
| 1999-02-21 | 4,381 | G750L | 0.5 | 25.6 | 10,500 |
| 1999-08-30 | 4,571 | G750M22Central wavelength setting 6581 Å | 0.1 | 27.0 | 7,804 |
| 1999-08-30 | 4,571 | G750M22Central wavelength setting 6581 Å | 0.1 | 27.0 | 7,804 |
| 1999-08-31 | 4,572 | G750M22Central wavelength setting 6581 Å | 0.1 | 27.0 | 7,804 |
| 2004-07-18 | 6,355 | G750L | 0.2 | 179.7 | 5,468 |
| 2004-07-18 | 6,355 | G750L | 0.2 | 179.7 | 5,468 |
| 2004-07-23 | 6,360 | G750L | 0.2 | 179.7 | 5,468 |
| 2010-01-31 | 8,378 | G750L | 0.2 | 179.7 | 14,200 |