-titleAgeing low mass stars: from red giants to white dwarfs 11institutetext: INAF-IAPS Roma, Italy 22institutetext: INAF- Osservatorio Astrofisico di Catania, Italy 33institutetext: Sydney Institute for Astronomy, School of Physics, University of Sydney, Australia 44institutetext: Instituut voor Sterrenkunde, Katholieke Universiteit Leuven, Belgium 55institutetext: AIM, CEA/DSM-CNRS-Université Paris Diderot, IRFU/Sap., Certre de Saclay, France 66institutetext: School of Physics and Astronomy, University of Birmingam, UK 77institutetext: Astronomical Institute Anton Pannekoek, University of Amsterdam, The Netherlands 88institutetext: LESLIA, CNRS, Université Pierre et Marie Curie, Université Denis Diderot, Observatoire de Paris, Meudon Cedex, France 99institutetext: Department of Physics and Astronomy, Aarhus University, Denmark
Internal rotation of red giants by asteroseismology
Abstract
We present an asteroseismic approach to study the dynamics of the stellar interior in red-giant stars by asteroseismic inversion of the splittings induced by the stellar rotation on the oscillation frequencies. We show preliminary results obtained for the red giant KIC4448777 observed by the space mission Kepler.
1 Asteroseismic data
The red giant KIC4448777 has been continuously observed by the Kepler satellite for 670 days in long-cadence mode (integration time of 30 min). The Fourier analysis of the long time series has shown a clear power excess between 180–260 Hz (Fig. 1) and allowed us to identify 58 individual modes characterized by a mean large frequency separation Hz, a true period spacing s RefBe and a frequency of the maximum amplitude of the smoothed excess power of Hz. The observed modes are =0 pure acoustic modes, and =1, =2 and =3 modes with mixed gravity–pressure character.

2 Rotational splittings
The stellar rotation breaks the spherical symmetry of the structure of the star and splits the frequencies of normal modes in (2+1) components. Fig. 1 shows that the spectrum of KIC4448777 is characterized by the presence of 15 rotational splittings for =1. As it has been noticed by RefB , the observed rotational splittings are not constant for consecutive dipole modes (see lower panel of Fig. 1): splittings are larger for modes with larger gravity component which sound better the core. This indicates that the core of this star is rotating faster than the upper layers. In order to quantify the internal rotation it is possible to invert the following equation, obtained by applying a standard perturbation theory to the eigenfrequencies, relating the splittings to the internal rotation (r):
| (1) |
where are the mode kernel functions calculated on the unperturbed eigenfunctions for the modes of the ’best’ model of the star and is the photospheric stellar radius.
Table 1: Atmospheric parameters. 11.56 (K) 4750 250 log g (dex) 3.5 0.5 0.23 0.12 (km/s) 5 Table 2: Parameters of the best fitting models. Model 1 Model 2 1.02 1.13 (K) 4800 4735 log g (dex) 3.26 3.27 3.94 4.08 7.39 7.50 0.022 0.032
3 Results and conclusion
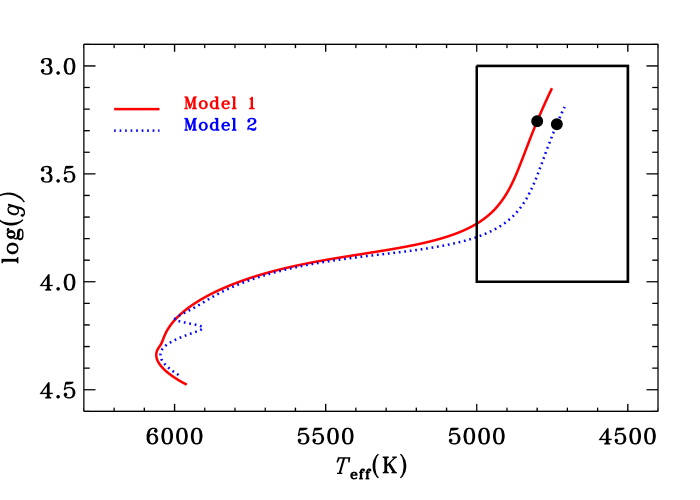
The theoretical structure models which better reproduce the identified pulsational frequencies have been calculated by using the ASTEC evolution code RefC1 assuming the basic atmospheric parameters given in the Table 2. These parameters have been obtained by the analysis of the spectra taken with the Hermes spectograph RefHe mounted to the 1.2 m Mercator telescope. Adiabatic oscillation frequencies were calculated by using the ADIPLS code RefC2 and corrected for the surface effect by using the relation proposed by RefK . The mass, the effective temperature, the gravity, the surface radius, the luminosity and the initial metallicity of the two models which best fit the observations are given in Table 2. These values indicate that this star is in the hydrogen-shell burning phase (see Fig. 2), as predictable from the period spacing.
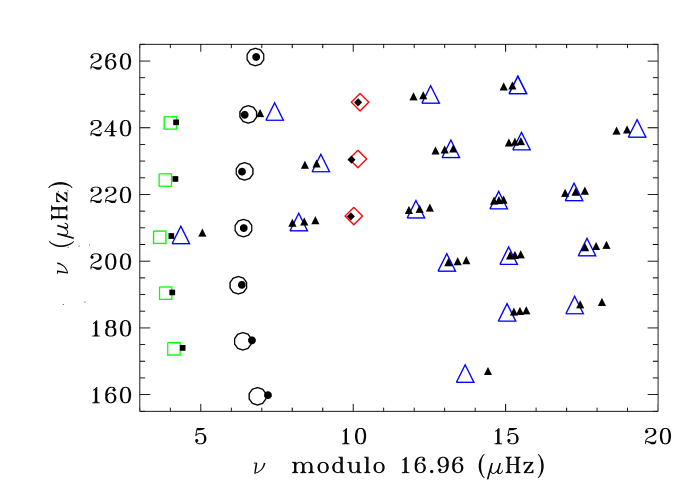

Figure 3 shows the echelle diagram obtained for one of the best fitting models. We plan to invert Eq. 1 by using both the OLA (Optimally localized Averaging) and the SOLA (Subtractive Optimally Localized Averaging) techniques which were successfully applied to the Sun (see e.g. RefP ; RefD1 ). These allow to estimate a localized weighted average of making attempts to fit the averaging kernels to a function of fixed width and centered at a chosen value of radius. Results will give us quantitative information on the differential rotation of the interior of the examined star.
References
- (1) T. R. Bedding, B. Mosser, D. Huber et al. Nature 471, (2011) 608-611
- (2) P. G. Beck, J. Montalban, T. Kallinger, J. De Ridder et al., Nature 481, (2012) 55-57
- (3) J. Christensen-Dalsgaard, ApSS 316, (2008) 13-24
- (4) G. Raskin, H. van Winckel, H. Hensberge, et al., A&A 526, (2011) 69-81
- (5) J. Christensen-Dalsgaard, ApSS 316, (2008) 113-120
- (6) H. Kjeldsen, T. R. Bedding, J. Christensen-Dalsgaard, ApJ 683, (2008) L175-L178
- (7) L. Paternó, S. Sofia, M. P. Di Mauro, A&A 314, (1996) 940-946
- (8) M. P. Di Mauro and W. A. Dziembowski, Mem. Sait 69, (1998) 559-562