Production of W and Z bosons at hadron colliders
Abstract
The article summarizes the main recent measurements related to production of the W and Z bosons at the Tevatron and the LHC experiments. The results of the measurements are compared to the standard model predictions.
1 Introduction
The measurements of the W and Z bosons production in hadron-hadron collisions provide an important test of the standard model (SM) of particle physics. Study of the W and Z production is also important, since this is a major source of background for searches for new physics beyond SM. The theoretical predictions of the inclusive W and Z cross sections are available at next-to-next-to-leading order (NNLO) in perturbative QCD. The calculations are limited by uncertainties on parton distribution functions (PDFs), higher-order QCD, and electroweak radiative corrections, which are available at next-to-leading order (NLO).
This article gives a short overview of the most recent measurements from the Tevatron experiments (CDF and D0), with the total integrated luminosity of collisions at TeV of up to 10.5 fb-1, and from the LHC experiments (ATLAS, CMS, LHCb), with approximately 5 fb-1 of pp collisions collected at each 7 and 8 TeV center-of-mass energies.
2 Inclusive W and Z production
2.1 Measurements of inclusive W and Z production cross sections
The most recent measurement of the inclusive W and Z production cross sections was performed at the LHC in pp collisions collected in 2012 at TeV and corresponding to an integrated luminosity of pb−1 [1]. The LHC instantaneous luminosity increased dramatically compared to the dataset used for the first measurements at 7 TeV [2, 3], from to , and the average number of inelastic proton-proton interactions (pileup) increased from two up to twenty. Since the precision measurement requires a low pileup and triggers with low transverse momentum thresholds, the instantaneous luminosity was decreased by approximately a factor of ten in a dedicated LHC configuration. The LHC beams were separated in the transverse plane to diminish the effective overlap. The working point was chosen to allow manageable rates with an unprescaled single lepton trigger with sufficiently loose requirements, and at the same time yielding a low average pileup.
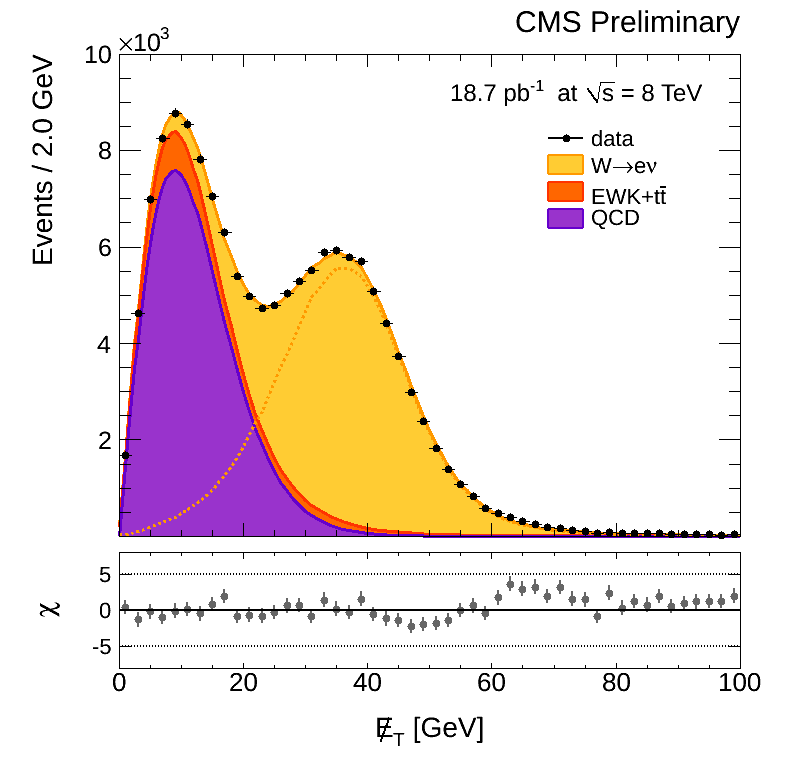
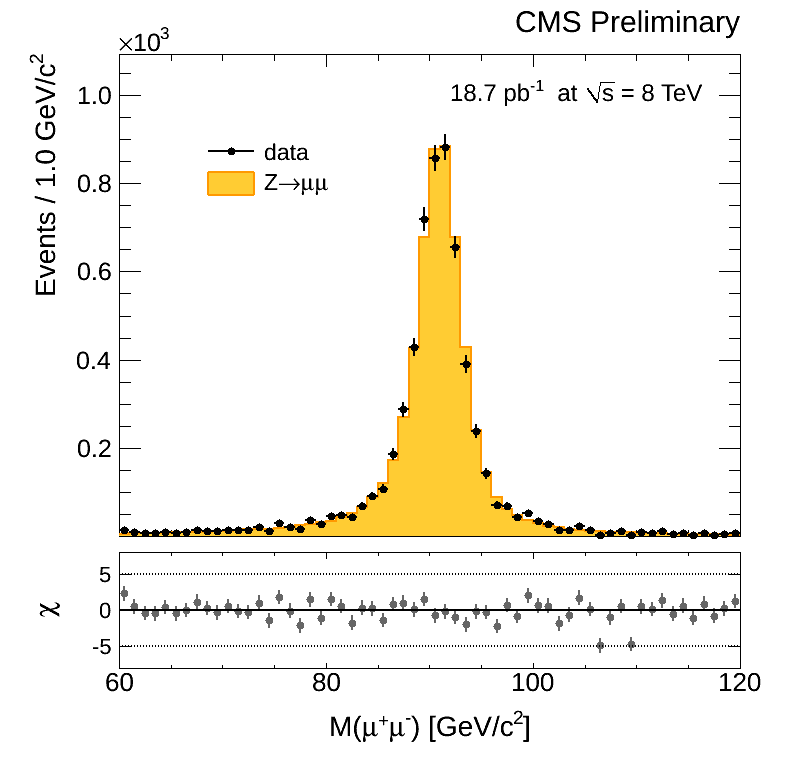
Leptonic W boson decays are characterized by a prompt, energetic, and isolated lepton and a neutrino giving rise to significant missing transverse energy, . The distribution for the selected events is presented in Fig. 1(left). The Z boson decays to leptons are selected based on two energetic and isolated leptons. The reconstructed dilepton mass is used to estimate efficiencies and measure event yields, and is presented in Fig. 1(right) for the decay channel.
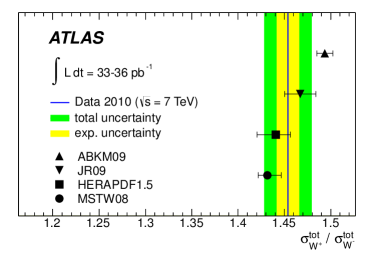
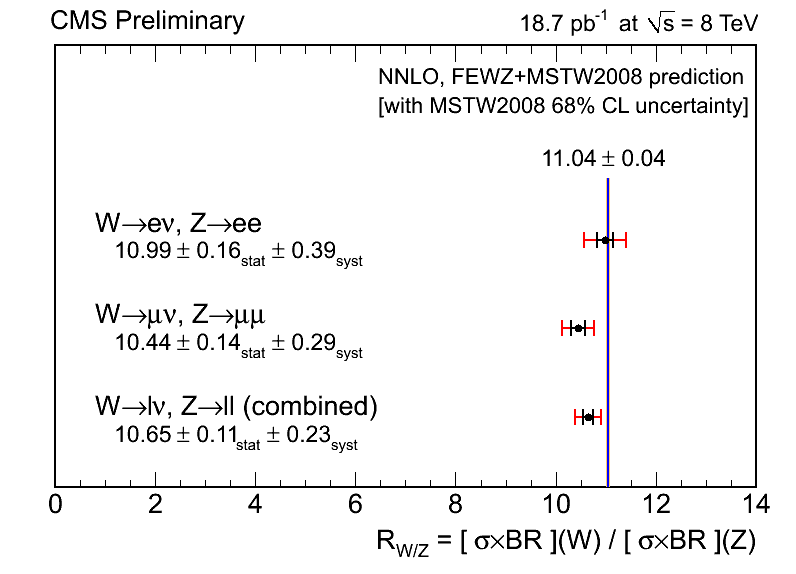
Assuming lepton universality, the measurements in the different lepton decay modes are combined by calculating an average value weighted by the combined statistical and systematic uncertainties, taking into account the correlated uncertainties. The most powerful way to compare the measured values and theoretical predictions are the ratios of cross sections, where some of the systematic uncertainties cancel. Figure 2 presents the summary of the CMS measurements of the ratios of the W to Z production cross sections and ATLAS measurements at 7 TeV of the . The measurements at both 7 and 8 TeV agree well with the standard model predictions.
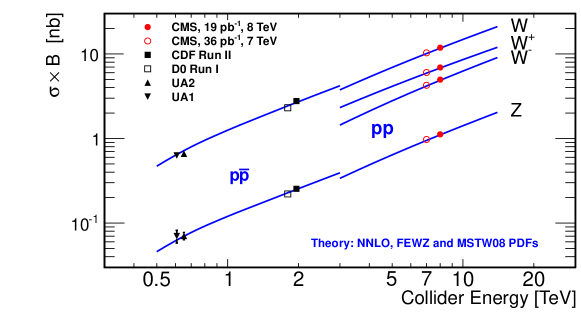
The 7 and 8 TeV measurements are compared to the results of the low-energy experiments in Fig. 3. The ATLAS measurements at 7 TeV are not presented but they agree well with the corresponding CMS points. The NNLO predictions describe the data in the whole center-of-mass range.
2.2 Study of differential distributions
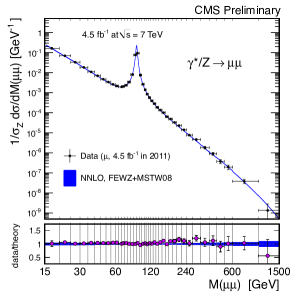
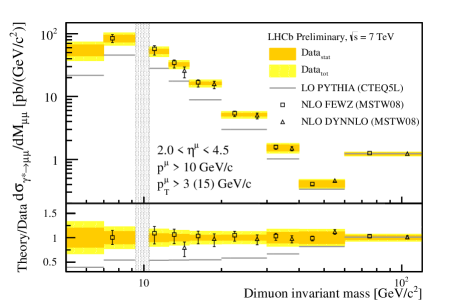
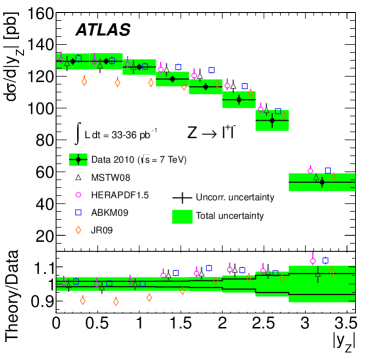
Theoretical calculations of the differential cross section of the Drell-Yan (DY) production, , and the double-differential cross section, , where M is the dilepton invariant mass, and Y is the absolute value of the dilepton rapidity are well established up to the NNLO. Comparisons between theoretical calculations and experimental measurements provide important constrains on the PDFs. The measurements presented in Fig. 4 are performed with CMS dataset consisting of 4.5 fb-1 of proton-proton collision data in the dimuon channel collected at the LHC at a centre-of-mass energy of TeV [4]. The measurements are normalized to the Z peak region (60 - 120 GeV), which cancels out the uncertainty on the integrated luminosity and reduces the PDF uncertainty on acceptance, the pileup effect in the reconstruction efficiency and the uncertainty on the efficiency estimation. The NNLO predictions describe the mass spectrum generally well. The right plot presents LHCb measurements [5] and effect of using different orders of theoretical calculations on the final cross section.
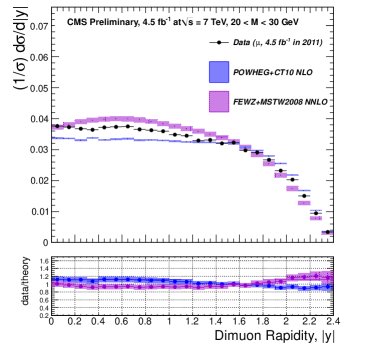
In the double differential cross section presented in Fig. 5(left) at low dilepton masses the agreement between data and theory becomes pure. The difference in predictions due to different PDFs, as shown in Fig. 5(right), makes the measurement important for the future PDF constrains.
2.3 Measurements of the W charge asymmetry and polarization
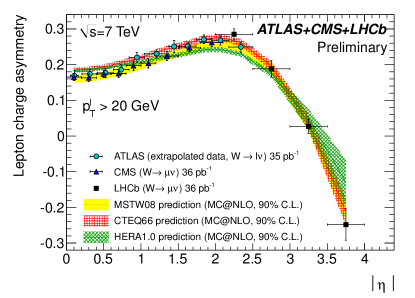
The W boson charge asymmetry is mainly sensitive to valence quark distributions via the dominant production process . In pp collisions the production rate of W+ bosons is significantly larger than the corresponding W- rate. The asymmetry is defined as
Figure 6 shows the lepton charge asymmetry from W-boson decays in bins of absolute pseudorapidity for the three LHC experiments. While the ATLAS data show the extrapolated combined asymmetry for muon and electron measurements, the LHCb and CMS measurements have been performed using only the decay channel. In this plot the maximum of the asymmetry around can be seen very well as the turn-over in asymmetry, which takes negative values above . This behaviour is related to the kinematics of the V-A decay of the W boson, its polarisation and the different fractions of the W+ and W- bosons produced via high- sea quarks. The measured asymmetry is well described by the predictions with different PDFs.
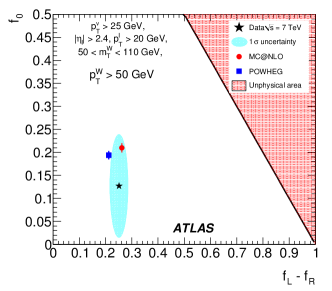
At the LHC the quarks generally carry a larger fraction of the momentum of the initial-state protons than the antiquarks. This causes the W bosons to be boosted in the direction of the initial quark. In the massless quark approximation, the quark must be left-handed and the antiquark right-handed. For more centrally produced W bosons, there is an increasing probability that the antiquark carries a larger momentum fraction than the quark, so the helicity state of the W bosons becomes a mixture of left- and right-handed states whose proportions are respectively described with fractions and . At high transverse momenta more complex production mechanisms contribute, and polarisation in longitudinal states, , is also possible. This state is particularly interesting as it is directly connected to the massive character of the gauge bosons. The measured values of and from [7] are presented in Fig. 6(right) together with the NLO theoretical predictions. The results show that predictions reproduce well the relative fractions of the left- and right-handed states, but the data favour lower values of than predicted. Similar CMS measurements can be found in [8].
2.4 Measurements of the DY forward-backward asymmetry and effective weak mixing angle
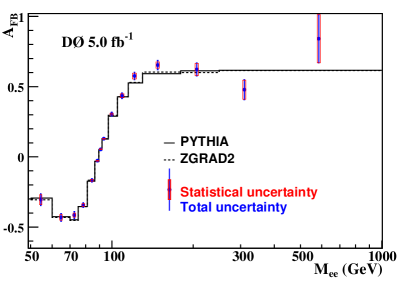
In the SM, the DY production occurs to first order via annihilation into a real (or virtual) Z boson or a virtual photon (). While the coupling of a fermion to the photon is purely a vector coupling, the coupling of the same fermion to the Z boson has both vector and axial-vector components. The presence of both vector and axial-vector couplings gives rise to an asymmetry in the distribution of the polar angle of the negatively charged lepton relative to the incoming quark direction in the rest frame of the lepton pair. Events with are classified as forward (F), and those with are classified as backward (B). The forward-backward charge asymmetry, , is defined by
where and are the cross sections for forward and backward processes, respectively. The measured by D0 [9] and predicted values of are compared in Fig. 7(left) as a function of the dilepton mass. Around the Z pole, the asymmetry is proportional to both the vector and axial-vector couplings of the Z boson to the fermions and is numerically close to 0. At large invariant mass, the asymmetry is dominated by Z/ interference and is almost constant (). In the high mass region, the measurement can be used to investigate possible new phenomena that may alter , such as new neutral gauge bosons or large extra dimensions, which are not yet observed in data.
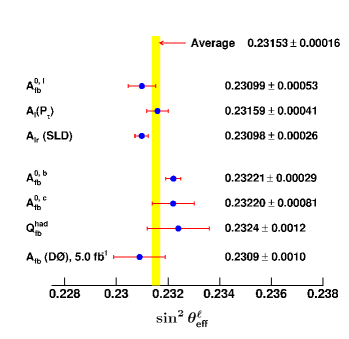
In the vicinity of the Z pole, is sensitive to the effective weak mixing angle for each fermion species () involved in a particular measurement. The comparison on the measured in [9] value to those measured in other experiments is shown in Fig. 7(right). The recent DY forward-backward asymmetry measurement at CMS [10] also showed no evidence for new physics at high masses. The week mixing angle was measured to be in a good agreement with the previous measurements.
3 Diboson production
Many extensions of the SM predict new scalar, vector, or spin-2 particles that decay into a pair of W or Z bosons. In addition, these final states are sensitive to the self-interactions among the gauge bosons via trilinear gauge couplings (TGCs). The values of these couplings are fully determined in the SM by the gauge structure of the Lagrangian. The presence of anomalous neutral trilinear couplings (ATGCs) would lead to a sizable signal enhancement in the cross sections via -channel scattering.
3.1 W and Z production
The cross sections of the W and Z processes are often measured as a function of the photon threshold. Assuming lepton universality for the W and Z boson decays, the measured cross sections in the electron and muons channels are combined to reduce the statistical uncertainty. The MCFM [11] program is commonly used to predict the NLO cross section. It includes photons from direct diboson production, from final state radiation off the leptons in the W/Z decays and from quark/gluon fragmentation into an isolated photon. Possible effects of composite W and Z boson structure can be simulated through the introduction of ATGCs.
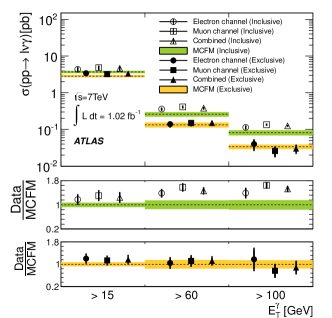
The recent measurements from ATLAS [12] quoted inclusive cross section, using only the lepton and photon selection cuts, and exclusive, requiring no jet with GeV in the final state. Figure 8 presents a summary of W production measurements made in this study and the corresponding SM expectations. There is a good agreement between the measured cross sections for the exclusive events and the MCFM prediction. For inclusive production, the MCFM NLO cross section prediction includes real parton emission processes only up to one radiated quark or gluon. The lack of higher-order QCD contributions results in an underestimation of the predicted cross sections, especially for events with high- photons, which have significant contributions from multijet final states.
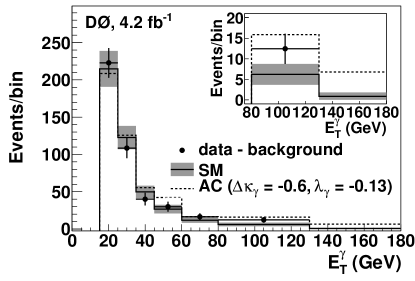
The spectra of high energy photons in W and Z events are sensitive to new phenomena that alter the couplings among the gauge bosons. These effects can be described by modifying the WW coupling from its SM value of one and adding terms with new couplings. The photon distribution in Fig. 8(right) shows a good agreement between data [13] and the SM predictions and used to derive limits on WW ATGC using a binned likelihood fit to data. The 95% CL limits on the WW coupling parameters and were obtained by setting one coupling parameter to the SM value and allowing the other to vary. More information can also be found in [14, 15].
3.2 WW production
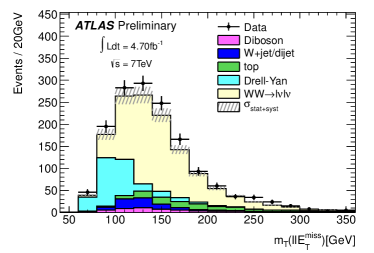
A measurement of the WW production, which has a higher cross section than other diboson channels, suffers also from high background contributions. In 1524 observed candidate events in 4.7 fb-1 of pp collisions at LHC, ATLAS estimated 531 background events [16]. After applying selections on leptons, the dominant contribution () to and events comes from the inclusive Z production. To reduce this background and the background contribution from hadronic multijets, the invariant mass of any dilepton pair is required to exceed 15 GeV and is not allowed to be within 15 GeV of the Z mass. Further suppression of background events is achieved by applying a cut on the minima . Suppression of the top contribution is achieved by rejecting events containing more than 1 jet with GeV and , or containing b-tagged jets. The distributions of transverse mass of the dilepton and system after all the selections is shown in Fig. 9(left), where
where is the difference in azimuth between and . The data and the predicted distributions are in good agreement.
3.3 WZ production
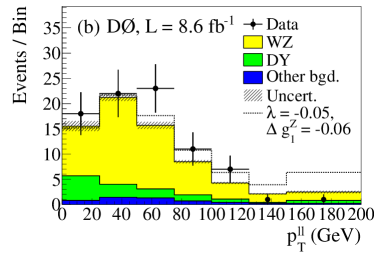
The WZ cross section measurements performed by CDF and D0 showed a good agreement with the SM expectations. The CDF measurement [21] of pb agrees well with pb predicted by MCFM. For the D0 measurements see [20]. The ATLAS [19] and CMS [23] measurements at 7 TeV also agree with each other and with the SM predictions. Study of WWZ ATGCs in production at D0 [22] used the reconstructed transverse momentum of the two leptons () originating from the Z boson. The effect of ATGCs is to increase the production cross section, especially at high boson transverse momentum, relative to its SM prediction, as shown in Fig. 9 (right). Summary of the limits on ATGCs measured in the WZ production can be found in [19].
3.4 ZZ production
Production of the ZZ final states, which was always statistically limited at the Tevatron, profits at the LHC from both, increase in the luminosity and in the center-of-mass energy. Even if the main ZZ channel at the LHC remains the , ATLAS reported the cross section measurement using also decay channel [24]. It is also important to mention, that working on the ZZ, CMS reported a first observation of the Z boson decaying to four leptons in proton-proton collisions [25]. A pronounced resonance peak of 26 events was observed in the mass window 80-100 GeV in the invariant mass distribution of four leptons with its mean and width consistent with the Z boson, as shown in Fig. 10(left). The product of the measured cross section and branching fraction, fb, is consistent with the SM prediction of 126 fb.
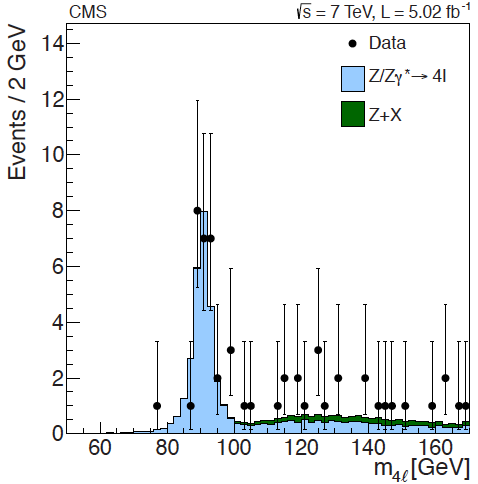
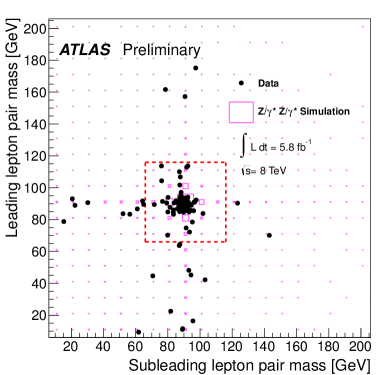
Figure 10(right) shows relationship between reconstructed dilepton masses of the highest- Z candidates and the trailing one in decay channel with [28]. For the cross section measurements only events are used with GeV for CMS(ATLAS).
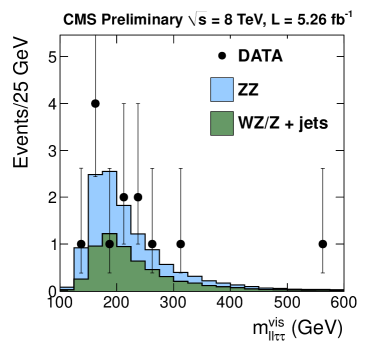
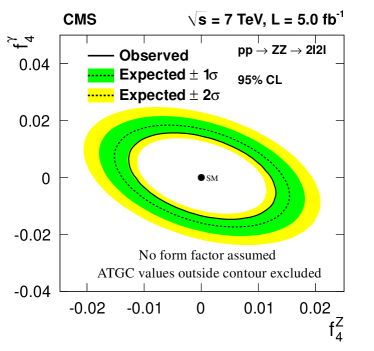
In the CMS paper the ZZ cross section was measured aslo using decay mode. The invariant mass of the system is presented in Fig. 11(left). Finally limits on ZZZ and ZZ ATGCs are set as presented in Fig. 11(right). All the recent CMS [26, 27] and ATLAS [24, 28] measurements agree well with the SM predictions.
4 Summary
In this overview we summarized some of the recent measurements related to the production of the W and Z bosons, more information can be found in the references. All experiments, both at the Tevatron and the LHC, performed cross section measurements of different channels, charged and forward-backward asymmetry measurements, set limits on ATGCs. Since the cross sections are increasing with the center-of-mass energy, the LHC has an opportunity to improve all the measurements, which are statistically limited at the Tevatron. Especially in the diboson production, the LHC profits from both the increased production cross section and the integrated luminosity. In the 2010-2012 LHC data taking periods the total integrated luminosity of proton-proton collisions is expected to reach 25–30 fb-1.
The results of the measurements are generally well described by the SM predictions. The theoretical systematics play a major role in some of the measurements already.
References
- [1] CMS Collaboration, CMS-PAS-SMP-12-011 (2012).
- [2] CMS Collaboration, JHEP 10 (2011) 132.
- [3] ATLAS Collaboration, Phys.Rev. D85 (2012) 072004.
- [4] CMS Collaboration, CMS-PAS-EWK-11-007 (2011).
- [5] LHCb Collaboration, LHCb-CONF-2012-013 (2012).
- [6] ATLAS, CMS and LHCb Collaborations, ATLAS-CONF-2011-129 (2011).
- [7] ATLAS Collaboration, Eur.Phys.J C72 (2012) 2001.
- [8] CMS Collaboration, Phys.Rev.Lett. 107 (2011) 021802.
- [9] D0 Collaboration, Phys.Rev. D84 (2011) 012007.
- [10] CMS Collaboration, Phys.Rev. D84 (2011) 112002.
- [11] J.M. Campbell and R.K. Ellis, Nucl.Phys.Proc.Suppl., 205 (2010) 10.
- [12] ATLAS Collaboration, arXiv:1205.2531[hep-ex] (2012)
- [13] D0 Collaboration, Phys.Rev.Lett. 107 (2011) 241803.
- [14] D0 Collaboration, Phys.Rev.D 85 (2012) 052001.
- [15] CDF Collaboration, Phys.Rev.Lett. 107 (2011) 051802.
- [16] ATLAS Collaboration, ATLAS-CONF-2012-025 (2012).
- [17] CMS Collaboration, PAS-CMS-SMP-12-005 (2012).
- [18] CMS Collaboration, PAS-CMS-SMP-12-013 (2012).
- [19] ATLAS Collaboration, arXiv:1208.1390[hep-ex] (2012)
- [20] D0 Collaboration, Phys.Rev.D 85 (2012) 112005.
- [21] CDF Collaboration, arXiv:1202.6629[hep-ex] (2012).
- [22] D0 Collaboration, arXiv:1208.5458[hep-ex] (2012)
- [23] CMS Collaboration, CMS-PAS-EWK-11-010 (2011).
- [24] ATLAS Collaboration, arXiv:1211.6096[hep-ex] (2012)
- [25] CMS Collaboration, arXiv:1210.3844[hep-ex] (2012)
- [26] CMS Collaboration, arXiv:1211.4890[hep-ex] (2012)
- [27] CMS Collaboration, CMS-PAS-EWK-11-010 (2011).
- [28] ATLAS Collaboration, ATLAS-CONF-2012-090 (2012).