All optical quantum control of a spin-quantum state and ultrafast transduction into an electric current
pacs:
78.67.Hc 78.47.J- 85.35.BeThe ability to control and exploit quantum coherence and entanglement drives research across many fields ranging from ultra-cold quantum gases to spin systems in condensed matter. Transcending different physical systems, optical approaches have proven themselves to be particularly powerful, since they profit from the established toolbox of quantum optical techniques, are state-selective, contact-less and can be extremely fast. Here, we demonstrate how a precisely timed sequence of monochromatic ultrafast ( ps) optical pulses, with a well defined polarisation can be used to prepare arbitrary superpositions of exciton spin states in a semiconductor quantum dot, achieve ultrafast control of the spin-wavefunction without an applied magnetic field and make high fidelity read-out the quantum state in an arbitrary basis simply by detecting a strong ( pA) electric current flowing in an external circuit. The results obtained show that the combined quantum state preparation, control and read-out can be performed with a near-unity () fidelity. Our methods are fully applicable to other quantum systems and have strong potential for scaling to more complex systems such as molecules and spin-chains.
Since the first proposals to use localised spins in solids as prototype quantum systems Loss and DiVincenzo (1998); Imamoglu et al. (1999) much progress has been made using both electrons and holes in semiconductor quantum dots (QDs). Methods such as optical pumping Atat re et al. (2006); Kim et al. (2011); Greilich et al. (2011); Weiss et al. (2012) and selective tunnel ionisation of spin polarised carriers Kroutvar et al. (2004); Heiss et al. (2007, 2008); Godden et al. (2010, 2012); Ramsay et al. (2008); Muller et al. (2012) have been developed for reliable quantum state preparation and sensitive state readout can now be performed via spin-selective resonant fluorescence Vamivakas et al. (2009, 2010) or absorption Heiss et al. (2008); Jovanov et al. (2011); Ramsay et al. (2008); Muller et al. (2012). Recently, magnetic fields have been applied to achieve all optical coherent control of spin quantum states, for both large ensembles of dotsGreilich et al. (2009) and single spins Press et al. (2008); De Greve et al. (2011); Godden et al. (2012). Whilst electron and hole spins have long lifetimes Kroutvar et al. (2004); Heiss et al. (2007) and robust quantum coherence () extending into the microsecond range Godden et al. (2012); Greilich et al. (2011); Xu et al. (2008) the neutral exciton spin has the advantage that arbitrarily polarised optical pulses can be used for quantum state control Kodriano et al. (2012). However, exciton spin coherence persists over comparatively short timescales that are fundamentally limited by spontaneous emission ( ns) Borri et al. (2001), necessitating ultrafast coherent control and readout.
Very recently, coherent control of the exciton spin has been demonstrated at zero magnetic field by utilising the e-h exchange coupling to provide exciton spin rotations upon applying -optical pulses to excited biexciton transitions in single dots Poem et al. (2011); Kodriano et al. (2012) or by utilising e-e exchange interactions in QD-molecules Kim et al. (2008). All experiments reported to date require several laser control fields that are finely tuned to different transitions of the charged exciton manifold, calling for careful characterisation of each quantum sub-system and / or precise control of interdot couplings.
Here, we describe how a sequence of three fully resonant optical pulses, each having a precisely controlled optical polarisation, can be used to (i) prepare an arbitrary exciton spin superposition in an individual semiconductor QD without a magnetic field, (ii) perform high-fidelity arbitrary spin rotations on the Bloch sphere and (iii) read out the spin wavefunction in an arbitrary measurement basis. The weak electron-hole exchange coupling (eV) that exists for neutral excitons in III-V quantum dots Finley et al. (2002); Xu et al. (2008) is shown to facilitate ultrafast spin control without the need to apply external magnetic fields by accumulating a polarisation dependent geometric phase during the presence of the control pulse. Futhermore, we precisely measure the quantum spin state with unprecedented fidelity simply by detecting a large ( pA) electric current flowing in an external circuit attached to the dot. All-optical, ultrafast, high-fidelity spin preparation, control and read-out is demonstrated in an arbitrary basis with near unity fidelities () limited only by the fA electrical noise in the readout circuit.
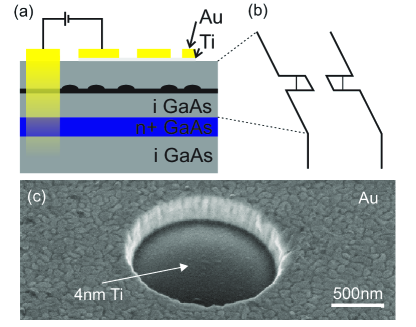
The sample investigated consists of a layer of low density self-assembled InGaAs quantum dots embedded into the intrinsic region of a electrically tunable n-i-Schottky diode Findeis et al. (2001); Zrenner et al. (2002) (see supplementary information). This device geometry facilitates complementary photoluminescence (PL) emission and photocurrent (PC) absorption measurements by varying the applied electric field Jovanov et al. (2011); Fry et al. (2000); Findeis et al. (2001). As described in the supplementary information, we derive three independent ps-pulse trains from a single fs pulse that are individually tunable in energy, pulse area and relative time delay. The polarisation state of each pulse is precisely controlled using liquid crystal variable retarders and waveplates. By tuning the electric field very close to the transition from the PL to the PC regime ( kV/cm Müller et al. (2011)) we detect the photocurrent induced in the sample by allowing carriers to tunnel out of the dot over timescales of several hundred picoseconds Müller et al. (2012); Muller et al. (2012) using a low-noise current-voltage converter. Blocking and unblocking the pump beam reveals the pump-induced change of the probe induced photocurrent . The quantities and can be interpreted as the absorption of the quantum dot and its pump-induced change, respectively.
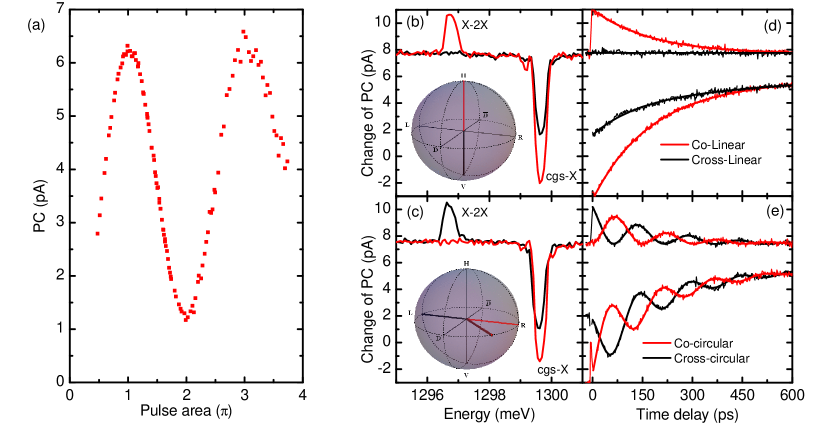
We begin by identifying the crystal ground state () to neutral exciton () transition in both PL and single pulse PC measurements. All data presented in this manuscript were recorded at 4.2K for a fixed applied electric field of . Under these conditions, the transition is at for the dot investigated. Figure 1a shows the amplitude of the photocurrent induced by a single, ps duration pump pulse tuned to as a function of the pulse area. Very clean Rabi oscillations are observed Zrenner et al. (2002); Ramsay et al. (2008) calibrating the laser power needed to fully invert the transition (-pulse) and clearly demonstrating the coherent nature of the interaction between the driving laser field and the electrically contacted QD studied. We then continued to perform two pulse experiments where the energy of the first (pump) pulse is tuned to and the pulse area is carefully set to . The second (probe) pulse is then tuned over a meV window in the immediate spectral vicinity of . The result of such a pump-probe experiment is presented in fig. 1b that shows as a function of the probe pulse energy for a time delay of between pump and probe. In this experiment, the polarisation of the pump pulse was set to be linear, aligned along the crystal axis and the probe pulse was set to be either co-linear or cross-linear to the pump for the red and black curves presented in the figure, respectively. The data clearly shows a pump induced bleachingMuller et al. (2012) of the transition at (negative going dip) and conditional absorption (positive going peak at ) arising from the transition, red detuned by Zecherle et al. (2010); Ramsay et al. (2008); Müller et al. (2012) from . The conditional absorption of the transition is only present for co-linear polarisations (red) and is entirely absent for the cross-linear configuration. Careful examination of fig. 1b shows that the bleaching of the transition is much stronger for the co-linear configuration, as compared with the cross linear polarisation. These findings can be explained as follows: The polarisation state of the exciton can be represented on the Bloch sphere as illustrated schematically in the inset of fig. 1b, whereby the upper and lower states are the horizontal () and vertical () energy eigenstates of the exciton defined by the anisotropic e-h exchange coupling in the excitonFinley et al. (2002). All states on the Bloch sphere can be written as coherent superpositions of these states. In terms of the single particle spin eigenstates and for electrons ( and for holes) and can be written as and and an arbitrary spin wave function is defined with the phase factors and , with a wavefunction . The optically active spin basis states that are represented by Bloch vectors along the and axis of the Bloch sphere are , and , , respectively Benny et al. (2011). Due to the optical selection rules for interband optical transitions, pulses resonant with having () polarisaion create excitons in the spin states () and linear polarisations parallel (perpendicular) to the [110] crystal axis will directly excite the spin eigenstates () in the presence of anisotropic exchange interactionFinley et al. (2002). The polarisation state of the optical pulses on the Poincaré sphere is directly mapped onto the exciton spin. For the data presented in fig. 1b we created an exciton in the state . Therefore, the biexciton can only be created using a co-linear polarisation since the conditional absorption for cross-linear polarisations is Pauli spin forbidden. In comparison, the strong bleaching of the transition in fig. 1b arises for cross-linear polarisations due to the fact that, as long as the dot is occupied by an electron and/or hole, the probe pulse cannot be absorbed. For co-linear polarisations (fig. 1b - red curve) the probe pulse causes stimulated emission resulting in a further reduction of and a deeper dip. Figure 1c shows data recorded for the same experiment as fig. 1b, but repeated for co- (cross-) circular polarisations of pump and probe. Since stimulated emission is only possible if the polarisation of the probe pulse matches the exciton spin, the bleaching in fig. 1c is much stronger for co-circular polarisations as expected. Similarly, the biexciton can only be created using cross-circular polarisations as evidenced by the absence of the peak for the co-circular polarisation configuration of pump and probe. Figures 1d and 1e show the evolution of with probe pulse tuned to the and transitions, respectively. As the time delay between pump and probe increases, both the conditional absorption of and bleaching of transitions decrease exponentially due to tunnelling of electrons and holes out of the dot and radiative recombination ( lifetime). Fits to the data using rate equation model of sequential electron and hole tunnelling (see refs Zecherle et al. (2010); Muller et al. (2012) and supplementary information) are presented as solid lines and are in excellent agreement with the measured data, revealing an exciton lifetime of . In figure 1d the spin-selectivity of the conditional absorption as well as the stimulated emission remain unchanged for all time delays. In strong contrast, when exciting with circularly polarised light (figure 1e) we observe antiphased oscillations for co- and cross-polarised pump and probe pulses. This observation can be readily understood since initialising the exciton spin with a circularly polarised pulse creates an exciton spin state on the equatorial plane of the Bloch sphere. This is a superposition of the energy eigenstates, whereupon the Bloch vector precesses about the z-axis. The anti-phased oscillations observed in fig. 1e correspond to the projection of the exciton spin onto and . For the data presented in fig. 1d, where we initialised an exciton spin into the state, the Pauli spin-blockade of the transition and spin-selectivity of the stimulated emission remain the same for all time delays reflects the fact that the exciton spin decay time is much longer than the exciton lifetime. Clearly, the conditional absorption of in fig. 1e repeatedly approaches zero and the envelope of the amplitude as obtained from fig. 1d for all time delays reflects the fact that the precession is fully coherent with also much longer than the exciton lifetime. Thereby, the measured precession period of indicates a fine structure splitting of . In addition, the combined fidelity of initialisation and readout is estimated to be , limited only by the fA noise in the photocurrent readout. As a key result, these results demonstrate that by probing the stimulated emission of the transition it is possible to read-out the spin projection in a fully resonant configuration of pump and probe.
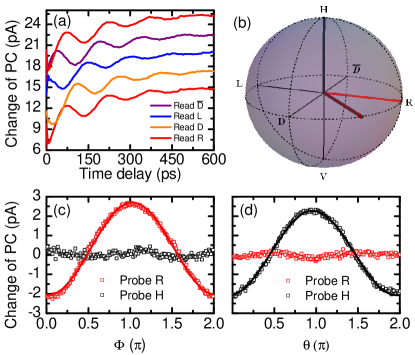
Next, we demonstrate that we can initialise and read out arbitrary exciton spin states. To demonstrate the readout projection along specific axis, we present in fig. 2a as a function of the time delay upon probing the transition with the polarisation of the pump pulse fixed to and different readout polarisations , , and (c.f. fig. 2b). Clearly extremely similar decaying oscillations are observed which are successively phase shifted by , reflecting the harmonic precession of the Bloch vector around the z-axis due to e-h exchange coupling. In order to demonstrate the arbitrary initialisation, we present in figs. 2c and 2d for a fixed time delay between pump and probe of and two different readout projections and in red and black respectively. Thereby, the angle of the pump polarisation is varied continuously along the equatorial plane (). As the figure shows, the projection (red curve) follows a sinusoidal dependence (solid line - fig. 2c). In contrast, the projection on (black curve) remains constant indicating a near perfect initialisation of the Bloch vector in the equatorial plane. In figure 2d the same projections are measured for varying the initialisation angle along a vertical cut through the Bloch sphere (). Here, the projection of follows a sinusoidal line (solid line - fig. 2d), while the projection on stays constant. Thereby, the errors of the fits indicate a combined fidelity of the initialisation and readout mainly limited by the 80fA readout noise.
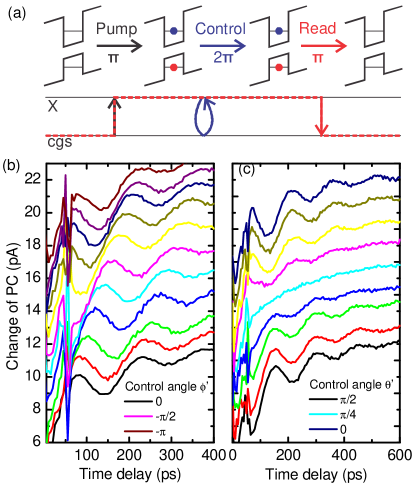
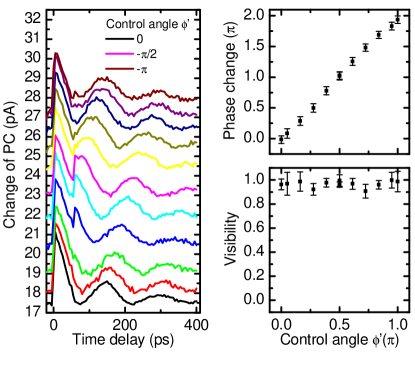
We continue to demonstrate ultrafast, high-fidelity and arbitrary optical control of the exciton spin wavefunction using the measurement sequence depicted schematically in fig. 3a. Our approach is based on the use of a precisely polarised -pulse tuned to be fully-resonant with the transitionnon to perform geometric phase control Economou et al. (2006); Economou and Reinecke (2007); Takagahara (2010); Poem et al. (2011). Here, as the control pulse interacts with the system it coherently mixes the and states before returning the population fully to as the pulse switches off. However, the phase accumulated by the exciton wavefunction during the presence of the control pulse is uniquely defined by the polarisation state of the control pulse - its direction on the Poincaré sphereTakagahara (2010). By setting the polarisation to a direction defined by the angles and , with respect to initial orientation of the Bloch vector, the result of the control pulse is a rotation of the exciton spin Bloch vector by angles of and along the polar and azimuthal directions, respectively Economou et al. (2006); Economou and Reinecke (2007); Takagahara (2010). Experimentally, we have tested these ideas by initialising the exciton spin on the equatorial plane using a -circularly polarised -pulse resonant with the transition. Following a time delay of , during which the phase of the spin wavefunction evolves freely, we apply the -control laser pulse and finally read out the spin projection fully resonantly via the spin-selectivity of the stimulated emission signal induced by a third, -circularly polarised -pulse. The results of these investigations are presented in fig. 3 for spin rotations around two orthogonal axes - and .
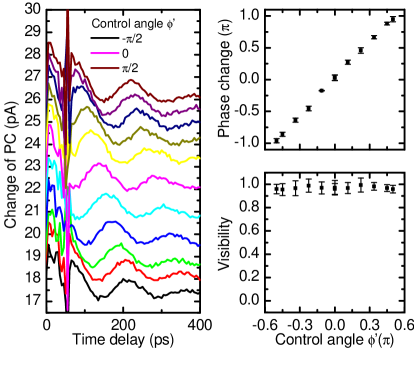
In fig. 3b we plot for different control polarisations and . Clearly, the oscillations recorded for different control pulse angles have the same amplitude but are controllably phase-shifted by , as expected. This demonstrates arbitrary rotations of the exciton spin Bloch vector throughout the equatorial plane. In fig. 3c, we present similar experiments using control pulses which have the polarisation and different angles . Clearly, the phase of oscillations induced by the e-h exchange coupling remain the same while the amplitude of the oscillations changes. Notably, for the exciton spin is rotated to the top of the Bloch sphere and the amplitude of the oscillation vanishes since the system is rotated into the eigenstate. For larger rotation angles , the exciton spin is rotated beyond the -axis of the Bloch sphere, such that the amplitude of the oscillations changes its sign, as expected (fig. 3c). Similar measurements performed for arbitrary initialisation directions of the exciton spin and arbitrary rotations (not presented) revealed qualitatively similar levels of control.
The demonstration of arbitrary spin rotations about two orthogonal axes demonstrates arbitrary coherent control of the spin wavefunction over timescales as fast as using a single, resonant optical pulse. It is important to note that these experiments demonstrate universal, all-optical exciton spin initialisation, control and readout over picosecond timescales. Moreover, as discussed in the supplementary information the amplitude of the oscillations remain practically unaffected by the control pulse, indicating that the control can be performed with very high fidelity. The fully resonant preparation, control and readout scheme presented here is much more convenient than complex multi-colour experiments, especially when considering systems consisting of a number of interacting exciton qubits.
For a quantitative analysis, we fitted the data presented in fig. 3 using
| (1) |
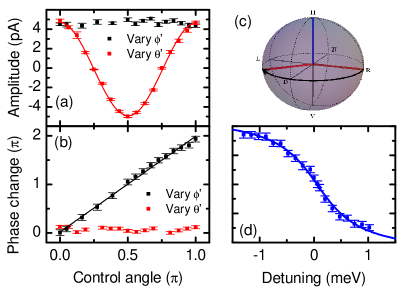
,where is the electron(hole) tunnelling escape rate from the dot, GHz the radiative recombination rate, the oscillation period due to e-h exchange and is the phase of the oscillation (see supplementary information). The amplitudes and denote the perpendicular and parallel amplitudes of the spin projection onto the polarisation of the readout pulse, quantities that are plotted in fig. 4a as a function of (black points) and (red points). Clearly the amplitudes for varying remain the same within the experimental error () while the amplitudes for varying are very well represented by a cosine function. Thereby, small variations of the amplitudes appear to be random and, therefore, are most likely to result from laser power and polarisation fluctuations and drifts in the experimental setup and are not gating errors Takagahara (2010). The phase shifts as a function of the control pulse angles are presented in fig. 4b as a function () in black (red). Clearly, for varying , the phases vary with a slope very close to 2, as expected for geometric phase controlEconomou and Reinecke (2007), while for a variation of the phases remain constant and shift by for control angles larger than . To ensure that the small variations of the amplitude result from power variations and drifts and not from a reduced visibility of the fringes we repeated the experiment presented in fig. 3c but using non-resonant readout pulses tuned to the transition. These experiments (not shown - see supplementary data) exhibited results very similar to the data shown in fig. 4, a comparable fidelity of being observed, in good agreement with the values obtained here.
Finally, we explored the influence of energetically detuning the control pulse from the transition, since such detuned pulses have the potential to achieve phase control and further improve gating fidelityBenny et al. (2011); Takagahara (2010) . The configuration of this experiment is schematically illustrated in figure 4c. For exciton spins at and we apply control pulses with a polarisation of . Without detuning, the control pulse rotates the spin to . However, the detuning of the control pulse energy from the transition determines the rotation angle about the z axis whereby the phase shift is given by
| (2) |
for secant pulses with a bandwidth and a detuning Economou et al. (2006); Economou and Reinecke (2007); Kodriano et al. (2012). The results of these experiments are presented in fig. 4d that shows the phase shift as a function of the control pulse detuning. A fit to the data with eqn 1 is presented as a solid line and produces excellent agreement using a pulse bandwidth of in excellent accord with the measured control pulse bandwidth of and measured pulse duration of using autocorrelation.
In summary, we have demonstrated the arbitrary initialisation, full coherent control and readout of a single exciton spin in an InGaAs quantum dot using ps pulses. We have presented a direct mapping of the polarisation of a resonant laser pulse to the exciton spin with a combined initialisation and readout fidelity . We have shown that the spin can be read out either by the spin selective absorption of the transition as well as the spin-selective stimulated emission of . In addition, we have presented the high-fidelity full coherent optical control using ps-pulses that are also resonant with the transition.
We gratefully acknowledge financial support from the DFG via SFB-631, the Nanosystems Initiative Munich (NIM) and the EU via the integrated project SOLID. GA thanks the TUM Institute for Advanced Study for support.
I Sample structure
The samples investigated consist of a single layer of low density () self-assembled InGaAs quantum dots grown via molecular beam epitaxy embedded within the intrinsic region of a thick n-type GaAs Schottky photodiode. The layer structure and resulting band diagram are schematically illustrated in figures S1a and b, respectively. Such devices facilitate complementary photocurrent absorption (PC) and photoluminescence emission (PL) measurements as a function of the internal electric field ()Fry et al. (2000); Findeis et al. (2001). To spatially address single quantum dots for optical investigation and make it easier to re-locate them for systematic studies sized apertures are fabricated in the opaque 200nm thick gold layer on the top contact. A scanning electron microscopy image of a typical aperture is presented in figure S1c. These apertures are fabricated by the deposition of polystyrene nanospheres before the deposition of the gold layer. The polystyrene nanospheres act as shadow masks during the deposition of the gold layer and are mechanically removed after Au deposition to produce circular apertures through which optical spectroscopy measurements can be performed.
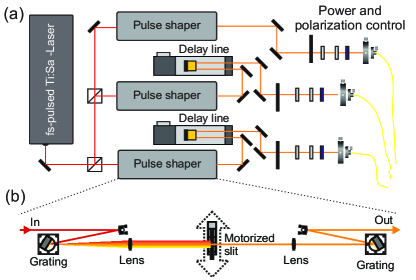
II Measurement techniques
The primary measurement technique used in this paper is ultrafast pump-probe spectroscopy. The setup used for the pump-probe experiments with photocurrent readout is presented schematically in figure S2. Starting with a duration pulse from a tunable Ti:Sa laser (figure S1a left) three independently tunable pulse trains (pump, control and the probe pulses) are derived using a balanced set of three 4f pulse-shapers (figure S1a bottom). The relative time delay between the three pulse trains is precisely controlled using a delay line (figure S1a center) that provides a temporal relative tuning range from . The operating principle of the 4f pulse-shaper is illustrated in figure S1b and ref. Ramsay et al. (2008). The incident beam (left) is spectrally dispersed using a ruled grating and made parallel using an lens. A tunable slit positioned on a motorised linear stage (center) filters the light in the Fourier plane to transmit spectrally narrow pulses out of the broadband input. The power of the three pulses can be individually tuned using variable neutral density filters. The polarisation of the three pulses is individually controlled using the combination of a plate, a thin film linear polariser and liquid crystal retarders. Measurements of the performance of our pulse shapers are presented in ref Müller et al. (2012).The pulses are sent to a low-temperature confocal microscope using optical fibres where they are superimposed co-linearly and focused onto the sample. Thereby, the low-temperature microscope consists of a sample stick filled with He-exchange gas inside a liquid helium dewar and the sample is moved using attocube piezo stepper motors. The photocurrent induced in the sample is measured using a low-noise Ithaco model 1211 current-voltage converter and an Agilent 34411A digital multimeter. A programmable voltage source (Keithley model 2400) connected in series with the amplifier is used to apply a gate voltage to the sample and, thus, control the internal electric field in the intrinsic region of the devices into which the QDs are embedded. Blocking and unblocking the pump beam reveals the pump induced change of the probe induced photocurrent . The quantities and can be interpreted as the absorption of the QD nanostructure and its pump induced change, respectively Zecherle et al. (2010). In this representation, a positive value of corresponds to pump induced absorption whereas negative corresponds to bleaching.
III Rate equation model
In order to fit the measurements of as a function of the time delay between pump and probe we use a rate equation model of sequential electron and hole tunnelling Zecherle et al. (2010); Muller et al. (2012); Müller et al. (2012, 2012). In this model, at delay times of the pump pulse generates the initial occupation of the state and of the crystal ground state (cgs). Subsequently, electrons and holes tunnel out with the independent rates and , respectively. Thereby, the tunnelling time of the electron () with its smaller effective mass is much shorter than that of the hole () Fry et al. (2000); Oulton et al. (2002). Therefore, the model takes into account the intermediate level where the QD is occupied with a single hole . Taking also into account the radiative recombination of the exciton with the rate the set of differential equations that describe the rate equation model can be written as:
| (3) |
Then, the analytic solution of the rate equations that describe the time dependent populations under these initial conditions are
| (4) |
with . Probing an optical transition results in a probe-induced photocurrent with an amplitude that is proportional to the difference of the occupations of the initial state and the final state. Since the final state of the and transitions are not occupied before probing, the number of the positively charged QDs () and the X population () can be directly compared to the temporal scans probing the and transitions, respectively. Probing the transition results in a population inversion () and the fitting functions are:
| (5) |
| (6) |
| (7) |
with . Finally, taking into account the spin selectivity of the conditional absorption and stimulated emission the fitting functions are:
| (8) |
| (9) |
whereby denotes the oscillation period and the phase. The amplitudes and denote the amplitudes of the projection on the polarisation of the readout pulse and perpendicular to it.
IV Estimation of fidelity
In figures 3 and 4 of the paper we performed the coherent control and readout for pulses in resonance with the transition. Therefore, the oscillating stimulated emission of the readout is superimposed with the exponential bleaching of the transition. In order to investigate the fidelity of the coherent control in more detail, we performed the same experiment as presented in figure 3b for readout pulses tuned to the transition. The result of this experiment is presented in figure S3a. The figure shows for different control angles and . Clearly oscillations that are fully modulated and shifted in phase are observed. For a quantitative analysis we fit the data with the rate equation model described above and present the phase shifts in figure S3b and the visibility of the oscillations in figure S3c as a function of the control pulse polarisation angle . Clearly the phase shift (figure S3b) has a slope of two while the visibility of the oscillations (figure S3c) is close to 1 with no systematic variations. A statistical analysis results a visibility of .
V Control via the transition
To demonstrate that the coherent optical control is also possible for control pulses tuned to the transition we present the same experiment as presented in figure S3 in figure S4 for control pulses tuned to the transition. Again, figure S4a shows for different control pulse polarisation angles and and fully modulated oscillations that are phase shifted are observed. The results of fits with the rate equation model described above are presented in figure S4b and c that show phase shifts in figure S4b and the visibility of the oscillations in figure S4c as a function of the control pulse polarisation angle . Again, the slope of the phase shift (figure S4b) is 2, demonstrating that coherent control is also possible for control pulses tuned to the transition and and analysis of the visibility of the oscillations (figure S4c) results a value of .
References
- Loss and DiVincenzo (1998) D. Loss and D. P. DiVincenzo, Phys. Rev. A 57, 120 (1998).
- Imamoglu et al. (1999) A. Imamoglu, D. D. Awschalom, G. Burkard, D. P. DiVincenzo, D. Loss, M. Sherwin, and A. Small, Phys. Rev. Lett. 83, 4204 (1999).
- Atat re et al. (2006) M. Atat re, J. Dreiser, A. Badolato, A. H gele, K. Karrai, and A. Imamoglu, Science 312, 551 (2006), http://www.sciencemag.org/content/312/5773/551.full.pdf .
- Kim et al. (2011) D. Kim, S. G. Carter, A. Greilich, A. S. Bracker, and D. Gammon, Nature Physics 7, 223 (2011).
- Greilich et al. (2011) A. Greilich, S. G. Carter, D. Kim, A. S. Bracker, and D. Gammon, Nature Photonics 5, 703 (2011).
- Weiss et al. (2012) K. M. Weiss, J. M. Elzerman, Y. L. Delley, J. Miguel-Sanchez, and A. Imamoğlu, Phys. Rev. Lett. 109, 107401 (2012).
- Kroutvar et al. (2004) M. Kroutvar, Y. Ducommun, D. Heiss, M. Bichler, D. Schuh, G. Abstreiter, and J. Finley, Nature 432, 81 (2004).
- Heiss et al. (2007) D. Heiss, S. Schaeck, H. Huebl, M. Bichler, G. Abstreiter, J. J. Finley, D. V. Bulaev, and D. Loss, Phys. Rev. B 76, 241306 (2007).
- Heiss et al. (2008) D. Heiss, V. Jovanov, M. Bichler, G. Abstreiter, and J. J. Finley, Phys. Rev. B 77, 235442 (2008).
- Godden et al. (2010) T. M. Godden, S. J. Boyle, A. J. Ramsay, A. M. Fox, and M. S. Skolnick, Applied Physics Letters 97, 061113 (2010).
- Godden et al. (2012) T. M. Godden, J. H. Quilter, A. J. Ramsay, Y. Wu, P. Brereton, S. J. Boyle, I. J. Luxmoore, J. Puebla-Nunez, A. M. Fox, and M. S. Skolnick, Phys. Rev. Lett. 108, 017402 (2012).
- Ramsay et al. (2008) A. J. Ramsay, S. J. Boyle, R. S. Kolodka, J. B. B. Oliveira, J. Skiba-Szymanska, H. Y. Liu, M. Hopkinson, A. M. Fox, and M. S. Skolnick, Phys. Rev. Lett. 100 (2008), 10.1103/PhysRevLett.100.197401.
- Muller et al. (2012) K. Muller, A. Bechtold, C. Ruppert, C. Hautmann, J. S. Wildmann, T. Kaldewey, M. Bichler, H. J. Krenner, G. Abstreiter, M. Betz, and J. J. Finley, Phys. Rev. B 85, 241306 (2012).
- Vamivakas et al. (2009) A. N. Vamivakas, Y. Zhao, C.-Y. Lu, and M. Atatuere, Nature Physics 5, 198 (2009).
- Vamivakas et al. (2010) A. N. Vamivakas, C. Y. Lu, C. Matthiesen, Y. Zhao, S. Falt, A. Badolato, and M. Atatuere, Nature 467, 297 (2010).
- Jovanov et al. (2011) V. Jovanov, S. Kapfinger, M. Bichler, G. Abstreiter, and J. J. Finley, Phys. Rev. B 84, 235321 (2011).
- Greilich et al. (2009) A. Greilich, S. E. Economou, S. Spatzek, D. R. Yakovlev, D. Reuter, A. D. Wieck, T. L. Reinecke, and M. Bayer, Nature Physics 5, 262 (2009).
- Press et al. (2008) D. Press, T. D. Ladd, B. Zhang, and Y. Yamamoto, Nature 456, 218 (2008).
- De Greve et al. (2011) K. De Greve, P. L. McMahon, D. Press, T. D. Ladd, D. Bisping, C. Schneider, M. Kamp, L. Worschech, S. Hoefling, A. Forchel, and Y. Yamamoto, Nature Physics 7, 872 (2011).
- Xu et al. (2008) X. Xu, B. Sun, P. R. Berman, D. G. Steel, A. S. Bracker, D. Gammon, and L. J. Sham, Nature Physics 4, 692 (2008).
- Kodriano et al. (2012) Y. Kodriano, I. Schwartz, E. Poem, Y. Benny, R. Presman, T. A. Truong, P. M. Petroff, and D. Gershoni, Phys. Rev. B 85, 241304 (2012).
- Borri et al. (2001) P. Borri et al., Phys. Rev. Lett. 87, 0157401 (2001).
- Poem et al. (2011) E. Poem, O. Kenneth, Y. Kodriano, Y. Benny, S. Khatsevich, J. E. Avron, and D. Gershoni, Phys. Rev. Lett. 107, 087401 (2011).
- Kim et al. (2008) D. Kim et al., Phys. Rev. Lett. 101, 236804 (2008).
- Finley et al. (2002) J. J. Finley, D. J. Mowbray, M. S. Skolnick, A. D. Ashmore, C. Baker, A. F. G. Monte, and M. Hopkinson, Phys. Rev. B 66, 153316 (2002).
- Findeis et al. (2001) F. Findeis, M. Baier, E. Beham, A. Zrenner, and G. Abstreiter, Applied Physics Letters 78, 2958 (2001).
- Zrenner et al. (2002) A. Zrenner, E. Beham, S. Stufler, F. Findeis, M. Bichler, and G. Abstreiter, Nature 418, 612 (2002).
- Fry et al. (2000) P. Fry, J. Finley, L. Wilson, A. Lemaitre, D. Mowbray, M. Skolnick, M. Hopkinson, G. Hill, and J. Clark, Applied Physics Letters 77, 4344 (2000).
- Müller et al. (2011) K. Müller, G. Reithmaier, E. C. Clark, V. Jovanov, M. Bichler, H. J. Krenner, M. Betz, G. Abstreiter, and J. J. Finley, Phys. Rev. B 84, 081302 (2011).
- Müller et al. (2012) K. Müller, A. Bechtold, C. Ruppert, M. Zecherle, G. Reithmaier, M. Bichler, H. J. Krenner, G. Abstreiter, A. W. Holleitner, J. M. Villas-Boas, M. Betz, and J. J. Finley, Phys. Rev. Lett. 108, 197402 (2012).
- Zecherle et al. (2010) M. Zecherle, C. Ruppert, E. C. Clark, G. Abstreiter, J. J. Finley, and M. Betz, Phys Rev B 82, 125314 (2010).
- Benny et al. (2011) Y. Benny, S. Khatsevich, Y. Kodriano, E. Poem, R. Presman, D. Galushko, P. M. Petroff, and D. Gershoni, Phys. Rev. Lett. 106, 040504 (2011).
- (33) Non-resonant state control can also be achieved by applying the control pulse to be resonant with the transition as in the work of ref. Poem et al. (2011).
- Economou et al. (2006) S. E. Economou, L. J. Sham, Y. Wu, and D. G. Steel, Phys. Rev. B 74, 205415 (2006).
- Economou and Reinecke (2007) S. E. Economou and T. L. Reinecke, Phys. Rev. Lett. 99, 217401 (2007).
- Takagahara (2010) T. Takagahara, J. Opt. Soc. Am. B 27, A46 (2010).
- Müller et al. (2012) K. Müller, A. Bechtold, C. Ruppert, T. Kaldewey, M. Zecherle, J. Wildmann, M. Bichler, H. Krener, J. M. Villas-Bôas, G. Abstreiter, and J. J. Betz, M.and Finley, (2012), Annalen der Physik, in press.
- Oulton et al. (2002) R. Oulton, J. J. Finley, A. D. Ashmore, I. S. Gregory, D. J. Mowbray, M. S. Skolnick, M. J. Steer, S.-L. Liew, M. A. Migliorato, and A. J. Cullis, Phys. Rev. B 66, 045313 (2002).